 |
| This NASA satellite image shows how the Arctic sea ice extent, on Sept. 16, 2012, compares to the average minimum extent over the past 30 years (in yellow). Credit: NASA/Goddard Scientific Visualization Studio. |
Sea ice extent—defined by NSIDC as the total area covered by at least 15 percent of ice—fell to 3.41 million square kilometers (1.32 million square miles), now the lowest summer minimum extent in the 33-year satellite record.
NSIDC adds that this minimum is 49% below the 1979 to 2000 average, as illustrated by the table below.
| YEAR | MINIMUM ICE EXTENT | DATE | |
|---|---|---|---|
| IN MILLIONS OF SQUARE KILOMETERS | IN MILLIONS OF SQUARE MILES | ||
| 2007 | 4.17 | 1.61 | September 18 |
| 2008 | 4.59 | 1.77 | September 20 |
| 2009 | 5.13 | 1.98 | September 13 |
| 2010 | 4.63 | 1.79 | September 21 |
| 2011 | 4.33 | 1.67 | September 11 |
| 2012 | 3.41 | 1.32 | September 16 |
| 1979 to 2000 average | 6.70 | 2.59 | September 13 |
| 1979 to 2010 average | 6.14 | 2.37 | September 15 |

NSIDC adds that the six lowest seasonal minimum ice extents in the satellite record have all occurred in the last six years (2007 to 2012). In contrast to 2007, when climatic conditions (winds, clouds, air temperatures) favored summer ice loss, this year’s conditions were not as extreme. Summer temperatures across the Arctic were warmer than average, but cooler than in 2007. The most notable event was a very strong storm centered over the central Arctic Ocean in early August. It is likely that the primary reason for the large loss of ice this summer is that the ice cover has continued to thin and become more dominated by seasonal ice. This thinner ice was more prone to be broken up and melted by weather events, such as the strong low pressure system just mentioned. The storm sped up the loss of the thin ice that appears to have been already on the verge of melting completely.
NASA says that this year, a powerful cyclone formed off the coast of Alaska and moved on August 5 to the center of the Arctic Ocean, where it churned the weakened ice cover for several days. The storm cut off a large section of sea ice north of the Chukchi Sea and pushed it south to warmer waters that made it melt entirely. It also broke vast extensions of ice into smaller pieces more likely to melt.
“The storm definitely seems to have played a role in this year's unusually large retreat of the ice”, said Claire Parkinson, a climate scientist at NASA Goddard Space Flight Center, Greenbelt, Md. “But that exact same storm, had it occurred decades ago when the ice was thicker and more extensive, likely wouldn't have had as prominent an impact, because the ice wasn't as vulnerable then as it is now.”
“The storm definitely seems to have played a role in this year's unusually large retreat of the ice”, said Claire Parkinson, a climate scientist at NASA Goddard Space Flight Center, Greenbelt, Md. “But that exact same storm, had it occurred decades ago when the ice was thicker and more extensive, likely wouldn't have had as prominent an impact, because the ice wasn't as vulnerable then as it is now.”
In the press release, NSIDC lead scientist Ted Scambos said that thinning ice, along with early loss of snow, are rapidly warming the Arctic. “But a wider impact may come from the increased heat and moisture the warmer Arctic is adding to the climate system,” he said. “This will gradually affect climate in the areas where we live,” he added. “We have a less polar pole—and so there will be more variations and extremes.”
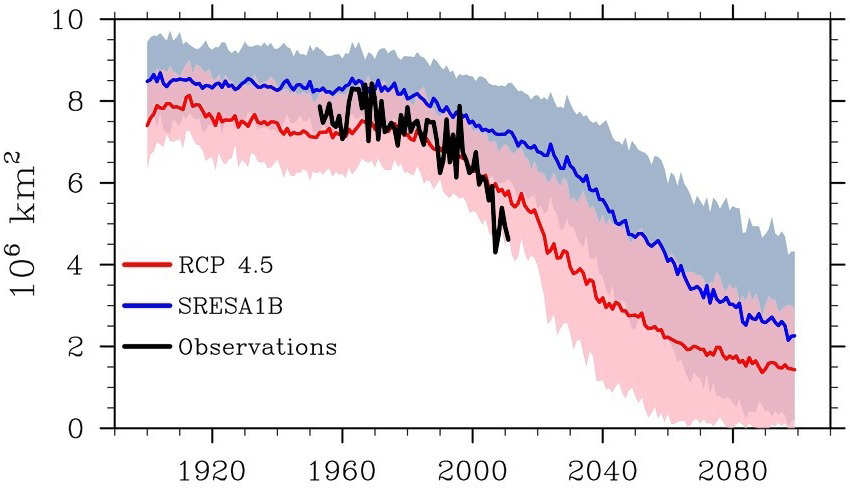
The image below, from Arctic Sea Ice Blog, shows Arctic sea ice observations (in red) against the backdrop of models used in IPCC AR4 (2007) for projection of sea ice up to the year 2100.

 |
| Note: The record low value for 2012 still has to be added on this image. Credit: NSIDC, Stroeve et al. |
The image shows that the recently observed decline in sea ice extent is steeper than the CMIP3 models with a “business as usual” SRESA1B greenhouse gas emissions scenario (blue line), as used by the IPCC in AR4.
It is also steeper than the more recent CMIP5 models using a RCP 4.5 scenario (pink line) that are proposed to be used by the IPCC in AR5.
RCP 4.5 is a scenario in which the global temperature rise would would soon exceed 2 degrees Celsius. Since the Arctic experiences accelerated warming, such a scenario would clearly be catastrophic. Looking at sea ice volume, rather than extent, would show this even more clearly.
Below, a NOAA animation showing sea ice decline in 2012 and a NASA animation showing the Arctic cyclone.
Above animation shows the 2012 time-series of ice extent using sea ice concentration data from the DMSP SSMI/S satellite sensor. The black area represents the daily average (median) sea ice extent over the 1979-2000 time period. Layered over top of that are the daily satellite measurements from January 1 to September 14, 2012. Published September 17, 2012 by NOAA Visualizations.
Below the NASA animation
Arctic Cyclone Breaks Up Sea Ice
As said in the NSIDC news release, Northern Hemisphere sea ice extent dropped to 3.41 million square kilometers (1.32 million square miles) on September 16, 2012. Between March 20, 2012, and September 16, 2012, 11.83 million square kilometers (4.57 million square miles) of ice was lost.
By comparison, this is more than the land and inland waters covered by the United States (or Canada, or China, for that matter). It is also more than the 9,826,630 square km (3,794,080 sq mi) covered by the United States when all its land, inland waters, the Great Lakes, coastal waters and territorial waters are included.
.svg.png) |
| United States |
3 comments:
In my really humble opinion, the August storm does not have much effect in longer perspective. The broken ice really melts faster, but its melting consumes still the same amount of heat, thus the water and air get even colder than before. And in August the sun is already too low to make the effect of open water noticeable. That is why now the sea gets frozen again may be faster than ever before nin September.
However, if we have a similar storm in May it will have much more dramatic cosequences
Rare Nadine Hurricane formed in the East North Atlantic and now slowly heading to Portugal is one of first consequences of melting North Pole. Harsh winters for Europe and frequent heavy storms (and hurricanes).
If history is ever recorded beyond maybe 150 yrs from now, geologic record will likely be named bliss, destroyer and greed. Three parts of Period of increase of mankind's impact when mankind began to tear down the forests and destroy the Sea and the air in precursor of climatic response of Earth's systems in runaway.
The great period of economic expansion and greed.
Justice. Where is the justice, the pilferer sees.
Religion, what value the trees, the little bees..
We rocked the boat and it is taking on water fast.
Some see what's happening and want to change outcome. So history can be studied by children.
Hope is in alteration of fundamental principles of business law.
The value of money, how it connects through its use and affects Earth's survival. God's smiles.
Post a Comment