November 11, 2012
Abstract
Methane is erupting as widespread torches and fountains in the Arctic ocean up to 1 km across and is exponentially increasing in concentration in the Arctic atmosphere (Shakova et al. 2008 and 2010; Light and Carana 2012; Light 2012). The Arctic atmospheric methane is mostly derived from Arctic subsea shelf and slope methane hydrates due to their destabilization by globally warmed Gulf Stream currents which enter the Arctic west of Svalbard and through the Barents Sea. In the North Atlantic, the surface of the Gulf Stream is heated in the summer and is marked by excessive evaporation due to the global warming effects of pollution clouds emanating from North America (Figure 5; IPCC Working Group 1. Fig. 10.12 Lavatus Prodeo, 2012).

The ice melt back curves from the oldest lower 5* year old ice to the youngest shallowest 2 and 1 year old ice are caused by the progressive increase in temperature of the Gulf Stream “Atlantic Waters” which are entering the Arctic beneath the ice and melting it from the bottom up. The heating of the Gulf Stream waters is directly linked to the global warming of the North Atlantic caused by green house gas pollution blowing east off North America.

A series of progressive extinction zones have been determined (after Parry et al. 2007) and include:-
- Bleaching of most corals when the atmospheric temperature anomaly is between 1 and 2°C
- Extreme droughts will extend over 1 - 30% of the land area when the atmospheric temperature anomaly exceeds 2°C which will make more than 1.8 billion people water stressed.
- Widespread coral mortality will occur when the mean atmospheric temperature anomaly is between 2.5°C and 3.5°C and will be associated with a massive increase in the ferocity of tropical cyclones/hurricanes far in excess of the Sandy super storm.
- Complete deglaciation and coastal inundation is expected when the mean atmospheric temperature anomaly increases from 4 to 8°C with a consequent sea level rise of some 68.3 metres (224 feet) above sea level. There will be major global extinction over this temperature interval as cereal production sharply decreases outside of the tropics.
The Alamo Project is a call for United States scientists and engineers to volunteer to develop a system of destroying the fast growing methane clouds in the atmosphere by radio/laser means or other processes before they destroy us. See this page:-
http://www.facebook.com/AlamoProject
Immediate and concerted action must be taken by governments and oil companies to depressurize the Arctic subsea methane reserves by extracting the methane, liquefying it and selling it as a green house gas energy source (see the ANGELS Project). See this post:-
http://arctic-news.blogspot.com/2012/06/angels-proposal.html
If greenhouse gas emissions are not sharply curtailed by 90% to 95% and the Arctic subsea and atmospheric methane extracted and destroyed, mean rising sea levels will breach the Thames Barrier by 2029 flooding London and the proposed Verrazano Narrows barrier in New York by 2030. The base of the Washington Monument (D.C.) will be inundated by 2031. By 2051, total global deglaciation will finally cause the sea level to rise up the lower 35% of the Washington Monument and humanity will have been eliminated by worldwide flooding and firestorms.
Introduction


This methane has almost half the density the cold dry polar air at STP (Engineering Toolbox, 2011) and rises like hydrogen into the stratosphere where it is accumulating as a world encompassing methane warming veil (methane in wet air may be transported horizontally by storm systems (Light, 2012).). In addition because methane has a global warming potential of close to 100 during the first 15 to 20 years of its life (Dessus et al. 2001) it will preferentially warm up and expand compared to the other atmospheric gases and thus drop even further in density making it much lighter than the cold polar air. This means that 1 ppmv of methane (1000 ppb methane) is equivalent to 100 ppmv carbon dioxide making its global warming effect far exceed that of carbon dioxide.
The rising light Arctic methane migration routes have been interpreted on a Hippo profile (from Wofsy et al. et al. 2009) using the inflexion points on the temperature and methane concentration profiles similar to the system used to identify deep oceanic current trends using salinity and temperature data (Tharp and Frankel, 1986). The light Arctic methane is rising almost vertically up into the stratosphere between 60° North and the North Pole where it is trapped below the hydrogen in the upper stratosphere against which it has an upper diffuse boundary as shown by the fall off in methane concentration between 40 km and 50 km altitude (Nassar et al. 2005). A further very important consequence of the light methane rising like hydrogen into the upper stratosphere where it forms a stable zone beneath the hydrogen between 30 km and 50 km height, is that this methane is never recorded in the mean global warming gas measurements made at Mauna Loa.
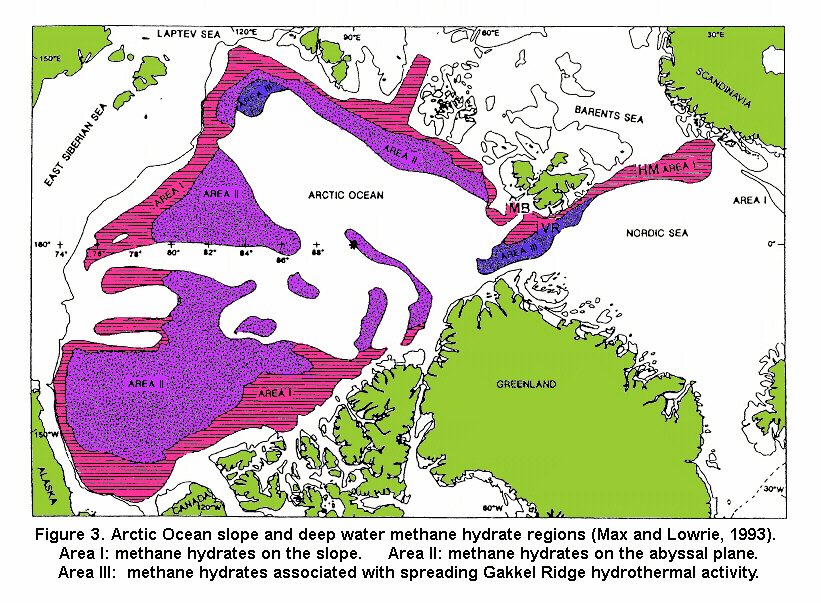


Some of the methane hydrate is associated with the spreading Gakkel Ridge hydrothermal activity and is being destabilized by earthquakes as indicated by high concentrations of major faults in the zones of maximum subsea eruptions (Figure 4a; Harrison et al. 2008). The zone of extreme methane emission shown on Figure 4a is represented by the anomalously high methane concentration peaks some exceeding 8 ppmv in the Laptev Sea and East Siberia Sea on Figure 4b (from Pravettoni, 2009) and show that subsea atmospheric methane emissions were already climbing here before 2005.
However the main methane hydrate destabilizing factor is the Arctic extension of the globally warmed Gulf Stream which splits and enters the Arctic region flowing beneath the drift ice west of Svalbard and through the Barents Sea. These two hot Gulf Stream currents converge on the slope region of the East Siberian Shelf (Coachman and Barnes, 1963; MIT 2012; Wales 2012; Shakova et al, 2008; 2010) causing widespread destabilization of the subsea methane hydrates and Arctic methane eruption into the atmosphere. This warm Gulf Stream water is now progressively destabilizing more and more of the methane hydrates releasing increasing amounts of methane into the already globally warmed Arctic atmosphere heating it further.


The recent super storm Sandy (Figure 7) in late October 2012 linked with an Arctic cold front and generated a massive tidal surge at New York in excess of 14 feet above mean sea level causing widespread deaths, devastation, fires and electric power black outs for millions of Americans. Super storm Sandy was formed by the convergence of Gulf Stream (atmospheric methane emission) globally heated Arctic air and a Gulf Stream generated tropical super storm - hurricane (Figure 7; Eoimages, 2012). NASA modelling shows that the methane being emitted in the Arctic is rising up into the stratosphere where it forms a continuous Methane Stratospheric Global Warming Veil. The methane concentration is at present densest in the equatorial and mid -latitudes where reaches concentrations of 1.8 ppmv, much higher than occurs at lower levels in the atmosphere and this stratospheric methane is progressively spreading northwards over the region where super storm Sandy ran aground onto the eastern coastline of the United States (Figure 8; NASA, 2012). The continuous Methane Stratospheric Global Warming Veil is causing extreme heating of the Earth's surface by trapping the suns heat below it and is further increasing the amount of heating and evaporation that is taking place over the Central Atlantic (Figure 8).

Data Sources
The massive 14 foot tidal surge (Scientific American 2012). caused by the Sandy super storm has been combined with the complete set of Arctic atmospheric global warming sea ice melt back and sea level rise data to produce a complete analysis of the likely trend of the global warming induced extinction events in the next 50 years.

The sharp increase in methane emissions at Svalbard north of Norway indicate that by the end of August 2010 the concentration of atmospheric methane sourced from the destabilization of subsea methane hydrates was growing at an increased and anomalous rate as was confirmed later by data from Barrow Point Alaska (Figure 9; NOAA 2011a; Carana 2012).
 In addition data from Piomass volume of Arctic melt back show that the Arctic Sea ice has shrunk at a much faster rate than predicted by IPCC modelling projections (Figure 10; Stroeve 2007; NSIDC, Naam 2012), enabling a date correction to be applied to the mean IPCC global atmospheric trend for the Arctic region (Light 2012).
Figure 11 shows an exponential regression of the Piomas yearly minimum ice volume data indicating that the start of complete melt back Arctic sea ice will begin in 2015 and it also gives the range of the exponential estimate (Zhang and Rothrock 2003; Wipneus 2012).

The exponential regression of some of the twelve Piomas monthly average Arctic ice volumes are shown on Figure 12 and have been used to determine monthly melt back times (Zhang and Rothrock, 2003; Wipneus 2012).

Figure 13 shows the 12 monthly average Arctic ice volume data with polynomial trends showing the start of Arctic ice cap melt back in 2016 and complete loss of the Arctic sea ice pack by 2032 (Neven 2012).

This point represents the mean start point of complete Arctic sea ice melt back because the convergence in the amplitude of the monthly Giss surface temperature anomalies is caused by the latent heat of melting and freezing of the surface Arctic ice which is progressively diminishing until it is finally gone by about 2015.757.
Figure 15 (clickon image to enlarge) is a summary diagram showing all the determined global warming temperature curves and the latest "Sandy" storm surge curve based on adding 14 feet to the mean latent heat of ice melting curve (Light 2012; Fichetti, 2012). All the global warming curves converge on a region between 2034 and 2052 where the atmospheric temperature anomaly will be greater than 8°C and all of the Earth's ice caps will have melted with a consequent sea level rise of 68.3 metres (224 feet) above mean sea level (Wales, 2012). In particular the accelerated global warming curve from Carana (2012) and the "Sandy" storm surge curve (data from Fichetti, 2012) converge on the mean atmospheric temperature extinction point derived from 20 estimates (Light 2012). This gives great confidence in the interpretation that we can expect catastrophic climate change from methane induced global warming between 2034 and 2052 unless humanity sharply cuts back (90 - 95 %) on global greenhouse gas emissions and converts all its energy resources to renewable energy/ nuclear power.

Figure 16 (click on image to enlarge) shows all the progressive extinction events caused by the rising atmospheric temperature due to global warming based on IPCC data (Parry et al. 2007). All the determined global warming temperature curves converge on a region between 2034 and 2052 where the mean atmospheric temperature anomaly will be greater then 8°C and all the worlds ice caps will have completely melted. The progressive extinction zones shown on this diagram from Parry et al. 2007 and include:-
- Bleaching of most corals when the atmospheric temperature anomaly is between 1 and 2°C
- Extreme droughts will extend over 1 - 30% of the land area when the atmospheric temperature anomaly exceeds 2°C which will make more than 1.8 billion people water stressed.
- Widespread coral mortality will occur when the mean atmospheric temperature anomaly is between 2.5°C and 3.5°C which will be associated with a massive increase in the ferocity of tropical cyclones/hurricanes far in excess of the Sandy super storm (Fichetti 2012).
- Complete deglaciation and coastal inundation will occur when the mean atmospheric temperature anomaly increases from 4 to 8 degrees C with a consequent sea level rise of some 68.3 metres (224 feet) above sea level. Major global extinction will occur over this temperature interval as cereal production sharply decreases outside of the tropics.
Arctic Sea Ice Melt Back Times
Arctic sea ice melt back times have been estimated from the area, volume and thickness of the Arctic sea ice and include Piomas yearly average Arctic sea volumes (Zhang and Rothrock, 2003, 2012), NSIDC yearly average Arctic ice areas (Tschudi and Maslanik, 2012) and mean Arctic shelf ice thickness (Kwok and Rothrock, 2008)(Figure 17; Table 1).


The lower part of Figure 17 defines the NSIDC area sea ice extent in millions of square kilometres and shows the progressive melt back of the 5+ year old, 4 year old, 3 year old and 2 year old sea ice by 2037. The ice melt back from the oldest lower 5* year old ice to the youngest shallowest 2 and 1 year old ice is caused by the progressive increase in temperature of the Gulf Stream “Atlantic Waters” which are entering the Arctic beneath the ice and melting it from the bottom up. The heating of the Gulf Stream waters is directly linked to the global warming of the North Atlantic caused by green house gas pollution blowing east off North America.
It also graphically shows the progressive opening and expansion of the dark (low albedo) Arctic ocean and the trend of the globally warmed Gulf Stream/Atlantic waters along the European - Russian shelf edge - slope where it is destabilizing the methane hydrates and releasing vast quantities of methane into the Arctic atmosphere before its cyclic return to the North Atlantic in the Arctic drift ice region.
Table 1 shows the Arctic sea ice melt back data from Piomass ice volume (Zang and Rothrock 2003, 2012), area (NSIDC , Tschudi and Maslanik 2012) and Giss surface maximum convergence data (NASA, Hansen 2012). Major Arctic methane emissions were observed at Svalbard at the end of August 2010 (Figure 9) but Pravettoni (2009) indicate that anomalous methane emissions into the Arctic atmosphere began before that time and had exceeded 8 ppmv and 6 ppmv in the area of the Laptev and East Siberia Seas before 2005 (Figure 4b) This methane concentration is equivalent to 600 to 800 ppmv of additional carbon dioxide added to the atmosphere at a methane global warming potential of 100 (Dessus et al. 2008). This shows that even before 2009, the atmospheric methane content in the Laptev sea had in places exceeded twice the global warming effect of the present mean global atmospheric concentration of carbon dioxide generating a relative temperature anomaly of more than 8°C.
The exponential increase in the rate of Arctic methane emissions will cause a continuous zone in the Arctic clear of sea ice after 2016 (Table 1). This low albedo open Arctic ocean will have no ice cover at all and will absorb large quantities of solar energy quickly heating the water up, further destabilizing the subsea shelf and slope methane hydrates and releasing large quantities of methane into the Arctic atmosphere and stratosphere where it will thicken and extend as an all encompassing global warming veil further aggravating the already serious global warming of the Earth's surface.
The oldest, 5+ year old Arctic sea ice will be completely melted by 2022 followed immediately by the 4 year old ice in 2023 and these times also represent the mean time for the complete melt back of all of the Arctic sea ice (Table 1). The 3 year old ice is expected to be completely melted by 2026 and the 2 year old ice completely gone by 2037 (Table 1). The 2037 melt back date for the 2 year old ice also corresponds with final date of the total melt back of all the Arctic sea ice (Piomas maximum ice volume exponential regression trend) while a linear extrapolation of the decline of Arctic sea ice mean thickness reaches zero around 2040 (data from Kwok and Rothrock, 2009). This implies that there will be complete melting and loss of the entire 2 year old and 1 year old Arctic ice by 2037 to 2040 (Table 1). The low albedo Arctic Ocean will now have no ice cover at all and will absorb large quantities of solar energy causing massive warming of the ocean waters and extreme destabilization of the subsea methane hydrates releasing large volumes of methane directly into the Arctic atmosphere. Exponential trends on the 1 year sea ice area data suggest that snow will finally cease to fall in the Arctic region between 2066 and 2067.
Sea Level Rise
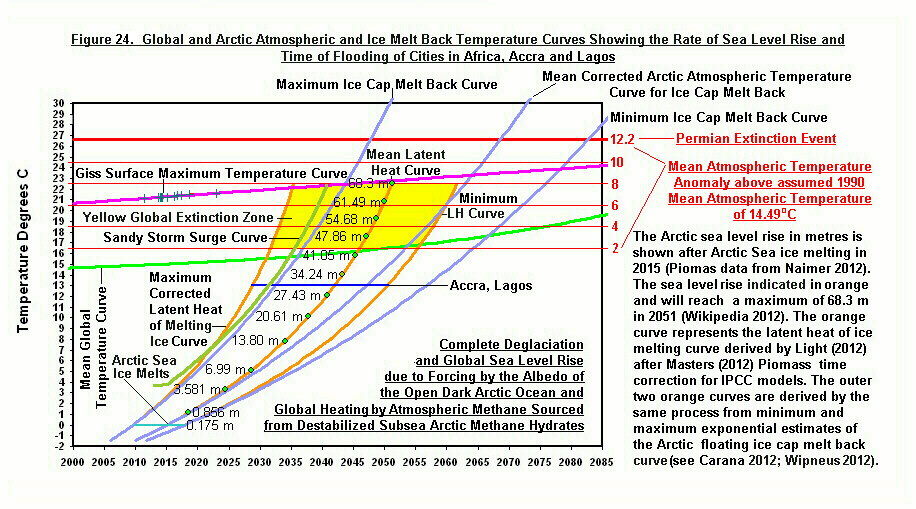
Global and Arctic Atmosphere and ice melt back temperature curves which show the rate of sea level rise and the time of flooding of world oceanic islands and coastal cities are shown on Figures 18 to 27 and Tables 1 and 2. These diagrams have a mean latent heat of ice cap melting curve for which the sea level rise has been calculated from 2015 and this reaches a maximum of 68.3 meters (224 feet) by 2051. In addition the minimum and maximum latent heat of ice melting curves have also been estimated from the range shown by the exponential regression trends on the Piomass ice volume curve in Figure 11.
A yellow global extinction zone is outlined vertically on the diagrams between an atmospheric temperature anomaly of 2°C and 8°C and the Giss surface maximum temperature curve defined from the monthly convergence data (Light, 2012). The yellow global extinction zone is bounded laterally by the maximum and minimum latent heat of Arctic ice melting curves.
A "Sandy" storm surge of 14 feet above sea level has been added to the mean Arctic sea level rise calculated from the mean latent heat of ice melting curve and used to calculate a "Sandy" storm surge curve. The relative altitude and time of flooding of particular islands and cities are shown by horizontal blue lines in Figures 18 to 27. The intersection of these blue lines with the mean latent heat of ice melting curve gives the mean time of flooding from sea level rise/sea barrier breaching under fair weather conditions. The intersection of the island/city altitude blue lines with the "Sandy" storm surge curve gives the time of flooding under extreme to catastrophic tropical storm/cyclone/hurricane conditions. Because the storm systems are going to increase in intensity as global warming accelerates, the estimated flooding time is a maximum future time and the flooding could occur even earlier depending on the ferocity of the storms.
The following list shows the regions dealt with in the diagrams 18 to 27 which graphically display the data in Table 2.
- Figure 18. World ocean islands - Tuvalu, Maldives, Kiribati and the Marshall islands.
- Figure 19. United States - Boston, San Francisco, Miami, Houston, New York and Washington.
- Figure 20. South America - Caribbean - Buenos Aires, Montevideo, Havana, Nassau.
- Figure 21. W. Europe - London, Dublin and Berlin
- Figure 22. Netherlands - Flood Barrier Breaching
- Figure 23. Europe - Scandinavia - Iceland - Mose Venice, Emms Germany, Helsinki, Copenhagen, Reykjavik and Stockholm.
- Figure 24. Africa - Accra, Lagos.
- Figure 25. Middle East - Abu Dabai, Kuwait City, Doha Qatar, Manama Bahrain, Cairo, Tel Aviv and Tunis.
- Figure 26. India - Australia - Bangladesh, Karachi, Colombo, Sydney, Darwin and Wellington.
- Figure 27. Far East - Shanghai, Singapore, Bangkok, Tokyo, Jakarta, Hong Kong, Beijing, Seoul and Taipei.

Rising sea levels will breach the Thames Barrier by 2029 flooding London and the proposed Verrazano Narrows barrier in New York by 2030.
The base of the Washington Monument (D.C.) will be inundated by 2031. Total global deglaciation will cause the sea level to rise up the lower 35% of the Washington Monument by 2051 (68.3 m or 224 feet above present sea level).
Because of the massive increase in the strength of the storm systems and waves, high rise buildings in many of the coastal city centers will suffer irreparable damage and collapse so that the core zones of the cities will be represented by a massive pile of wave pulverised debris. Unfortunately by that time a large portion of sea life will be extinct and the city debris fields will not form a haven for coral reefs.
The seas will probably still be occupied by the long lasting giant jellyfish (such as are now fished off Japan), rays and sharks (living respectively since 670, 415 and 380 million years ago) and the sea floor by coeolocanths (living since 400 million years ago)(Calder, 1984).
The city rubble zones will probably be occupied by predatory fish (living since 425 million years ago)(Calder 1984). Life will also continue in the vicinity of oceanic black smokers so long as the oceans remain below boiling point.


When the Arctic ice cap melts towards the end of 2015, there will be a massive increase in the amount of heat being absorbed by the Arctic ocean from the sun and the Gulf Stream which presently feeds the Arctic with Atlantic water along the west side of Svalbard and through the Barents Sea. Normally, the Gulf Stream is cooled when it hits the floating ice pack and this will cease to happen bringing even vaster amounts of Atlantic heat via the Gulf Stream into the Arctic. Consequently, the Arctic subsea methane hydrates will destabilize at an even faster rate, because of the increasing Arctic Ocean temperature, pouring methane into the Arctic atmosphere and stratosphere.
The extreme weather events in the United States this year which included record heating and drought conditions, massive loss of food crops with farmers going bankrupt, more hurricane flooding in New Orleans and tornadoes and the Super storm Sandy in New York are just a small sample of what will come in the next four or five summers as the Arctic ice finally melts. The Arctic ice cap works like the Earth's air conditioner because of the latent heat of melting and freezing of the floating ice and its moderating effect on atmospheric temperatures.
The extensive stratospheric methane warming veil that is spreading over the United States is undoubtedly the reason for the extreme weather events and very high temperatures. The livelihoods of all the American people are going to be totally compromised in the next few years, unless we develop a system of destroying the atmospheric methane that is erupting in the Arctic from the destabilization of submarine methane hydrates and the methane that is accumulating as a global warming veil in the stratosphere.
We need to act.
We are facing impossible odds with regard to the Arctic ocean methane release and in the same way that Colonel Travis drew a line at the Alamo to ask for volunteers to help him defend the mission against Santa Ana's massive Mexican army, I am drawing a virtual line through the snow on the top of the Arctic ice pack to ask for volunteers to defend the American people from the fast-gathering Arctic methane global firestorm.
We desperately need dedicated scientists and engineers to volunteer to develop an effective 'action at a distance' method of destroying the Arctic oceanic methane clouds as they are erupting from the sea surface and entering the stratosphere and mesosphere. This could be done using a 13.56 MHz methane destruction radio frequency which has been used in the laboratory to convert methane to nano diamonds, methane molecule vibrational frequency lasers or other geoengineering methods. If the United States can land giant rovers on the mars with a skycrane, surely American engineers and scientists are up to this challenge. We need to get rid of as much of this atmospheric methane as we can, to drop the polar temperatures to reasonable levels. This will of course have to go hand in hand with a massive cut back in carbon dioxide emissions from all developed and developing countries.
To receive updates or post comments and suggestions, join the Alamo Project email group at:
http://groups.google.com/group/alamo-project/subscribe
or visit the page at:
http://www.facebook.com/AlamoProject
ANGELS Project
If left alone the subsea Arctic methane hydrates will explosively destabilize on their own due to global warming and produce a massive Arctic wide methane “blowout” that will lead to humanity’s total extinction, probably before the middle of this century (Light 2012 a, b and c). AIRS atmospheric methane concentration data between 2008 and 2012 (Yurganov 2012) show that the Arctic has already entered the early stages of a subsea methane “blowout” so we need to step in as soon as we can (e.g. 2015) to prevent it escalating any further (Light 2012c).
The Arctic Natural Gas Extraction, Liquefaction & Sales (ANGELS) Proposal aims to reduce the threat of large, abrupt releases of methane in the Arctic, by extracting methane from Arctic methane hydrates prone to destabilization (Light, 2012c).
After the Arctic sea ice has gone (probably around 2015) we propose that a large consortium of oil and gas companies/governments set up drilling platforms near the regions of maximum subsea methane emissions and drill a whole series of shallow directional production drill holes into the subsea sub permafrost “free methane” reservoir in order to depressurize it in a controlled manner (Light 2012c). This methane will be produced to the surface, liquefied, stored and transported on LNG tankers as a “green energy” source to all nations, totally replacing oil and coal as the major energy source (Light 2012c). The subsea methane reserves are so large that they can supply the entire earth’s energy needs for several hundreds of years (Light 2012c). By sufficiently depressurizing the Arctic subsea sub permafrost methane it will be possible to draw down Arctic ocean water through the old eruption sites and fracture systems and destabilize the methane hydrates in a controlled way thus shutting down the entire Arctic subsea methane blowout (Light 2012c).
See this post:-
http://arctic-news.blogspot.com./2012/06/angels-proposal.html
Acknowledgements
Many thanks to Harold Hensel for finding additional data on the extreme methane emission points in the Arctic which confirmed the mapping procedures used in previous analyses of the Arctic region. My grateful thanks also go to Sam Carana for his stirling editing work on my many global warming articles in the Arctic News.
References
Allen, P.A., and Allen, J.R. 1990. Basin Analysis, Principles and Applications. Blackwell, Oxford, 451 pp.
Anitei S. 2007. How is the Ozone layer menaced? The Daily Climate. www. Daily Climate.org.
http://news.softpedia.com/news/How-is-the-Ozone-Layer-Menaced-53762.shtml
ARCTIC METHANE EMERGENCY GROUP
http://ameg.me
Box J. and Decker D. 2012. Greenland Ice Sheet Reflectivity , July 2000 – 2011, 2012 days 1 – 23. NASA MOD1OA1 data processed by Jason Bird and David Decker. Byrd Polar Research Centre. Projection in red added by Sam Carana, 2012.
Calder, N. 1984. Timescale - An Atlas of the Fourth Dimension. Chatto and Windus, London, 288 pp.
Carana, S. 2011a. Runaway Warming 2011. Geo-engineering blog
http://geo-engineering.blogspot.com/2011/09/runaway-warming.html
Carana, S. 2011b. Runaway global warming 2011. Geo-engineering blog
http://geo-engineering.blogspot.com/2011/04/runaway-global-warming.html
Carana, S. 2011g. Runaway Global Warming. In: Climate Change the Next Generation.
http://climatechangepsychology.blogspot.com/2011/04/sam-carana-runaway-global-warming.html
Carana, S. 2012. Striking increase of methane in the Arctic. In: Arctic News
http://arctic-news.blogspot.com/2012/05/striking-increase-of-methane-in-arctic.html
Carana S., 2012. Record levels of greenhouse gases in the Arctic. Arctic News. Wednesday, May 2, 2012.
http://arctic-news.blogspot.com/2012/05/record-levels-of-greenhouse-gases-in.html
Carana, S. 2011b. Light, M.P.R. and Carana, S. 2011c. Methane linked to seismic activity in the Arctic.
http://arctic-news.blogspot.com/p/seismic-activity.html
Chao, B.F., Yu, Y.H., Li, Y.S., 2008. Impact of Artificial Reservoir Water Impoundment on Global Sea Level. Science, v. 320, p. 212 – 214.
http://www.skepticalscience.com/sea-level-rise.htm
Church J.A., White N.J., Thorkild A., Wilson W.S., Woodworth, P.L. Domingues C.M., Hunter J.R., Lambeck K., 2008. Understanding global sea levels: past, present and future. Special Feature. Original Article. Sustain Sci. V.3, pp. 9 - 22.
http://academics.eckerd.edu/instructor/hastindw/MS1410_001_FA08/handouts/2008SLRSustain.pdf
Dessus, B., and Laponche B., Herve le Treut, 2008. Global Warming: The Significance of Methane bd-bl-hlt January 2008.
http://www.global-chance.org/IMG/pdf/CH4march2008.pdf
Ehret G. 2010. Merlin: French – German Climate Satellite to be launched in 2014. Lidar Department, Institute of Atmospheric Physics, Deutches Zentrum für Luft – und Raumfahrt (DLR)
http://www.dlr.ge/pa/en/desktopdefault.aspx/tabid-2342/6725_read-26662/
Engineering Toolbox, 2011. Gases – Specific Gravities.
http://www.engineeringtoolbox.com/specific-gravities-gases-d_334.html
Hargraves, 2012. Altitudes of World Cities. Hargraves Advanced Fluidic Solutions. http://www.hargravesfluidics.com
Heicklen, J. 1976. Atmospheric Chemistry. Academic Press, New York, 406 pp.
Hillen, M.H., Jonkman, S.N., Kanning, W., Kok, M., Geldenhuys M., Vrijling J.K. and Stive, M.J.F., 2010.
Coastal Defence Cost Estimates Case Study of the Netherlands, New Orleans and Vietnam. The Netherlands, TU Delft. Available from: http:/tiny.cc/wikh
IPCC Fourth Assessment Report on Climate Change 2007 - temperature rise projections
http://ipcc.ch/publications_and_data/ar4/wg1/en/spmsspm-projections-of.html
Intergovernmental Panel on Climate Change (IPCC) 1992a. Climate Change. The IPCC Scientific Assessment (Edited by J. J. Houghton, G. J. Jenkins and J. J. Ephraums). Cambridge University Press, Cambridge. U.K.
Intergovernmental Panel on Climate Change (IPCC) 1992b. Climate Change in 1992. The Supplementary report to the IPCC Scientific Assessment (Edited by J. J. Houghton, B. A. Callander and S. K. Varney). Cambridge University Press, Cambridge. U.K.
Intergovernmental Panel on Climate Change (IPCC) 2007a. Fourth Assessment Report on Climate Change 2007. FAO 3.1, Figure 1, WG1, Chapter 3, p. 253.
http://blogs.ei.colombia.edu/wp-content/uploads/2010/12/graph-2-600X422.jpg
Intergovernmental Panel on Climate Change (IPCC) 2007b. Synthesis Report
http://www.ipcc.ch/publications_and_data/ar4/syr/en/spms1.html
Lide. D.R. and Frederikse H.P.R., 1995. CRC Handbook of Chemistry and Physics. 75th Edition, CRC Press, London. pp. 1-1 - 1-33.
Light M.P.R. 2011a. Use of beamed interfering radio frequency transmissions to decompose Arctic atmospheric methane clouds. Edited by Sam Carana.
http://arctic-news.blogspot.com/p/decomposing-atmospheric-methane.html
Light M.P.R. 2011c. Stratospheric methane global warming veil. Edited by Sam Carana. In: Arctic News. http://arctic-news.blogspot.com/p/stratospheric-methane-global-warming.html
Light M.P.R., 2012a. Global exctinction within one human lifetime as a result of a spreading atmospheric methane heatwave and surface firestorm. Edited by Sam Carana. In Arctic News.
http://arctic-news.blogspot.com/p/global-extinction-within-one-human.html
Light M.P.R., 2012b. How much time is there left to act, before methane hydrate releases will lead to human extinction? Edited by Sam Carana. In: Geo-Engineering.
http://geo-engineering.blogspot.com/2012/02/how-much-time-is-there-left-to-act.html
Light M.P.R. 2012c. Angels Proposal - A Proposal for the Prevention of Arctic Methane Induced Catastrophic Global Climate Change by Extraction of Methane from beneath the Permafrost/Arctic Methane Hydrates and its Storage and Sale as a Subsidized "Green Gas" Energy Source. LGS. 49 pp. In: Arctic News.
http://arctic-news.blogspot.com/2012/05/proposal-to-extract-store-and-sell.html
Light M.P.R. and Carana, S., 2011. Methane linked to seismic activity in the Arctic. Edited by Sam Carana. In: Arctic News.
http://arctic-news.blogspot.com/p/seismic-activity.html
Light M.P.R. and Solana C., 2002a. Arctic methane hydrates - Mapping a potential greenhouse gas hazard. Abstract and Poster, EGS, Nice. - Appendix at:
http://arctic-news.blogspot.com/p/seismic-activity.html
Light, M.P.R. and Solana, C. , 2002b- Arctic Methane Hydrates: A Potential Greenhouse Gas Hazard
http://adsabs.harvard.edu/abs/2002EGSGA..27.4077L
Lopatin, N.V. 1971. Temperature and geologic time as factors in coalification (in Russian). Akad. Nauk SSSR. Izvestiya. Seriya Geologicheskaya, 3, pp.95 - 106.
Masters. J. 2009. Top Climate Story of 2008. Arctic Sea Ice Loss. Dr Jeff Masters Wunderblog.
http://www.wunderground.com/blog/JeffMasters/comment.html?entrynum=1177
Nassar R., Bernath P.F., Boone C.D., Manney G.L., McLeod S.D., Rinsland C.P., Skelton R., Walker K.A., 2005. Stratospheric abundances of water and methane based on ACE-FTS measurements. Geophysical Research Letters, Vol. 32, LI5504, 5 pp.
http://www.atmosp.physics.utoronto.ca/~rnassar/Publications_pdfs/Nassar_water_methane_2005GL022383.pdf
NASA global temperature data
http://data.giss.nasa.gov/gistemp/tabledata_v3/GLB.Ts.txt
Naumer T. 2012. Triggering permafrost meltdown is closer than we think.
http://climatechangepsychology.blogspot.com/2012/04/triggering-permafrost-meltdown-is.html
Neven, 2011. Arctic Sea Ice Blog. Interesting News and Data;
http://neven1.typepad.com/blog/2011/09/piomas-august-2011.html
NOAA 2011a. Huge sudden atmospheric methane spike Arctic Svalbard (north of - Norway)
http://arctic-news.blogspot.com/p/need-for-geo-engineering.html
NOAA 2011b. Huge sudden methane spike recorded at Barrow (BRW), Alaska, United States. Generated ESRL/GMO – 2011. December 14-17-21 pm
http://arctic-news.blogspot.com/p/need-for-geo-engineering.html
NSIDC, 2011a. The Polar Vortex. National Snow and Ice Data Center.
http://nsidc.org/arcticmet/patterns/polar_vortex.html
Olivier C.P. 1942. Long Enduring Meteor Trains. Proc. Amer. Phil. Soc. 35, 93.
Olivier C.P. 1948. Long Enduring Meteor Trains. Proc. Amer. Phil. Soc. 91, 315 (Second paper).
Parry, M.L., Canziani, O.F., Palutikof, J.P. and Co-authors, 2007. Impacts, Adaption and Vulnerability. Contribution of Working Group II to the Fourth Assessment Report of the Intergovernmental Panel on Climate Change. M.L. Parry, O.F. Canziani, J.P. Palutikof, P.J. van der Linden and C.E. Hanson, Eds. Cambridge University Press, Cambridge, UK, pp. 23 – 78.
Pravettoni R. 2009. WWF Arctic Feedbacks Report. UNEP.GRID Arendal.
http://www.grida.no/graphicslib/detail/annual-temperatures-increases-for-2001-2005-relative-to-1951-1980-6beo
Science Daily, 2011. Record Depletion of Arctic Ozone Layer Causing Increased UV Radiation in Scandinavia.
http://www.sciencedaily.com/releases/2011/04/110405102202.htm
Scientific American, 2012. Hurricane Sandy: An Unprecidented Disaster.
http://www.scientificamerican.com/report.cfm?id=hurricane-sandy-2012
Semiletov, I. 2011. Quoted from Itar-Tass. Heavy methane emissions found in the Arctic Eastern Sector. Itar-Tass. September 26, 2011.
http://www.itar-tass.com/en/c154/233799.html
Shakova N., Semiletov, I., Salyuk, A., and Kosmach, D., 2008. Anomalies of methane in the atmosphere over the East Siberian Shelf. Is there any sign of methane leakage from shallow shelf hydrates? EGU General Assembly 2008. Geophysical Research Abstracts, 10, EGU2008-A-01526
http://www.cosis.net/abstracts/EGU2008/01526/EGU2008-A-01526.pdf
Shakova, N. and Semiletov, I., 2010a. Methane release from the East Siberian Shelf and the potential for abrupt climate change. Presentation in November 30, 2010.
http://symposium2010.serdp-estcp.org/Technical-Sessions/1A
Shakova N., Semiletov, I., Leifer, I., Salyuk, A., Rekant, P., and Kosmach, D. 2010b. Geochemical and geophysical evidence of methane release over the East Siberian Arctic Shelf. Journal Geophys. Research 115, C08007
http://europa.agu.org/?view=article&uri=/journals/jc/jc1008/2009jcoo5602/2009jc005602.xml
Shakova, N., Semiletov, I., Salyuk, A., Yusupov, V., Kosmach, D., and Gustafsson, O., 2010c. Extensive methane venting to the atmosphere from sediments of the East Siberian Arctic Shelf. Science.
http://www.sciencemag.org/content/327/5970/1246.short
Stroeve, J.E., Serreze, M.C., Holland, M.M., Kay, J.E., Malanik, J., and Barret, 2012. The Arctic's rapidly shrinking sea ice cover: a research synthesis. Clim. Change. 110, (4.- Mar), p. 1005 - 1027.
http://link.springer.com/article/10.1007%2Fs10584-011-0101-1
Tharp. M., and Frankel, H., 1986. In: Natural History, October 1986. North American Museum of Natural History, p. 1 – 6.
Tschudi, M.A., Stroeve, D.K., Perovich, D.K., and Maslanik, J.A., 2012. Arctic Sea Ice Melt Pond Coverage Derived from Modis and from High Resolution Satellite Imagery. Remote Sensing of the Environment. NSIDC.
http://cires.colorado.edu/websites/nsidc/Publications/publications.php?id=366
Wofsy, S.C. et al. 2009. (image: HIPPO-1 flight along the date line, January 2009) HIAPER Pole-to-Pole Observations (HIPPO): fine-grained, global-scale measurements of climatically important atmospheric gases and aerosols Phil. Trans. R. Soc. A (2011) 369, 2073–2086 doi:10.1098/rsta.2010.0313
http://rsta.royalsocietypublishing.org/content/369/1943/2073.full.html
Wales J. 2012. Wikipedia
Carbon Dioxide.
http://en.wikipedia.org/wiki/Carbon_dioxide
Climate of the Arctic.
http://en.wikipedia.org/wiki/Climate_of_the_arctic
Density of Air.
http://en.wikipedia.org/wiki/Density-of-air
Methane.
http://en.wikipedia.org/wiki/Methane
Natural Gas.
http:/en.wikipedia.org/wiki/Natural_gas
Enthalpy of Fusion.
http://en.wikipedia.org/wiki/Enthalpy_of_fusion
Jason-1.
http://en.wikipedia.org/wiki/jason-1
Current Sea Level Rise.
http://en.wikipedia.org/wiki/Current _sea_level_rise
Yurganov, L., 2012a. Atmospheric Infrared Sounder (AIRS) data from NASA's Aqua Satellite. Index of/pub/yurganov/methane/MAPS/
ftp://asl.umbc.edu/yurganov/methane/MAPS/
Yurganov, L., 2012b. Atmospheric Infrared Sounder (AIRS) data from NASA's Aqua Satellite.
ftp://asl.umbc.edu/pub/yurganov/methane/AIRS_CH4%20_2002-2012.jpg
Zhang J. and Rothrock D.A. 2012. Arctic Sea Ice Volume Anomaly, Version 2. Polar Science Center, Applied Physics Laboratory, University of Washington.
http://psc.apl.washington.edu./wordpress/research/projects/arctic-sea-ice-volume-anomaly/
Zhang J. and Rothrock D.A. 2003.. Modelling global sea ice with a thickness and enthalpy distribution model in generalized curvilinear co-ordinates.
Mon.Wea.Rev., 131(5), 681 - 697.
2 comments:
This is a huge amount of information assembled extremely well. You could write two books Sam.
Here is comment I posted on Google+ about public perception, they won't mind cross post I'm pretty sure.
"Some may be put off by the conclusion sea level will rise most likely 224ft or 68.3m by 2051 and conclude to dismiss convergent analysis.
But to the layman and others who don't pay attention -acceleration;
Logarithmic progression of cascade of complicating factors applies."
Here are notes made this morning before I went to write stuff on line, to try to focus..
Test: pen works - Earth + humanity are in test
the test of time and importance
Now in any good test of College
Too much info/spurious info
one missing item/multiple variables
--------
Water is key latent heat + capacity
Vol time/buffer effect
Variability of outside factors
-------
Need Allies Need Peace
Every Word in order too.
end quote but had to look up spelling of spurious and variability..
The point I'm trying to make is every word we use today is needed..
Directed in a way to have peace and calm and so full force - applies to what we do now in an effort to head off Runway global warming from going full on..
Abrupt Climate Change is happening now, this above accelerated global warming
The slide to point where sudden volley of CH4 release is likely complete and yet even now as COP18 Doha takes place the world is tone deaf to situation..
Yet we leave use of fossil carbon on an acceleration even as we are agent of our own destruction and that of Earth's life system which made weak Heaven..
New comments are not allowed.