The July 2020 ocean temperature anomaly on the Northern Hemisphere was 1.11°C or 2°F above the 20th century average, the highest July anomaly on record. The yellow circles onthe image below are July data and red circles are data for other months.
The July 2020 ocean temperature anomaly on the Northern Hemisphere was well above the latent heat tipping point of 1°C above the 20th century average, threatening to soon reach the methane hydrates tipping point of 1.35°C above the 20th century average.

These are only two of ten tipping points that are hitting the Arctic, as described in a earlier post, while additionally there are further tipping points that do not specifically hinge on what happens in the Arctic, e.g. the ozone layer is very vulnerable, as described in an earlier post.
The latent heat tipping point
An earlier analysis indicates that the latent heat tipping point gets crossed when ocean temperature anomalies on the Northern Hemisphere get higher than 1°C above the 20th century average. As above image indicates, the tipping point did get crossed temporarily on several occasions in recent years, but this year it looks to have been crossed irreversibly, as indicated by the trend.
 |
| [ Record low volume? ] |
In other words, the sea ice has virtually lost its capacity to act as a buffer to consume further heat entering the Arctic Ocean.
Once the latent heat tipping point is crossed, further incoming heat will have to get absorbed by the Arctic Ocean, instead of getting consumed by the melting of sea ice, as was previously the case.
As long as there is sea ice in the water, this sea ice will keep absorbing heat as it melts, so the temperature will not rise at the sea surface and remain at zero°C. The amount of energy that is consumed in the process of melting the ice is as much as it takes to heat an equivalent mass of water from zero°C to 80°C.

Ocean Heat
Meanwhile, global heating continues and more than 90% of global heating is going into oceans.

Arctic sea ice is getting very thin and, at this time of year, it is melting rapidly, due to heat entering the Arctic Ocean from above, from the Atlantic Ocean and the Pacific Ocean, and from rivers that end in the Arctic Ocean.
The two images below shows the difference in sea surface temperatures of the Arctic Ocean, between August 4, 2020, 12 GMT and a forecast for August 22, 2020, 12 GMT. The important difference between the two images is the shrinking of the pale blue area in the Arctic Ocean, where the sea surface temperature is below 0°C, and the increase in areas with other tints of blue where the sea surface temperature is above 0°C.

The image below, from a recent post, shows ocean surface temperatures on August 10, 2020, with very high anomalies showing up where the sea ice has disappeared. The image also shows that the Arctic Ocean in many places is very shallow (right panel).
 |
| [ from earlier post ] |
The dramatic decline of the sea ice becomes more clear when looking at Arctic sea ice volume. The image below, by Nico Sun, shows volume up to August 31, 2020.

The dramatic decline of the sea ice is even more evident when looking at Arctic sea ice thickness. The image below, by Nico Sun, shows thickness up to August 31, 2020.

Below is a Universität Bremen image showing Arctic sea ice thickness on August 29, 2020.


As long as the air temperature remains above the freshwater freezing point, the sea ice will keep melting from above, on top of the melting that occurs from below as a result of ocean heat entering the Arctic Ocean from the Atlantic Ocean and the Pacific Ocean.


River water flowing into the Arctic Ocean also contributes to rising temperatures of the water of the Arctic Ocean.
 Furthermore, there are numerous feedbacks, e.g. when black carbon from forest fires settles on sea ice, this causes albedo changes in a self-reinforcing feedback loop, i.e. as less sunlicht gets reflected back up into the sky, more sunlight will be absorbed by the sea ice, speeding up its decline.
As confirmed by a recent study, dramatic abrupt climate change is taking place in the Arctic, and another dangerous feedback of the rising heat is stronger storms, as also discussed in an earlier post.

Stronger storms can bring more moisture into the Arctic. Above image shows a forecast for August 29, 2020, 1200Z, with two cyclones hitting the Arctic Ocean and with 100% relative humidity at the North Pole, at 1000 hPa.

Above image shows a cyclone, forecast for August 25, 2020, with wind north of Greenland as fast as 67 km/h or 41 mph.

 Above image shows that rain is forecast to fall over the North Pole on August 26, 202, 12Z.
The image on the right is a forecast for August 26, 2020, 21Z. The image shows strong wind over the North Atlantic, while another cyclone is showing up north of Greenland.
Sea ice is very thin at the moment, so it is vulnerable to get broken up into small small pieces, thus speeding up its melting, as warm water can more easily reach the broken-up pieces from all sides.
 Such storms can batter the sea ice, and they can come with rain, further devastating the sea ice by speeding up melting and creating melt-pools on top of the ice with a low albedo.
The image on the right shows a forecast for August 29, 2020. Rain is showing up north of Greenland, as another cyclone is forecast to hit the area. The cyclone is forecast to have strong winds spinning counter-clockwise, thus threatening to speed up the drift of the sea ice north of Greenland toward Fram Strait.
A sequence of cyclones could in a short time push much of the thickest of the remaining sea ice out of the Arctic Ocean through Fram Strait.
The methane hydrates tipping point
As discussed in earlier posts such as this one, the rising temperature of the Arctic Ocean threatens to destabilize methane hydrates contained in sediments at the seafloor of the Arctic Ocean.
As the top image shows, the methane hydrates tipping point could be crossed soon, as the Arctic Ocean is heating up dramatically, which is in part the result of the latent heat tipping point getting crossed, which makes that the temperature of the Arctic Ocean can rise very rapidly.
The methane hydrates tipping point threatens to get crossed as ocean temperature anomalies on the Northern Hemisphere become higher than 1.35°C above the 20th century average, which threatens to occur early next year.
Because the Arctic Ocean in many places is very shallow, heat can quickly reach sediments at the seafloor, which threatens to destabilize methane hydrates. The water of the Arctic Ocean is particularly shallow over the East Siberian Arctic Shelf (ESAS), making that the water there can warm up very quickly during summer heat peaks with heat reaching the seafloor and penetrating cracks in frozen sediments at the seafloor, which can lead to abrupt destabilization of methane hydrates contained in these sediments.
As discussed in an earlier post, the loss of subsurface sea ice is only one of ten tipping points hitting the Arctic. As the temperature of the oceans keeps rising, more heat will reach sediments at the seafloor of the Arctic Ocean that contain vast amounts of methane, as discussed in this page and this post.

Large abrupt methane releases in one spot will quickly deplete the oxygen in shallow waters, making it harder for microbes to break down the methane there, while methane that is rising through waters that are only shallow will also be able to enter the atmosphere very quickly, leaving little time for microbes to break down the methane.
 As illustrated by the 2012 image on the right, a large abrupt release of methane from hydrates in the Arctic can have more warming impact than all carbon dioxide emitted by burning of fossil fuel in a year. This is due to the high global warming potential (GWP) of methane following its release.
As this heating is concentrated in the Arctic, it will contribute to further methane releases from hydrates in the Arctic, in another self-reinforcing feedback loop.
The situation is extremely dangerous, given the vast amounts of methane present in sediments in the ESAS and given that there is very little hydroxyl in the air over the Arctic to break down the methane.
Ominously, the MetOp-1 satellite recorded a peak methane level of 2945 parts per billion (ppb), at 586 mb on the afternoon of August 18, 2020.

Two days later, the MetOp-1 satellite recorded a peak methane level of 2778 ppb, at 469 mb on the afternoon of August 20, 2020, while mean methane levels reached 1907 ppb.

That afternoon, on August 20, 2020, the MetOp-1 satellite recorded an even higher methane level, of 1923 ppb, at 293 mb, i.e. higher up in the atmosphere.

The danger is further illustrated by the image below, posted in February 2019 and showing a potential rise of 18°C or 32.4°F from 1750 by the year 2026.

Indeed, a rise of 18°C could eventuate by 2026, as illustrated by the image below and as discussed in an earlier post.

The situation is dire and calls for immediate, comprehensive and effective action, as described in the Climate Plan.
Links
• NOAA Global Climate Report - July 2020
https://www.ncdc.noaa.gov/sotc/global/202007
• Danish Meteorological Institute - 5 Day Ocean Forecast - Universal (Greenwich) Time
http://ocean.dmi.dk/anim/index.uk.php
• Danish Meteorological Institute - sea ice thickness and volume
http://polarportal.dk/en/sea-ice-and-icebergs/sea-ice-thickness-and-volume
• Danish Meteorological Institute - Arctic temperature
http://ocean.dmi.dk/arctic/meant80n.uk.php
• Danish Meteorological Institute - Arctic sea ice extent
http://ocean.dmi.dk/arctic/icecover.uk.php
• NOAA ocean heat content
https://www.nodc.noaa.gov/OC5/3M_HEAT_CONTENT/index.html
• MetOp satellite - methane
https://www.ospo.noaa.gov/Products/atmosphere/soundings/iasi
• Arctic sea ice - thickness - navy.mil
https://www7320.nrlssc.navy.mil/GLBhycomcice1-12/arctic.html
• Arctic sea ice - thickness - Universität Bremen
https://seaice.uni-bremen.de/databrowser
• Climate reanalyzer - precipitation, wind and pressure forecasts
https://climatereanalyzer.org/wx/fcst/?mdl_id=gfs&dm_id=world-ced&wm_id=prcp-mslp-gph500
• New release: Arctic warming satisfies criteria for abrupt climate change https://www.bjerknes.uib.no/en/article/news/arctic-warming-satisfies-criteria-abrupt-climate-change
• Past perspectives on the present era of abrupt Arctic climate change - by Eystein Jansen et al. https://www.nature.com/articles/s41558-020-0860-7
• Copernicus Atmosphere Monitoring Service
https://atmosphere.copernicus.eu/charts/cams
• Arctic sea ice extent - NSIDC
http://nsidc.org/arcticseaicenews/charctic-interactive-sea-ice-graph
• Arctic sea ice extent - Vishop, Arctic Data archive System, National Institute of Polar Research, Japan
https://ads.nipr.ac.jp/vishop/#/extent

The navy.mil animation below was run on September 15, 2020, and shows Arctic sea ice thickness over 30 days (last 8 frames are forecasts for September 16 - September 23, 2020).

The image below shows a forecast for September 15, run September 14, 2020.

The image below shows that, on August 30, 2020, the mean air temperature in the Arctic (80°N to 90°N) was still above the freshwater freezing point (0°C or 32°F or 273.15°K), well above the mean temperature for 1958-2002 and also above the year 2012 which had exceptionally high temperatures in September.

As long as the air temperature remains above the freshwater freezing point, the sea ice will keep melting from above, on top of the melting that occurs from below as a result of ocean heat entering the Arctic Ocean from the Atlantic Ocean and the Pacific Ocean.

Above ads.nipr.ac.jp image shows sea ice in 2020 (red line) still shrinking in extent. Arctic sea ice on September 13, 2020, was 3.55 million km², i.e. well below extent for that date in any other year except for 2012, when extent was as low as 3.18 million km² (on September 15 and 16, 2012).
According to NSIDC, sea ice extent on September 15, 2020, was 3.737 million km², while extent on September 17, 2012, was 3.387 million km².
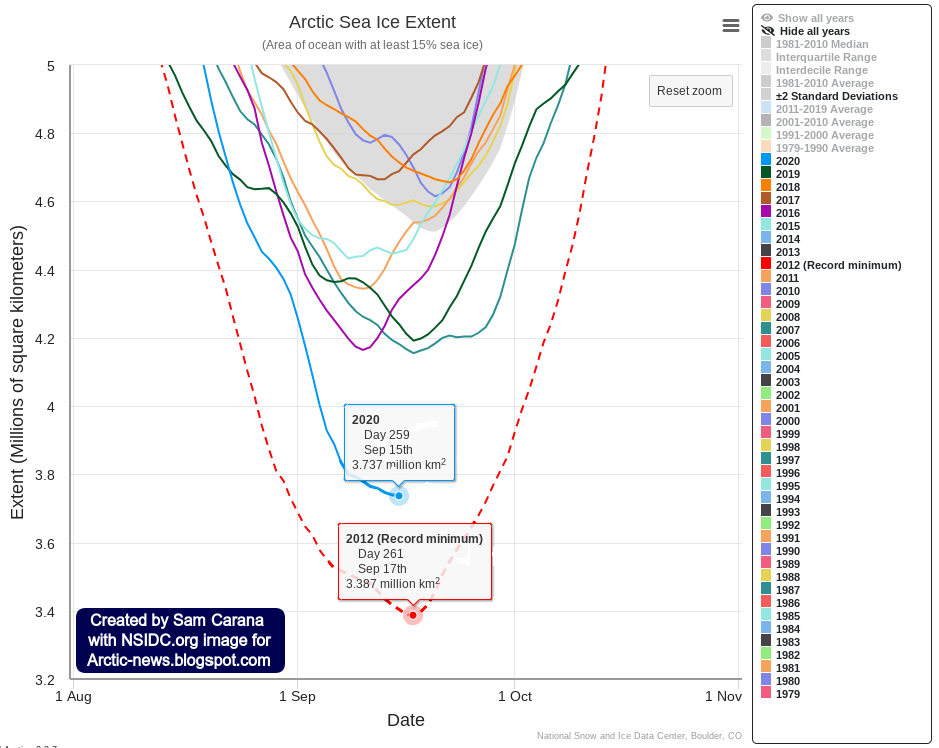
The image below, updated by the University of Bremen September 10, 2020, shows Arctic sea ice extent perilously close to 2012 extent. Note that the University of Bremen has meanwhile "reprocessed the data".

On the Northern Hemisphere, ocean temperatures are very high at the moment. The image below illustrates that, showing sea surface temperatures as high as 33.8°C on August 26, 2020. For some time to come, water flowing into the Arctic Ocean from the Atlantic Ocean and the Pacific Ocean will therefore remain higher than it used to be.

River water flowing into the Arctic Ocean also contributes to rising temperatures of the water of the Arctic Ocean.
As confirmed by a recent study, dramatic abrupt climate change is taking place in the Arctic, and another dangerous feedback of the rising heat is stronger storms, as also discussed in an earlier post.

Stronger storms can bring more moisture into the Arctic. Above image shows a forecast for August 29, 2020, 1200Z, with two cyclones hitting the Arctic Ocean and with 100% relative humidity at the North Pole, at 1000 hPa.

Above image shows a cyclone, forecast for August 25, 2020, with wind north of Greenland as fast as 67 km/h or 41 mph.

 Above image shows that rain is forecast to fall over the North Pole on August 26, 202, 12Z.
The image on the right is a forecast for August 26, 2020, 21Z. The image shows strong wind over the North Atlantic, while another cyclone is showing up north of Greenland.
Sea ice is very thin at the moment, so it is vulnerable to get broken up into small small pieces, thus speeding up its melting, as warm water can more easily reach the broken-up pieces from all sides.
 Such storms can batter the sea ice, and they can come with rain, further devastating the sea ice by speeding up melting and creating melt-pools on top of the ice with a low albedo.
The image on the right shows a forecast for August 29, 2020. Rain is showing up north of Greenland, as another cyclone is forecast to hit the area. The cyclone is forecast to have strong winds spinning counter-clockwise, thus threatening to speed up the drift of the sea ice north of Greenland toward Fram Strait.
A sequence of cyclones could in a short time push much of the thickest of the remaining sea ice out of the Arctic Ocean through Fram Strait.
The methane hydrates tipping point
As discussed in earlier posts such as this one, the rising temperature of the Arctic Ocean threatens to destabilize methane hydrates contained in sediments at the seafloor of the Arctic Ocean.
As the top image shows, the methane hydrates tipping point could be crossed soon, as the Arctic Ocean is heating up dramatically, which is in part the result of the latent heat tipping point getting crossed, which makes that the temperature of the Arctic Ocean can rise very rapidly.
The methane hydrates tipping point threatens to get crossed as ocean temperature anomalies on the Northern Hemisphere become higher than 1.35°C above the 20th century average, which threatens to occur early next year.
Because the Arctic Ocean in many places is very shallow, heat can quickly reach sediments at the seafloor, which threatens to destabilize methane hydrates. The water of the Arctic Ocean is particularly shallow over the East Siberian Arctic Shelf (ESAS), making that the water there can warm up very quickly during summer heat peaks with heat reaching the seafloor and penetrating cracks in frozen sediments at the seafloor, which can lead to abrupt destabilization of methane hydrates contained in these sediments.
As discussed in an earlier post, the loss of subsurface sea ice is only one of ten tipping points hitting the Arctic. As the temperature of the oceans keeps rising, more heat will reach sediments at the seafloor of the Arctic Ocean that contain vast amounts of methane, as discussed in this page and this post.

Large abrupt methane releases in one spot will quickly deplete the oxygen in shallow waters, making it harder for microbes to break down the methane there, while methane that is rising through waters that are only shallow will also be able to enter the atmosphere very quickly, leaving little time for microbes to break down the methane.
 As illustrated by the 2012 image on the right, a large abrupt release of methane from hydrates in the Arctic can have more warming impact than all carbon dioxide emitted by burning of fossil fuel in a year. This is due to the high global warming potential (GWP) of methane following its release.
As this heating is concentrated in the Arctic, it will contribute to further methane releases from hydrates in the Arctic, in another self-reinforcing feedback loop.
The situation is extremely dangerous, given the vast amounts of methane present in sediments in the ESAS and given that there is very little hydroxyl in the air over the Arctic to break down the methane.
 |
| [ from earlier post ] |
Ominously, the MetOp-1 satellite recorded a peak methane level of 2945 parts per billion (ppb), at 586 mb on the afternoon of August 18, 2020.

Two days later, the MetOp-1 satellite recorded a peak methane level of 2778 ppb, at 469 mb on the afternoon of August 20, 2020, while mean methane levels reached 1907 ppb.

That afternoon, on August 20, 2020, the MetOp-1 satellite recorded an even higher methane level, of 1923 ppb, at 293 mb, i.e. higher up in the atmosphere.

The danger is further illustrated by the image below, posted in February 2019 and showing a potential rise of 18°C or 32.4°F from 1750 by the year 2026.

Indeed, a rise of 18°C could eventuate by 2026, as illustrated by the image below and as discussed in an earlier post.
The situation is dire and calls for immediate, comprehensive and effective action, as described in the Climate Plan.
Links
• NOAA Global Climate Report - July 2020
https://www.ncdc.noaa.gov/sotc/global/202007
• Danish Meteorological Institute - 5 Day Ocean Forecast - Universal (Greenwich) Time
http://ocean.dmi.dk/anim/index.uk.php
• Danish Meteorological Institute - sea ice thickness and volume
http://polarportal.dk/en/sea-ice-and-icebergs/sea-ice-thickness-and-volume
• Danish Meteorological Institute - Arctic temperature
http://ocean.dmi.dk/arctic/meant80n.uk.php
• Danish Meteorological Institute - Arctic sea ice extent
http://ocean.dmi.dk/arctic/icecover.uk.php
• NOAA ocean heat content
https://www.nodc.noaa.gov/OC5/3M_HEAT_CONTENT/index.html
• MetOp satellite - methane
https://www.ospo.noaa.gov/Products/atmosphere/soundings/iasi
• Arctic sea ice - thickness - navy.mil
https://www7320.nrlssc.navy.mil/GLBhycomcice1-12/arctic.html
• Arctic sea ice - thickness - Universität Bremen
https://seaice.uni-bremen.de/databrowser
• Climate reanalyzer - precipitation, wind and pressure forecasts
https://climatereanalyzer.org/wx/fcst/?mdl_id=gfs&dm_id=world-ced&wm_id=prcp-mslp-gph500
• New release: Arctic warming satisfies criteria for abrupt climate change https://www.bjerknes.uib.no/en/article/news/arctic-warming-satisfies-criteria-abrupt-climate-change
• Past perspectives on the present era of abrupt Arctic climate change - by Eystein Jansen et al. https://www.nature.com/articles/s41558-020-0860-7
• Copernicus Atmosphere Monitoring Service
https://atmosphere.copernicus.eu/charts/cams
• Arctic sea ice extent - NSIDC
http://nsidc.org/arcticseaicenews/charctic-interactive-sea-ice-graph
• Arctic sea ice extent - Vishop, Arctic Data archive System, National Institute of Polar Research, Japan
https://ads.nipr.ac.jp/vishop/#/extent
• Arctic sea ice extent - University of Bremen
https://seaice.uni-bremen.de/data/amsr2/today/extent_n_running_mean_amsr2_previous.png
• North Hole 2020?
https://arctic-news.blogspot.com/2020/08/north-hole-2020.html
• Arctic Hit By Ten Tipping Points
https://arctic-news.blogspot.com/2020/04/arctic-hit-by-ten-tipping-points.html
• Why stronger winds over the North Atlantic are so dangerous
https://arctic-news.blogspot.com/2020/02/why-stronger-winds-over-north-atlantic-are-so-dangerous.html
• Very High Greenhouse Gas Levels
https://arctic-news.blogspot.com/2020/05/very-high-greenhouse-gas-levels.html
• Critical Tipping Point Crossed In July 2019
https://arctic-news.blogspot.com/2019/09/critical-tipping-point-crossed-in-july-2019.html
• Fast Path to Extinction
https://arctic-news.blogspot.com/2020/06/fast-path-to-extinction.html
• Crossing the Paris Agreement thresholds
https://arctic-news.blogspot.com/p/crossing.html
• 2°C crossed
https://arctic-news.blogspot.com/2020/03/2c-crossed.html
• Why America should lead on climate
https://arctic-news.blogspot.com/2016/01/why-america-should-lead-on-climate.html
• Methane's Role in Arctic Warming
https://arctic-news.blogspot.com/2016/02/methanes-role-in-arctic-warming.html
• The Threat
https://arctic-news.blogspot.com/p/threat.html
• When will we die?
https://arctic-news.blogspot.com/2019/06/when-will-we-die.html
• A rise of 18°C or 32.4°F by 2026?
https://arctic-news.blogspot.com/2019/02/a-rise-of-18c-or-324f-by-2026.html
• Most Important Message Ever
https://arctic-news.blogspot.com/2019/07/most-important-message-ever.html
• Climate Plan
https://arctic-news.blogspot.com/p/climateplan.html


