Showing posts with label CO2. Show all posts

Sunday, November 13, 2016

Monthly CO₂ not under 400 ppm in 2016

For the third year in a row, global carbon dioxide emissions from fossil fuels and industry (including cement production) have barely grown, as the Global Carbon Project image below shows:


Nonetheless, CO₂ levels have continued to rise and, as illustrated by the trend on the image below, they may even be accelerating.


According to NOAA, annual mean global carbon dioxide grew from 2004-2014 by an average 2.02 ppm per year. For 2015 the growth rate was 2.98 ppm. As an indication for what the 2016 growth rate will be, global CO₂ levels grew by 3.57 ppm between September 2015 and September 2016, and by 3.71 ppm between October 2015 and October 2016. How could growth in CO₂ levels in the atmosphere possibly be accelerating, given that emissions from fossil fuel burning and cement production have barely risen over the past few years?

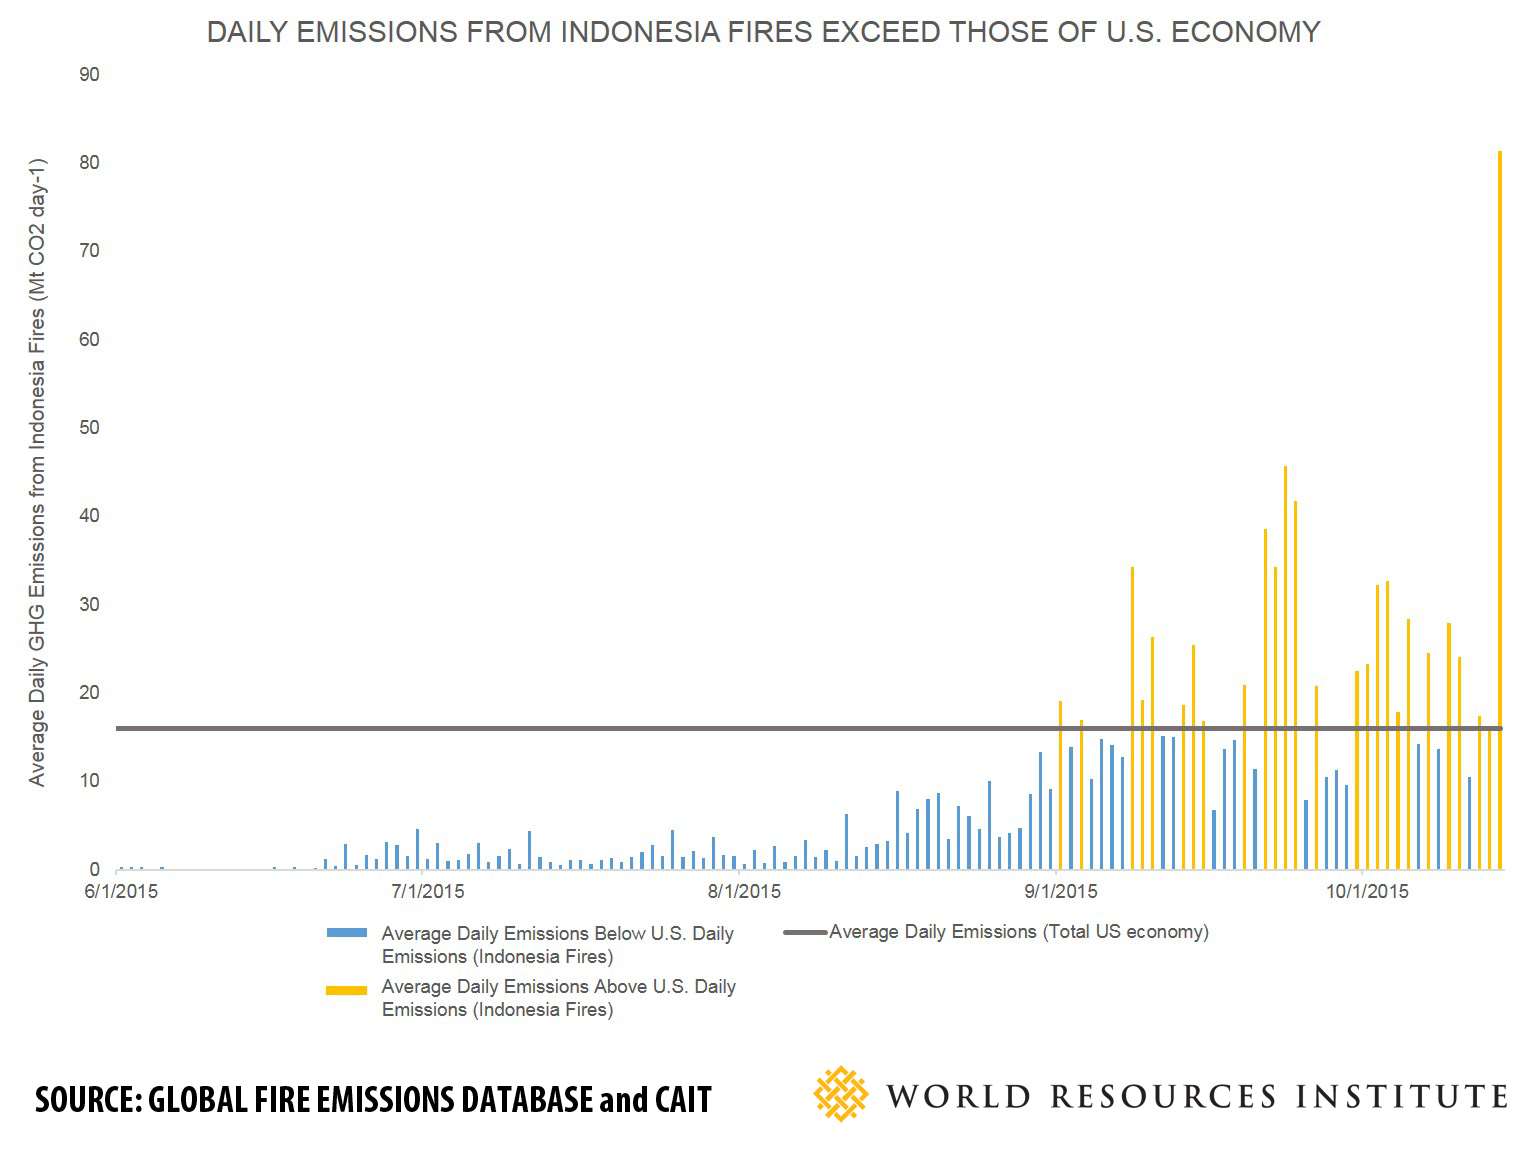
Deforestation and other land-use changes, in particular wildfires

During the decade from 2006 to 2015, emissions from deforestation and other land-use change added another 1.0±0.5 GtC (3.3±1.8 GtCO₂) on average, on top of the above emissions from fossil fuel and cement. In 2015, according to the Global Carbon Project, deforestation and other changes in land use added another 1.3 GtC (or 4.8 billion tonnes of CO₂), on top of the 36.3 billion tonnes of CO₂ emitted from fossil fuels and industry. This rise in emissions from deforestation and other changes in land use constitutes a significant increase (by 42%) over the average emissions of the previous decade, and this jump was largely caused by an increase in wildfires over the past few years.

In 2016, monthly mean global CO₂ levels didn't get below 400 ppm. It was the first time that this happened in over 800,000 years.


On their way up, global CO₂ levels fluctuate with the seasons, typically reaching an annual minimum in August. In August 2016, CO₂ levels reached a low of 400.44 ppm, i.e. well above 400 ppm. In September 2016, carbon dioxide levels had gone up again, to 400.72 ppm. Importantly, a trend is contained in the data indicating that growth is accelerating and pointing at a CO₂ level of 445 ppm by the year 2030.

Sensitivity

Meanwhile, research including a 2014 study by Franks et al. concludes that IPCC was too low in its estimates for the upcoming temperature rise locked in for current CO₂ levels. A study by Friedrich et al. updates IPCC estimates for sensitivity to CO₂ rise, concluding that temperatures could rise by as much as 7.36°C by 2100 as a result of rising CO₂ levels.

When also taking other elements than CO₂ more fully into account, the situation looks to be even worse than this, i.e. the global temperature rise could be more than 10°C (or 18°F) over the coming decade, as further described at the extinction page.

Land sink


1 Gigatonne (Gt) = 1 billion tonnes = 1 Petagram (Pg).
1 PgC = 3.664 Gt of CO₂. Oceans have absorbed some
40% of CO₂ emissions since the start of the industrial era.
Recent annual CO₂ take up by oceans is about 26%
(annual global average over 2006 - 2015).

Above image also shows an increase of the land sink over the years, which a recent study attributes to higher CO₂ levels in the atmosphere. While this increase of the land sink appears to have held back a stronger temperature rise for some time, there are indications that this land sink is now decreasing.

A recent study suggests that some 30 ± 30PgC could be lost from the top 10 cm surface soil for a 1°C, and some 55 ± 50 PgC for a 2°C rise of global average soil surface temperatures, which would increase CO₂ levels in the atmosphere by some 25 ppm. The study adds that, since high-latitude regions have the largest standing soil C stocks and the fastest expected rates of warming, the overwhelming majority of warming-induced soil C losses are likely to occur in Arctic and subarctic regions. See also the video below for more on this study.

In other words, land is now taking up less carbon and is contributing more and more to global warming:
  • Deforestation and Soil Degradation: Agricultural practices such as depleting groundwater and aquifers, plowing, mono-cultures and cutting and burning of trees to raise livestock can significantly reduce the carbon content of soils, along with soil moisture and nutrients levels.
  • Climate change and extreme weather events: The recent jump in global temperature appears to have severely damaged soils and vegetation. Soil carbon loss and enhanced decomposition of vegetation appear to have occurred both because of the temperature rise and the resulting extreme weather events such as heatwaves, drought, dust-storms and wildfires, and storms, hail, lightning, flooding and the associated erosion, turning parts of what was once a huge land sink into sources of CO₂ emissions. Even worse, such extreme weather events can also lead to emissions other than CO₂ emissions, such as of soot, nitrous oxide, methane and carbon monoxide, which can in turn cause a rise in the levels of ground-level ozone, thus further weakening vegetation and making plants even more vulnerable to pests and infestations.
  • Albedo: As a 2009 study warned, higher temperatures could also cause decreased canopy transpiration, due to less widely opened plant stomata and the resultant increase in stomatal resistance at higher atmospheric CO₂ concentrations. As a result, low cloud cover is decreasing over most of the land surface, reducing planetary albedo and causing more solar radiation to reach the surface, thus further raising temperatures beyond the level of viability for many species. At the same time, the above extreme weather events are causing more water vapor to rise high in the atmosphere, resulting in cirrus clouds that reflect only little sunlight back into space, while trapping more heat (i.e. surface radiation emitted as longwave energy into space). Furthermore, emissions such as dust and soot from wildfires and storms can settle on snow and ice, resulting in faster melting.


Explanation of Quantifying global soil carbon losses in response to warming (1 December 2016) by lead author Thomas Crowther from the Netherlands Institute of Ecology (NIOO-KNAW) and Yale University.

Conclusion

In conclusion, while CO₂ emissions from fossil fuels and industry may have barely grown, levels of greenhouse gases are steadily increasing, if not accelerating. At the same time, extreme weather events are on the rise and there are further factors contributing to cause the land carbon sink to shrink in size. Furthermore, the IPCC appears to have underestimated sensitivity to CO₂ rise.

Rising Temperatures

Without action, temperatures can therefore be expected to rise further, rather than come down from their currently already very high levels, as illustrated by the image below.


The image below shows the temperature rise of the oceans. Temperatures are rising particularly rapidly on the Northern Hemisphere. Much of that heat is carried by the Coriolis force along the Gulf Stream toward the Arctic Ocean.

[ click on images to enlarge ]
This contributes to a huge rise in the temperature of the atmosphere over the Arctic Ocean, as illustrated by the images below. The image directly below shows showing temperature rises up to 10.2°C in the Arctic for October 2016.


The DMI graph below shows daily mean temperature and climate north of the 80th northern parallel, as a function of the day of year.

Red line: 2016 up to November 15, 2016.  -   Green line: climate 1958-2002.

On November 19, 2016, on 00.00 UTC, the Arctic was as much as 7.54°C or 13.57°F warmer than it was in 1979-2000, as illustrated by the image below.


The image below shows the average temperature on November 19, 2016. The Arctic was 7.3°C or 13.14°F warmer than it was in 1979-2000, illustrating the accelerating warming of the Arctic Ocean. The Arctic Ocean in many places shows temperature anomalies at the top end of the scale, i.e. 20°C or 36°F.


Global sea ice

As another reflection of an increasingly warmer world, the combined extent of Arctic and Antarctic sea ice is currently at a record low. On November 12, 2016, combined global sea ice extent was only 23.508 million km².


On November 18, 2016, combined Arctic and Antarctic sea ice extent was only 22.608 million km². That's a fall of 0.9 million km² in six days!


Two images, created by Wipneus with NSIDC data, are added below to further illustrate the situation.

Above image shows global sea ice extent over the years, while the image below shows global sea ice area over the years. For more on the difference between extent and area, see this NSIDC FAQ page.

Some of the consequences of the dramatic global sea ice decline are:
  • More Ocean Heat: Huge amounts of sunlight that were previously reflected back into space are now instead absorbed by oceans.
  • Faster Melt: Decline of the sea ice makes it easier for warm sea water to get underneath glaciers and speed up their flow into the water.
  • Stronger Storms: More open water results in stronger storms, causing rainfall and further decline of the snow and ice cover, as well as greater cloud cover at high altitudes, resulting in more warming.
  • More Methane: Further decline of the snow and ice cover on Greenland and Antarctica in turn threatens to cause increased releases of methane from Greenland and Antarctica, as described in earlier posts such as this one. Furthermore, continued warming of the Arctic Ocean threatens to cause huge eruptions of methane from its seafloor.
Methane

While carbon dioxide emissions get a lot of attention (and they definitely must be cut rapidly and dramatically), the rise of methane is possibly even more worrying. The image below shows historic growth rates of methane (CH4), carbon dioxide (CO₂) and nitrous oxide (N2O).


According to NOAA data, annual mean global methane grew from 2004-2013 by an average of 3.75 ppb per year. In 2014, the growth rate was 12.56 ppb. In 2015, the growth rate was 10.14 ppb. According to the WMO, methane's 2014–2015 absolute increase was 11 ppb. For more on methane, see the methane page.

The situation is dire and calls for comprehensive and effective action, as described in the Climate Plan.


Links

 Greenhouse gas levels and temperatures keep rising
http://arctic-news.blogspot.com/2016/01/greenhouse-gas-levels-and-temperatures-keep-rising.html

 Climate Feedbacks Start To Kick In More
http://arctic-news.blogspot.com/2016/06/climate-feebacks-start-to-kick-in-more.html

 Pursuing Efforts?
http://arctic-news.blogspot.com/2016/10/pursuing-efforts.html

 Methane hydrates
http://methane-hydrates.blogspot.com/2013/04/methane-hydrates.html

 Wildfires in Russia's Far-East
http://arctic-news.blogspot.com/2016/08/wildfires-in-russias-far-east.html

 Methane
http://arctic-news.blogspot.com/p/methane.html


Sunday, August 14, 2016

Wildfires in Russia's Far East

Wildfires can add huge amounts of carbon dioxide (CO2), carbon monoxide (CO), methane (CH4), nitrous oxide (N2O) and black carbon (BC or soot) into the atmosphere.

While CO and soot are not included as greenhouse gases by the IPCC, they can have strong warming impact. CO acts as a scavanger of hydroxyl, thus extending the lifetime of methane. BC results from biomass burning, which a study by Mark Jacobson found to cause 20 year global warming of ~0.4 K. Moreover, BC has a darkening effect when settling on snow and ice, making that less sunlight gets reflected back into space, which accelerates warming. This hits the Arctic particularly hard during the Northern Summer, given the high insolation at high latitudes at that time of year.

The image below shows fires around the globe on August 12, 2016.


Visible in the top right corner of above image are wildfires in Russia's Far East. The image below zooms in on these wildfires.


The image below shows carbon dioxide levels as high as 713 ppm and carbon monoxide levels as high as 32,757 ppb on August 12, 2016, at the location marked by the green circle, i.e. the location of the wildfires in Russia's Far East.


As said, wildfires can also emit huge amounts of methane. The image below shows methane levels as high as 2230 ppb at 766 mb.


The magenta-colored areas on above image and the image below indicate that these high methane levels are caused by these wildfires in Russia's Far East. The image below shows methane levels as high as 2517 ppb at 586 mb.


Methane levels as high as 2533 ppb were recorded that day (at 469 mb), compared to a mean global peak of 1857 ppb that day.

Analysis by Global Fire Data found that the 2015 Indonesian fires produced more CO2e (i.e. CO2 equivalent of, in this case, CO2, CH4 and N2O) than the 2013 CO2 emissions from fossil fuel by nations such as Japan and Germany. On 26 days in August and September 2015, emissions from Indonesian fires exceeded the average daily emissions from all U.S. economic activity, as shown by the WRI image below.

A recent study calculated that Indonesia’s 2015 fires killed 100,000 people.

Methane emissions from wildfires can sometimes be broken down relatively quickly, especially in the tropics, due to the high levels of hydroxyl in the atmosphere there. Conversily, methane from wildfires at higher latitudes can persist much longer and will have strong warming impact, especially at higher latitudes.

Similarly, CO2 emissions from wildfires in the tropics can sometimes be partly compensated for by regrowth of vegetation after the fires. However, regrowth can be minimal in times of drought, when forests are burned to make way for other land uses or when peat is burned, and especially at higher latitudes where the growth season is short and weather conditions can be harsh. Carbon in peat lands was built up over thousands of years and even years of regrowth cannot compensate for this loss.

A recent study concludes that there is strong correlation between fire risk for South America and high sea surface temperatures in the Pacific Ocean and the Atlantic Ocean. This makes the current situation very threatening. As the image below shows, sea surface temperature anomalies were very high on August 12, 2016.

Sea surface temperature and anomaly. Anomalies from +1 to +2 degrees C are red, above that they turn yellow and white
Above image also shows that on August 12, 2016, sea surface temperatures near Svalbard (at the location marked by the green circle) were as high as 18.9°C or 65.9°F, an anomaly of 13.6°C or 24.4°F. These high temperatures threaten to melt away the Arctic's snow and ice cover, resulting in albedo changes that accelerate warming, particularly in the Arctic. Warming of the Arctic Ocean further comes with the danger that methane hydrates at its seafloor will destabilize and make that huge amounts of methane will enter the atmosphere.

The situation is dire and calls for comprehensive and effective action, as described in the Climate Plan.


Links

 Effects of biomass burning on climate, accounting for heat and moisture fluxes, black and brown carbon, and cloud absorption effects, by Mark Z. Jacobson (2014)
http://onlinelibrary.wiley.com/doi/10.1002/2014JD021861/abstract

 2016 fire risk for South America
http://www.ess.uci.edu/~amazonfirerisk/ForecastWeb/SAMFSS2016.html

 Global Fire Data - 2015 Indonesian fires
http://www.globalfiredata.org/updates.html#2015_indonesia

 Indonesia’s Fire Outbreaks Producing More Daily Emissions than Entire US Economy (2015)
http://www.wri.org/blog/2015/10/indonesia%E2%80%99s-fire-outbreaks-producing-more-daily-emissions-entire-us-economy

 Indonesia’s 2015 fires killed 100,000 people, study finds
http://www.climatechangenews.com/2016/09/19/indonesias-2015-fires-killed-100000-people-study-finds

 Smoke from 2015 Indonesian fires may have caused 100,000 premature deaths
https://www.seas.harvard.edu/news/2016/09/smoke-from-2015-indonesian-fires-may-have-caused-100000-premature-deaths

 High Temperatures in the Arctic
http://arctic-news.blogspot.com/2015/06/high-temperatures-in-the-arctic.html


Saturday, July 30, 2016

Olivine weathering to capture CO2 and counter climate change

Professor Schuiling in front of a huge and very impressive olivine massif in Oman

Olivine weathering to capture CO₂ and counter climate change - by R.D. Schuiling


Abstract

CO₂ is emitted in large quantities as a consequence of our burning of fossil fuels. It has several unpleasant consequences, because it will probably cause climate change, and there are several reports that high levels of CO₂ in offices and schools may impair the quality of thinking of the people that work there. Although higher levels of it in the atmosphere may also have some beneficial effects on vegetation, it should be considered as a possibly dangerous pollutant.

Introduction


Many new technologies are proposed to remove CO₂ from the atmosphere, but strangely enough the only process that has always removed the excess of CO₂ emitted by volcanoes since the origin of the Earth is barely considered. It is the weathering of minerals by which almost all the CO₂ that was emitted during the past by volcanoes was transported as bicarbonate solutions to the oceans where it was sustainably stored as carbonate rocks (limestones and dolomites).
Mg₂(SiO₄)  + 4 CO₂ + 4 H₂O 2 Mg²⁺ + 4 HCO3- + H₄(SiO₄)

These rocks contain about 1 million times more CO than the oceans, the atmosphere and the biosphere combined. It has provided a livable atmosphere, in contrast with Venus, where weathering was impossible due to the lack of liquid water. At present the CO levels in the atmosphere are rising, because the anthropogenic emission of CO is so large that this weathering process cannot keep pace with it. I propose to use a process of enhanced weathering to regain a new balance between input and output. In order to make this cost-effective, my examples will all represent a combination of CO capture with another beneficial effect, by which the total effect is cheaper, and may occasionally even lead to a positive financial result.

Ten cost-effective applications of olivine weathering:
  1. Increasing rice production by spreading olivine grains in paddies
  2. Olivine spreading on acid soils instead of liming
  3. Biogas production with additional methane production
  4. Solution of the sick-building syndrome of schools and offices
  5. The use of the surf as a huge ball-mill
  6. Diatom cultivation for the production of biodiesel
  7. Phytomining of nickel from olivine-rich soils
  8. Olivine hills to produce healthy mineral water
  9. Quenching forest fires with a serpentine slurry
  10. Tackling natural emissions in Milos, Greece

1. Increasing rice production by spreading olivine grains in paddies

Rice, like the other “wet grasses” like bamboo and reed needs silica. This is made available by spreading olivine grains over the paddies. It is very easy to measure the effects, by sampling the irrigation water where it enters the paddy, and sample it again where the water leaves the paddy containing olivine. The difference between the two analyses represents the effect of the weathering of the olivine. Rice production is negatively affected by acid conditions (1), and the weathering of olivine makes conditions more alkaline. As rice cultivation occupies 146 million hectares, spreading these annually with 4 ton of olivine per hectare also represents a sizable capture of CO. The increase of rice production can be measured by spreading for example 1, 3 and 10 ton of olivine over 3 paddies, and compare rice production with the production of a similar paddy without olivine spreading.

2. Olivine spreading on acid soils instead of liming

The approach as sketched above for rice can be extended to other acid agricultural soils as well. Normally acid soils are remediated by liming, but olivine spreading can do the same, and captures CO at the same time, whereas liming has a penalty for its CO emissions on account of the mining, milling and transporting of lime. Tests at the Agricultural University of Wageningen (2) have shown that olivine application increases productivity. The costs of adding lime or olivine will be rather similar, and soil scientists should decide whether a mixture of the two produces a better soil than using only one of the two.

3. Biogas production with additional methane production

Increasing methane production in biogas installations. In the normal operation of biodigesters, the produced gas contains roughly 2/3 methane, 1/3 CO and traces of HS. Before this gas can be added to the national gas lines, the CO content must be drastically reduced by rather expensive operations, and the HS must be removed. Tests with digesters have shown that the addition of fine-grained olivine has 3 important effects. It creates more alkaline conditions, which make that a larger part of the CO is already taken up as bicarbonate in the digestate, and does not have to be removed by expensive technologies. The second effect is that the traces of HS react with the iron content of the olivine and forms solid iron sulfide particles (olivine is a mixed crystal of Mg(SiO) and Fe₂(SiO₄). The third effect was somewhat unexpected. The methane production increases by the following reaction:

6 Fe₂(SiO₄) + CO₂ + 14 H₂O  Fe₃O₄ + CH₄ + 6 H₄(SiO₄)

The methane reaction is catalyzed by the tiny magnetite crystals that form in this reaction. In view of the important role of iron in the olivine, it may be worthwhile to look for olivine deposits with a higher Fe-content than the usual olivine. This application will reduce the costs of the digestion, and increase its production.

4. Solution of the sick-building syndrome of schools and offices

It was recently found by research groups in Berkeley and Harvard (3,4) that the high CO content of the internal atmosphere of these buildings (rising to 1500 to 1600 ppm in the afternoon compared to 400 ppm in the atmosphere outside) impaired the quality of thinking of the inmates. To avoid this, one can open doors and windows, but in temperate climates this causes serious increases in energy costs, and will often cause dust and noise problems. One can prevent this by installing a so-called CATO-reactor (Clean Air Through Olivine). This is a trough-like basin filled with an emulsion of fine olivine grains. Along the bottom a perforated pipe is installed, through which the internal atmosphere of the building is transported under a slight overpressure. The air bubbles pass through the olivine emulsion, and the CO is converted to bicarbonate in solution. This set-up has the additional advantage that it will also trap allergenic particles or pollen, which will make life easier for people who suffer from asthma or hay fever.

5. The use of the surf as a huge ball-mill

The surf as the largest ball-mill on Earth. Milling of olivine (around 2 US$/ton for milling olivine to 100 micron) is a cost that can be avoided if nature provides a zero cost alternative. We have carried out experiments with angular coarse olivine grit in a simulated very modest surf (5). After a few days the grains were rounded and polished grains (Fig. 1). Tiny micron-sized slivers were knocked off by collisions and abrasion. These slivers weathered in a few days.

Fig 1: The surf turns angular coarse olivine grit into rounded and polished grains in a few days
Depositing coarse olivine grit directly on beaches in the surf may well become the cheapest large-scale way to capture CO and restore the pH of the oceans.

6. Diatom cultivation for the production of biodiesel

Diatom cultivation for biodiesel production. Biofuels are produced at fairly large scale from oil palms, sorghum, maize and the like. This production occupies large tracts of land, which are withdrawn from the world food production. They consume large volumes of irrigation water, and use expensive fertilizer. Moreover not seldomly reservations for threatened animals, like the orang outan are used for these plantations. Enough reasons to look for different solutions. Diatoms (silica algae) are rich in organic material from which biodiesel can be produced. They are called silica algae, because their exoskeleton is made of silica. They can multiply fast, provided that they have enough silica. This can be provided by the weathering of olivine. One can think of the following solution for diatom cultivation. Create a lagoon along the beach, by surrounding a piece of the sea in front of this beach by a dam. Construct a connection through this dam, through which water can flow into the lagoon at high tide, and flow out of the lagoon at ebb tide. Cover the beach with half a meter thick layer of olivine grains between the high tide line and the low tide line. This beach will alternatively be wetted and drained, by which the silica-rich water will flow into the lagoon, and feed the diatoms. The dead diatoms must be harvested, dried and transported to the biodiesel plant . The diatom production in the lagoon can be boosted by installing an underwater led lighting, which makes that the photosynthesis of the diatoms can continue through the night.

7. Phytomining of nickel from olivine-rich soils

Phytomining of nickel. Olivine contains more nickel than most rocks, but still much lower than nickel ores. There are a number of plant species that have the strange habit that they can extract nickel very well from the soils on olivine rock and store it in their tissues . When you harvest these plants at the end of the growing season, dry them and burn them, the plant ash often contains around 10% of nickel, more than the richest nickel ore. Mining is an energy-intensive affair and has a high CO emission. Moreover the mining and the metal extraction from the ore cause a lot of pollution. This makes it tempting to see if you can use these nickel hyperaccumulator plants to do the job of mining without large CO emissions (6). Figure 2 shows the flowering Alyssum plants (a well-known nickel hyperaccumulator plant) on the tailings of an asbestos mine in Cyprus.

Fig 2: Yellow blossomed Alyssum nickel hyperaccumulator plants grow on tailings of former asbestos mine on Cyprus
8. Olivine hills to produce healthy mineral water

Olivine hills to produce healthy mineral water. When olivine weathers, it turns the water into a healthy magnesium bicarbonate water. According to the FAO such waters are active against cardiovascular diseases. This makes it interesting to see if we can produce similar mineral waters in places where there is no olivine in the subsoil. This is possible by the use of olivine hills (7). These can be constructed as follows. First make an impermeable layer on the soil in the form of a very flat slightly inclined gutter. Cover this with a hill of olivine grains of several meter thickness. Add soil over this hill, and plant it with shrubs and grasses. Soils are much richer in CO than the atmosphere. This is caused by the decay of dead plant material which produces CO in the soil, as well as the breathing of animals living in this soil. When it rains, the water will first encounter this CO-rich soil atmosphere, equilibrate with it and become aggressive. This CO-rich water will then move into the olivine layer, and react with it, producing a healthy magnesium bicarbonate water. This will trickle through the olivine layer until it meets the impermeable base, where it will slowly trickle to the lowest point of the gutter, where it will be released through a tap, where visitors can collect some of this water and drink it.

9. Quenching forest fires with a serpentine slurry

Quenching forest fires with a serpentine slurry. Forest fires cause the largest emission of CO after the emission by burning fossil fuels (8). Large forest fires lead to a number of deaths. Both from the public health side as from the CO emission side it would be helpful if we found a better way to quench forest fires rapidly. The following seems to be a promising way to achieve this. Serpentine is the hydrated form of olivine, it is similar to clay minerals. It is well-known that baking clays to make bricks consume a lot of energy. This is an unpleasant property, except where it is important to remove as much heat as possible, like in forest fires. We carried out a number of tests to see whether spreading serpentine slurries over fires would be a more effective way to quench fires than just water. This turned out to be very clearly the case, but not for the reason we thought. Test fires were extinguished in a few seconds when serpentine slurries were sprinkled over them, but the removal of excess heat was only a minor factor in the success. When serpentine slurries are spread over burning wood, the serpentine immediately dissociates, and forms a thin amorphous layer on the burning material. Oxygen can no longer come in contact with the burning wood, and inflammable gases from the burning wood can no longer escape. Test fires were quenched in a few seconds. As serpentinites are very common rocks, it should be easy to introduce this way of quenching to combat forest fires. It is hoped that this will be introduced by the fire brigades in many countries that suffer from forest fires, and thus save unnecessary deaths and destruction of properties. The amorphous product of the serpentine after it has reacted in the fire reacts quite fast with the first rains, faster than olivine, and thus compensates part of the CO₂ that was emitted by the fire.

10. Tackling natural emissions in Milos, Greece

CO₂ levels in the atmosphere are rising, because we are burning in a few hundred years the fossil fuels (coal, oil, gas) that have taken hundreds of millions of years to form. This will probably cause a climate change, with disastrous world problems, because the ice in Greenland and Antarctica will melt and cause a serious sealevel rise. It is important, therefore, to capture as much CO₂ as possible and store it in a safe and sustainable manner.

It makes no difference for the climate if we capture anthropogenic CO₂ or natural CO₂ emissions, because all CO₂ molecules are identical. The anthropogenic emissions are much more voluminous, but natural emissions are easier to capture. An excellent example is found on and around the island of Milos, where annually 2.2 million tons of hot CO₂ are emitted from a surface area of about 35 km². The village of Paleochori is the center of this CO₂ emission. Most of the CO₂ emission is by bubbles rising out of the shallow seafloor, but CO₂ is also emitted on land. When you try to dig a hole in the beach with your hands, you have to stop when the hole is elbow-deep, otherwise you burn your hands. The bubbles are so hot, that a local restaurant in Paleochori is even using it for its “volcanic cooking”. They have buried a box in the beach sand, in which they cook a lamb every morning. Delicious to have a juicy lamb for lunch on the terrace of that restaurant, while you look out over the blue Aegean.

It becomes important for the world to capture as much CO₂ as possible. When you apply this to the CO₂ emissions at Milos, one could do the following. First find a place where the most CO₂ bubbles rise from the shallow sea floor. Then make a small artificial island by covering this point with a hill of olivine sand as well as larger olivine pieces. Of course, when bubbles of CO₂ rise in the sea, they will assume the same temperature as the sea water, but if they rise in an olivine hill they will cause the temperature inside that olivine hill to rise, because now the hot bubbles release their heat to the surrounding olivine grains. This situation will lead to a small convection system. The warm water inside the hill will start to rise, and cold seawater will be sucked in the hill from the sides. If one constructs a shallow pit on top of the island, it will fill with warm water.

Would it not be an exotic temptation for tourists, to lie even in winter in a warm bath on top of a small island, and look out over a cool blue sea? They will feel even better if they know that these delicious sensations are a small part of our efforts to save the world from climate change, and the seas from acidification. The reaction of the olivine with water + CO₂ is exothermic, so that provides some additional heat for the water in the bath.

Additional information:

As said, the weathering reaction of olivine with water and CO2 is as follows:
Mg₂(SiO₄)  + 4 CO₂ + 4 H₂O  2 Mg²⁺ + 4 HCO3- + H₄(SiO₄)

This means that the greenhouse gas CO₂ is converted to a bicarbonate solution, so it is no longer affecting the climate.

Some possible sources of olivine in Greece

Olivine is a very common mineral. The tailings of a magnesite company in northern Greece contain close to ten million tons of crushed olivine. A port is not too far from the location of that magnesite mine. Nearer by, on the island of Naxos, there are quite a few places with olivine rocks at the surface, where the material could be obtained by a small open pit digging operation. Apart from the proposal as a touristic attraction, Greece can present it as one of their attempts to sustainably capture the greenhouse gas CO₂.

Conclusion

Removal of CO₂ from the atmosphere can be combined in a number of ways with other positive effects, which makes such operations considerably more cost-effective.


References
  1. Breemen, N. van (1976) Genesis and solution chemistry of acid sulfate soils in Thailand. PhD thesis. Agricultural University of Wageningen, 263 pp.
    http://library.wur.nl/WebQuery/wurpubs/70246
  2. Ten Berge, H.F.M., van der Meer, H.G., Steenhuizen, J.W., Goedhart, P.W., Knops, P. Verhagen, J. (2012) Olivine weathering in Soil, and its Effects on Growth and Nutrient Uptake in Ryegrass (Lolium perenne L.). A Pot Experiment. PLOS\one, 7(8): e42098.
    https://journals.plos.org/plosone/article?id=10.1371/journal.pone.0042098
  3. Savchuk, K. (2016) Your brain on Carbon dioxide: Research finds low levels of indoor CO impair thinking. California Magazine/summer 2016.
    https://alumni.berkeley.edu/california-magazine/summer-2016-welcome-there/your-brain-carbon-dioxide-research-finds-even-low
  4. Allen, J.G., Macnaughton, P., Satish, U., Spengler, J.D. (2015) Association of cognitive function scores with carbon dioxide, ventilation, and volatile organic compound exposure in office workers: a controlled exposure study of green and conventional office environments. Env. Health Perspectives, October 2015.
    https://ehp.niehs.nih.gov/doi/10.1289/ehp.1510037
  5. Schuiling, R.D. and de Boer, P.L. (2011) Rolling stones, fast weathering of olivine in shallow seas for cost-effective CO capture and mitigation of global warming and ocean acidification. Earth Syst. Dynam. Discuss., 2, 551-568. doi:10.5194/esdd-2-551.
    https://www.earth-syst-dynam-discuss.net/esd-2011-20/
  6. Schuiling, R.D. (2013) Farming nickel from non-ore deposits, combined with CO sequestration. Natural Science 5, no 4, 445-448.
    https://www.scirp.org/journal/PaperInformation.aspx?paperID=29842
  7. Schuiling, R.D. and Praagman, E. (2011) Olivine Hills, mineral water against climate change. Chapter 122 in Engineering Earth: the impact of megaengineering projects. Pp 2201-2206. Ed.Stanley Brunn, Springer.
    https://link.springer.com/chapter/10.1007%2F978-90-481-9920-4_122
  8. Schuiling, R.D. (2015) Serpentinite slurries against Forest Fires. Open J. Forestry, 5, 255-259.
    https://www.scirp.org/journal/PaperInformation.aspx?PaperID=54576

Further publications

• Olivine against climate change and ocean acidification, by R. D. Schuiling and Oliver Tickell (2011)
https://www.researchgate.net/publication/228429017_Olivine_against_Climate_Change_and_Ocean_Acidification

• Climate change and the KISS principle, by R.D. Schuiling, O. Tickell and S.A. Wilson (2011) Mineralogical Magazine, 75(3) 1826
https://goldschmidtabstracts.info/abstracts/abstractView?id=2011001095

• Six Commercially Viable Ways to Remove CO2 from the Atmosphere and/or Reduce CO2 Emissions, by R.D. Schuiling and Poppe L. de Boer (2013) Environmental Sciences Europe, 25, 35.
https://enveurope.springeropen.com/articles/10.1186/2190-4715-25-35

• Climate Change and CO₂ Removal from the Atmosphere, by Roelof Dirk Schuiling (2014)
https://www.scirp.org/journal/PaperInformation.aspx?PaperID=46308

• Olivine Weathering against Climate Change, by Roelof Dirk Schuiling (2017)
https://www.scirp.org/journal/PaperInformation.aspx?paperID=73520


Related

• Policies
http://arctic-news.blogspot.com/p/policies.html

• Combining Policy and Technology
http://geo-engineering.blogspot.com/2011/11/combining-policy-and-technology.html


Saturday, May 21, 2016

Arctic Climate Records Melting

An intensely warm winter and spring are melting climate records across Alaska, reports NOAA in the post 'Arctic set for record-breaking melt'. The January-April 2016 period was 11.4°F (6.4°C) warmer than the 20th century average, reports NOAA. The NOAA image below further illustrates the situation.
The sea ice is melting rapidly. Warm water from the Mackenzie River contributes to dramatic melting in the Beaufort Sea, as illustrated by the image below, showing that on May 20, 2016, the Arctic Ocean was 5°F (2.8°C) warmer than in 1981-2011 at the delta of the Mackenzie River.


The image below shows that on May 20, 2016, sea ice extent was 10.99 million square km, compared to the 12.05 million square km extent of the sea ice in May 20, 2012, as measured by JAXA


Sea ice reached a record minimum extent of 3.18 million square km on September 15, 2012, and chances are that the sea ice will be largely gone by September 2016.

The year 2016 is an El Niño year and insolation during the coming months of June and July is higher in the Arctic than anywhere else on Earth. Higher temperatures come with increased danger of wildfires. Greenhouse gases are at record high levels: in April and may, CO2 was about 408 ppm, with hourly peaks as high as 411 ppm (on May 11, 2016). Methane levels are high and rising, especially over the Arctic. Smoke and methane are speeding up sea ice melting, as illustrated by the image below showing smoke from wildfires in Canada extending over the Beaufort Sea (main image), in addition to high methane levels that are present over the Beaufort Sea (inset). 


Ocean heat is also very high and rising. Oceans on the Northern Hemisphere were 0.93°C (or 1.7°F) warmer in the most recent 12-months period (May 2015 through April 2016) than the 20th century average.

The image below shows sea ice extent as measured by the NSIDC, confirming that melting of the sea ice in 2016 is way ahead on previous years.


Monday, May 2, 2016

Wildfire Danger Increasing

Wildfires are starting to break out in British Columbia, Canada. The wildfire on the image below started on May 1, 2016 (hat tip to Hubert Bułgajewski‎).


The coordinates of the wildfire are in the bottom left corner of above map. They show a location where, on May 3, 2016, it was 26.0°C (or 78.8°F). At a nearby location, it was 27.6°C (or 81.8°F) on May 3, 2016. Both locations are indicated on the map on the right.

These locations are on the path followed by the Mackenzie River, which ends up in the Arctic Ocean. Wildfires aggravate heat waves as they blacken the soil with soot. As the Mackenzie River heats up, it will bring warmer water into the Arctic Ocean where this will speed up melting of the sea ice.

Moreover, winds can carry soot high up into the Arctic, where it can settle on the sea ice and darken the surface, which will make that more sunlight gets absorbed, rather than reflected back into space as before.

The danger of wildfires increases as temperatures rise. The image on the right show that temperatures in this area on May 3, 2016 (00:00 UTC) were at the top end of the scale, i.e. 20°C or 36°F warmer than 1979-2000 temperatures.

Extreme weather is becoming increasingly common, as changes are taking place to the jet stream. As the Arctic warms up more rapidly than the rest of the world, the temperature difference between the Equator and the North Pole decreases, which in turn weakens the speed at which the north polar jet stream circumnavigates the globe.

This is illustrated by the wavy patterns of the jet stream in the image on the right, showing the situation on May 3, 2016 (00:00 UTC), with a loop bringing warm air high up into North America and into the Arctic.

In conclusion, warm air reaching high latitudes is causing the sea ice to melt in a number of ways:
  • Warm air makes the ice melt directly. 
  • Warmer water in rivers warms up the Arctic Ocean. 
  • Wildfires blacken land and sea ice, causing more sunlight to be absorbed, rather than reflected back into space as before.  
[ click on images to enlarge ]
The situation doesn't appear to be improving soon, as illustrated by the image on the right. Following the record high temperatures that hit the world earlier this year, the outlook for the sea ice looks bleak.

Further decline of the snow and ice cover in the Arctic looks set to make a number of feedbacks kick in stronger, with methane releases from the seafloor of the Arctic Ocean looming as a huge danger.

NSIDC scientist Andrew Slater has created the chart below of freezing degree days in 2016 compared to other years at Latitude 80°N. See Andrew's website and this page for more on this.
Below is a comparison of temperatures and emissions for the two locations discussed above. Such fires are becoming increasingly common as temperatures rise, and they can cause release of huge amounts of carbon dioxide, carbon monoxide, methane, sulfur dioxide, soot, etc.

May 3, 2016, at a location north of Fort St John, British Columbia, Canada.
May 4, 2016, near Fort McMurray, Alberta, Canada.
The video below shows methane levels (in parts per billion or ppb) on May 3, 2016, pm, starting at 44,690 ft or 13,621 m and coming down to 5,095 ft or 1,553 m altitude. In magenta-colored areas, methane is above 1950 ppb.


In the video below, Paul Beckwith discusses the situation.


Wildfires are also devastating other parts of the Earth. Below is an image showing wildfires over the Amur River on May 7, 2016.


The image below shows carbon monoxide levels over the Amur River as high as 22,480 ppb on May 9, 2016. Hat tip to Grofu Antoniu for pointing at the CO levels. According to this Sputniknews report, a state of emergency was declared in the Amur Region as fires stretched across 12,200 acres.


The video below shows carbon monoxide emissions in eastern Asia from May 1 to May 26, 2016.

Meanwhile, the National Snow and Ice Data Center (NSIDC) has resumed daily sea ice extent updates with provisional data. The image below is dated May 5, 2016, check here for updates.

As illustrated by the image below, from JAXA, sea ice extent on May 6, 2016, was under 12 million square km, more than 15 days ahead on extent in the year 2012, which was 12 million square km on May 21, 2012.


The situation is dire and calls for comprehensive and effective action as described in the Climate Plan.

Malcolm Light comments:

Most natural processes on the Earth are run by convection including plate tectonics that moves the continental and oceanic plates across the surface of the planet. Mother Earth has been able to hold its atmospheric temperature within certain limits and maintain an ocean for more than 3 billion years because each time there was a build up of carbon dioxide in the atmosphere which produced a global fever, Mother Earth it eliminated the living creatures with a massive Arctic methane firestorm that fried them alive. This giant Arctic methane firestorm is a natural antibiotic the Earth uses to rid itself of those creatures that have overproduced carbon dioxide and caused a global fever.

Essentially mankind has again caused a massive build up of fossil fuel carbon dioxide in the atmosphere and Mother Earth has already started to respond with the predicted massive Arctic methane blow out (since 2010) which will lead to an Earth engulfing firestorm in 5 to 8 years.

The giant fires in the Fort McMurray region are a result of atmospheric methane induced heating of the Arctic and 93.5% global warming of the oceans that has generated a massive El Nino event this year. Hot winds moving away from these high pressure areas have generated high temperatures and massive fires in Alberta which is a giant fever spot on Earth where mankind has produced the maximum amount of dirty fossil fuel extraction and pollution in Canada.

Mother Earth will continue to respond more vigorously with her Arctic methane antibiotic to eliminate the humans from her system as we represent nothing more to her than a larger version of an influenza virus which has seriously retarded her oceanic and atmospheric temperature range functioning systems.

If we do not immediately stop fossil fuel extraction worldwide and control the Arctic methane emission sites we will all be stardust before a decade is past.

Links

• The Threat of Wildfires in the North
http://arctic-news.blogspot.com/2013/06/the-threat-of-wildfires-in-the-north.html

• Smoke Blankets North America

Friday, May 8, 2015

Monthly CO2 Levels Above 400ppm


For the first time since modern records began, monthly mean carbon dioxide levels were above 400 parts per million (ppm), as illustrated by the NOAA image below. NOAA just released the mean global carbon dioxide level for March 2015, which was 400.83 ppm.
Arctic Ocean hit hard

Carbon dioxide concentrations can be especially high, i.e. well over 410 ppm, at higher latitudes of the Northern Hemisphere, as illustrated by the NOAA image below. This can contribute to very high temperature anomalies over the Arctic Ocean and thus increase the risk of huge amounts of methane erupting from the Arctic Ocean seafloor. 
Image contributed by Harold Hensel
Since the start of the Industrial Revolution, carbon dioxide levels have risen non-linearly, as illustrated by the image below.

Need for Comprehensive and Effective Action

As many posts at this blog have warned, emissions by people and the numerous feedbacks are threatening to push Earth into runaway global warming.

This calls for comprehensive and effective action to - among other things - reduce atmospheric carbon dioxide levels back to 280 ppm, as illustrated by the image below and as further discussed at the policies proposed as part of the Climate Plan.


How best to get back to 280 ppm? 

The Climate Plan calls for restoration of greenhouse gas levels in oceans and atmosphere to their long term average by 2100. In the Climate Plan, multiple lines of action are proposed to work simultaneously, in parallel and separately in their implementation, yet complementary in their impact.


One line of action is to cut emissions by 80% by the year 2020. To achieve this, the Climate Plan advocates implementation of local feebates. Especially important are fees on sales of fuel, while the resulting revenues are best used to fund rebates on products sold locally that further help speed up the shift to clean energy.

Without further action, much of the carbon dioxide that has been emitted will stay in the atmosphere for hundreds, if not thousands of years. Therefore, further lines of action are needed, including removal of carbon dioxide from the atmosphere and oceans, with the carbon being safely stored.

For the long term average of 280 ppm to be achieved in 2100, large amounts of atmospheric carbon dioxide must also be removed and safely stored annually. How much must be removed? The period from 2015 to 2100 has 85 years, so bringing down carbon dioxide from 400 ppm to 280 ppm over that period works out to an annual removal of 1.41 ppm. By comparison, this is slightly less than the annual growth in carbon dioxide levels as caused by people since 1959, which is on average 1.47 ppm. Assuming that emissions will not be cut quickly enough to avoid further build up of carbon dioxide in the atmosphere in the near future, annual removal will need to be somewhat more, so 1.47 ppm looks like a good target for now, precisely because it equals past emissions.

The Climate Plan thus proposes that each nation will contribute to the necessary annual 1.47 ppm removal with a share that reflects its past emissions. The image below gives an idea of past emissions. Note that the image only shows emissions up to the year 2011 and that they exclude land use change and forestry emissions. Furthermore, the image shows emissions based on where products were produced. Much of the rise in emissions is the result of products that were produced in Asia, yet many of these products were consumed in Europe and North America. Therefore, graphs based on emissions where products were consumed would paint a somewhat different picture. The Climate Plan proposes that a nation's contributions to carbon dioxide removal (from oceans and atmosphere) will reflect its past emissions based on where products were consumed.


The Climate Plan advocates separate lines of action, i.e. greenhouse gas removal next to emission cuts and further action. Keeping action on different types of pollution separate and calling for local action in each nation further helps avoid that progress elsewhere is pointed at by a nation as an excuse to delay the necessary action on a specific type of pollution in that nation.

As said, the Climate Plan therefore calls for fees to be added on sales of polluting products where they are consumed (as opposed to where they are produced). Each nation is further expected to take steps to contribute its share to the 1.47 ppm carbon dioxide that needs to be removed from the atmosphere annually. Additionally, carbon dioxide needs to be removed from the oceans.

The most important thing each nation can do in the lead-up to the upcoming U.N. climate conference in Paris is to accept these commitments. How each nation and local community does achieve targets is best decided locally, provided that each nation and each local community does indeed reach its targets, and this follows from this commitment.

One reason why local feebates are recommended is that they can focus on achieving local targets for a specific pollutant. Local feebates allow communities to quickly adjust the height of the fees, where a local community threatens to fail reaching a target. Such a local focus does not preclude action being beneficial elsewhere as well. Indeed, the same feebate can work for multiple pollutants and on multiple lines of action. In this sense, locally implemented feebates often work complementary. As an example, the feebates pictured below will help remove carbon dioxide from the atmosphere and oceans, while they will also help cut emissions of carbon dioxide, methane, soot and nitrous oxide.


Further background

- Climate Plan
http://arctic-news.blogspot.com/p/plan.html

- Feebates
http://feebates.blogspot.com/p/feebates.html

- Policies
http://arctic-news.blogspot.com/p/policies.html

- Action
http://arctic-news.blogspot.com/p/action.html


The Climate Plan calls for: - 80% emission cuts by 2020, for each type of pollutant, in each location and best managed...
Posted by Sam Carana on Saturday, May 9, 2015