Carbon dioxide (CO₂) recorded by NOAA was at a record high of 433.24 parts per million (ppm) on April 5, 2026, at Mauna Loa, Hawaii.

The image below illustrates that the daily average for the de-seasonalized global average CO₂ trend was at a record high of 427.5 ppm on April 13, 2026.

The above image shows daily averaged CO₂ through April 13, 2026, from four observatories: Utqiaġvik, formerly known as Barrow, Alaska (in blue), Mauna Loa, Hawaii (in red), American Samoa (in green), and South Pole, Antarctica (in yellow). The thick black lines represent the average of the smoothed seasonal curves and the smoothed, de-seasonalized curves for each of the records. These lines are a very good estimate of the global average levels of CO₂.
The annual maximum for CO₂ is typically reached in May, so the daily average CO₂ looks set to reach even higher levels in May 2026. The image below, from an earlier post, shows that the 2024 global CO₂ concentration increased by 3.77 ppm, the highest annual growth on record.

CO₂ is now higher than it has been for millions of years
The image below, from an earlier post, shows CO₂ over thousands of years through April 1, 2026, when the daily average CO₂ concentration recorded by the Keeling Curve, maintained by Scripps Institution of Oceanography at Mauna Loa Observatory, was 432.81 ppm.

Concentrations of CO₂ haven't been this high for millions of years and they are still increasing rapidly. A recent analysis led by Sarah Shackleton and Julia Marks-Peterson finds that, while the average temperature of the ocean has decreased by 2 to 2.5°C over the past 3 million years, average atmospheric CO₂ levels have likely remained below 300 ppm over this time, as discussed in an earlier post.
This makes the recent daily concentration of 433.24 ppm at Mauna Loa even more threatening. It means that, in addition to the key role of heat-trapping greenhouse gases, there were also important contributions from other components of the climate system such as Earth’s reflectivity, variations in vegetation and/or ice cover and ocean circulation.
According to the IPCC, limiting warming to 2°C would have required global greenhouse gas emissions to have peaked before 2025 at the latest, which hasn't happened. In other words, we're headed for a rise that may exceed 3°C above pre-industrial soon. How fast could such a rise eventuate? The two images and text below are from the earlier post What Does Runaway Warming Look Like?
Forcing caused by the rapid rise in the levels of greenhouse gases is far out of line with current temperatures. A 10°C higher temperature is more in line with these levels, as illustrated by the image below, based on 420,000 years of ice core data from Vostok, Antarctica.

How fast could such a 10°C temperature rise eventuate? The image below gives an idea.
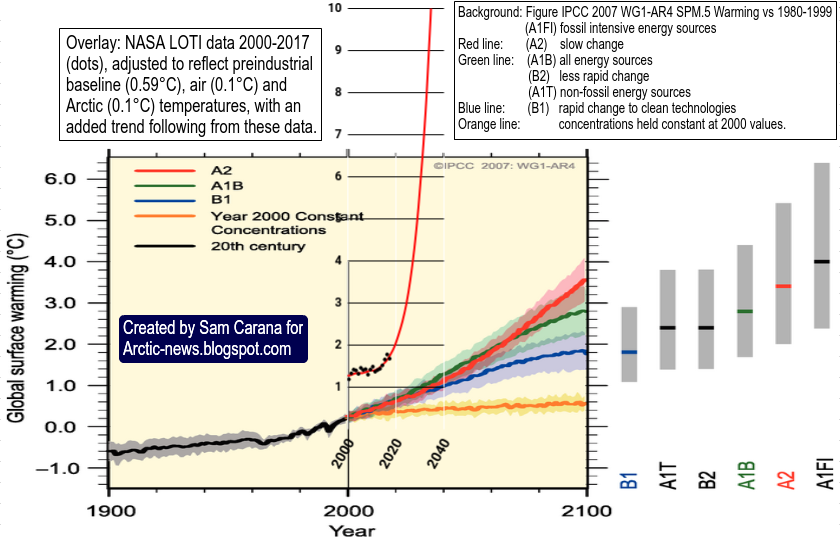
A study led by James Hansen concludes that equilibrium global warming for today’s amount of greenhouse gases is 10°C, which is reduced to 8°C by today’s human-made aerosols, and while James Hansen doesn't expect a 10°C rise soon, he warns that decline of aerosol emissions could increase global warming rapidly, in addition to the acceleration already occurring now.
James Hansen doesn't expect a huge rise to occur soon, as the temperature rise of the atmosphere is slowed by take up of extra energy by oceans, land and ice. According to the IPCC AR6 WG1, 91% of the extra energy is taken up by oceans, 5% by land, 3% by ice melting and 1% remains in the atmosphere.
However, extra energy is increasing as greenhouse gas concentrations keep rising, while additionally the capacity of oceans, land and ice to take up extra energy is increasingly compromised. This could cause a huge rise in temperature soon, especially on land in the Northern Hemisphere where there is proportionally more land. The temperature can be expected to rise even faster during heatwaves and especially in large cities that are additionally affected by the Urban Heat Island effect.
However, extra energy is increasing as greenhouse gas concentrations keep rising, while additionally the capacity of oceans, land and ice to take up extra energy is increasingly compromised. This could cause a huge rise in temperature soon, especially on land in the Northern Hemisphere where there is proportionally more land. The temperature can be expected to rise even faster during heatwaves and especially in large cities that are additionally affected by the Urban Heat Island effect.
How fast could the temperature rise on land in the Northern Hemisphere exceed 3°C?
The image below shows NASA March 2026 Land+Ocean temperature anomalies vs 1951-1980 in °C.

The above image illustrates that the temperature rise comes with polar amplification, as well as distortion of the Jet Stream enabling cold air to move from high latitudes to lower latitudes and resulting in high temperature anomalies in some areas, with anomalies as high as 10.4°C showing up on the map.
Feedbacks in the Arctic and the accelerating rise of Arctic temperatures can be hidden from public discussion by a focus on long-term global or hemispheric averages, as also discussed in earlier posts such as this one. Over the years, temperature anomalies have been highest in the Arctic, as illustrated by the image below.

The image below is adapted from a NASA image with a trend showing change from 1954 to 2025.

The danger is particularly high in the Arctic, where huge amounts of methane are stored in the form of hydrates at the seafloor of the Arctic Ocean and in the form of free gas underneath the hydrates.
The IPCC seeks to downplay the danger of methane eruptions from the seafloor of the Arctic Ocean in many ways, e.g. by a focus on global average temperatures, by using anomalies calculated from a base that isn't pre-industrial and by minimizing the rise to come with projections for future temperatures based on long periods of historical data that are further manipulated by using linear trends to hide recent acceleration and the potential for further acceleration.


The IPCC seeks to downplay the danger of methane eruptions from the seafloor of the Arctic Ocean in many ways, e.g. by a focus on global average temperatures, by using anomalies calculated from a base that isn't pre-industrial and by minimizing the rise to come with projections for future temperatures based on long periods of historical data that are further manipulated by using linear trends to hide recent acceleration and the potential for further acceleration.
The image below, from an earlier post, shows a temperature anomaly forecast for December 2026, with very high anomalies again showing up over most of the Arctic Ocean.

Meanwhile, the surface air temperature in the Southern Hemisphere remains at a record high for the time of year, as illustrated by the image below that shows SH temperatures through April 11, 2026.

The danger looms large that a Double Blue Ocean Event will occur, i.e. not only for Arctic sea ice later this year, but also for Antarctic sea ice early next year, as warned about in posts such as this one and this one that also points out that the IPCC has failed to warn about Antarctic sea ice decline.
Acceleration of the temperature rise is illustrated by the image below, made with NASA Land-Only anomalies vs. 1880-1890 (not pre-industrial) through March 2026.

The image shows land-only data in the Northern Hemisphere through March 2026, with a polynomial trend added that points at 3°C crossed later in 2026. About 0.5°C of the rise can be attributed to El Niño, with further contributions from feedbacks and further forcers. Note that the 1901-2000 base is not pre-industrial, the outlook may be even more dire when using a genuinely pre-industrial base.
At times, areas can be hit by anomalies that strongly exceed 3°C, as illustrated by the image below that shows that the temperature anomaly versus 1951-19880 for the United States in March 2026 was 4.1°C.

The image below, adapted from NOAA, shows ENSO (El Niño-Southern Oscillation) probabilities for the Niño3.4 region (5°N-5°S,120°W-170°W) relative sea surface temperature index, indicating El Niño (red bar) will emerge in the course of 2026.

The bars on the image below, adapted from NOAA, indicate the likely strength of the upcoming El Niño.


The SST on April 16, 2026, was just short of the record high SST of 21.17°C reached in 2024. On April 16, 2026, the SST was 0.47°C higher than it was on January 1, 2026.
A Blue Ocean Event could be declared when Arctic sea ice reaches or crosses a threshold of 1 million km² in extent. However, extent can include holes, gaps or cracks in the sea ice and melt ponds on top of the ice, all having a darker color than ice. By contrast, sea ice area is the total region covered by ice alone, making it a more critical measurement in regard to albedo and the capacity of sea ice to act as a buffer that consumes incoming ocean heat. Accordingly, the critical threshold for a Blue Ocean Event to occur can be said to be 1 million km² in area.
 Following the 2023/2024 El Niño, Arctic sea ice area on March 19, 2025, was 1.34 million km² lower than on March 19, 2012. In March 2025, La Niña conditions were present that continued until recently and in the course of year, the 2025 area grew compared to the 2012 area.
This year, the situation is different. While a NOAA outlook issued April 6, 2026, finds La Niña still to be present, a transition to ENSO-neutral is expected in May 2026, and El Niño is likely to emerge in June-August 2026, with chances of a very strong El Niño increasing over the course of 2026. In other words, a steep increase in temperature can be expected over the next few months.
Latent heat is energy associated with a phase change, such as the energy consumed when ice turns into water. During a phase change, the temperature remains constant. As long as there is ice, additional heat will be absorbed by the process of ice turning into water, so the temperature doesn't rise at the surface.

The screenshot below describes the existential danger for humans.  The screenshot below adds:

Links
• ECMWF - European Centre for Medium-Range Weather Forecasts - El Niño charts
• NASA - Goddard Institute for Space Studies (GISS) Surface Temperature Analysis
https://data.giss.nasa.gov/gistemp
• Rosenstiel School of Marine, Atmospheric, and Earth Science

The above image indicates that anomalies (versus 1880-1890) have been high since 2021, i.e. the rise in temperature has been at or above 1.5°C for each month since 2021 (black squares connected by the black lines). The Lowess 3-year smoothing trend (red line) indicates that the temperature rise accelerated in 2022 and crossed 2°C in 2022, while the trend further indicates that 3°C may get crossed soon on land (where most people live), in 2029 if this trend continues (linear dashed red extension) or even earlier if the trend's rise accelerates further (as illustrated by the image below with a polynomial trend).
The image below illustrates that the upcoming El Niño could trigger a rapid and steep rise in temperature on land in the Northern Hemisphere in the course of 2026.

At times, areas can be hit by anomalies that strongly exceed 3°C, as illustrated by the image below that shows that the temperature anomaly versus 1951-19880 for the United States in March 2026 was 4.1°C.

Strong El Niño on the way
The image below, adapted from NOAA, shows ENSO (El Niño-Southern Oscillation) probabilities for the Niño3.4 region (5°N-5°S,120°W-170°W) relative sea surface temperature index, indicating El Niño (red bar) will emerge in the course of 2026.

The bars on the image below, adapted from NOAA, indicate the likely strength of the upcoming El Niño.

The ECMWF April 2026 forecasts indicate that a very strong El Niño could emerge in the course of 2026, as illustrated by the combination image below.
The combination image below illustrates the rise of sea surface temperature anomalies in the Niño 1+2 region of more than 3°C (from less than -1.5°C to more than 1.5°C) over the past four months.
 |
| [ click on images to enlarge ] |
According to a NOAA outlook issued April 6, 2026, La Niña is still present and a transition from La Niña to ENSO-neutral is expected in the next month, so a steep increase in temperature can be expected to occur over the next few months.

Ocean temperature

A huge amount of heat has accumulated in oceans, as illustrated by the above image, adapted from Rosenstiel School. Much of this ocean heat is on track to move from the ocean to the atmosphere over the next few months, and much ocean heat will also move along the path of ocean currents to the Arctic Ocean, resulting in sea ice decline.
The world (60°S–60°N, 0–360°E) sea surface temperature (SST) was 21.16°C on April 16, 2026, a record high for the time of year and 0.81°C higher than 1982-2010, as illustrated by the image below.

Arctic sea ice decline
A Blue Ocean Event could be declared when Arctic sea ice reaches or crosses a threshold of 1 million km² in extent. However, extent can include holes, gaps or cracks in the sea ice and melt ponds on top of the ice, all having a darker color than ice. By contrast, sea ice area is the total region covered by ice alone, making it a more critical measurement in regard to albedo and the capacity of sea ice to act as a buffer that consumes incoming ocean heat. Accordingly, the critical threshold for a Blue Ocean Event to occur can be said to be 1 million km² in area.
The image below shows Arctic sea ice area over the years, with 2012 highlighted in blue and 2026 highlighted in black. On September 12, 2012, Arctic sea ice area was 2.24 million km². On April 16, 2012, Arctic sea ice area was 13.03 million km². On April 16, 2026, Arctic sea ice area was 11.87 million km², a record low for the time of year and 1.16 million km² lower than it was on April 16, 2012. A Blue Ocean Event could occur in September 2026 if Arctic sea ice area by then would be at least 1.24 million km² lower than it was in 2012.

This year, the situation is different. While a NOAA outlook issued April 6, 2026, finds La Niña still to be present, a transition to ENSO-neutral is expected in May 2026, and El Niño is likely to emerge in June-August 2026, with chances of a very strong El Niño increasing over the course of 2026. In other words, a steep increase in temperature can be expected over the next few months.
Latent heat is energy associated with a phase change, such as the energy consumed when ice turns into water. During a phase change, the temperature remains constant. As long as there is ice, additional heat will be absorbed by the process of ice turning into water, so the temperature doesn't rise at the surface.
The amount of energy absorbed by melting ice is as much as it takes to heat an equivalent mass of water from zero to 80°C. The energy required to melt a volume of ice can raise the temperature of the same volume of rock by as much as 150ºC.

The danger that a Blue Ocean Event will occur in September 2026 is further illustrated by the image below, from an earlier post, showing Arctic sea ice volume in the past 25 years. Markers show April (blue) and September (red) volume, corresponding with the year's maximum and minimum. In 2025, Arctic sea ice reached a record low maximum volume, as well as a record low minimum volume.

As illustrated by the above image, adapted from dmi.dk, Arctic sea ice volume was very low in April 2025, so while relatively little melting took place from April 2025 to September 2025, a record low Arctic sea ice volume was still reached in September 2025. The above image shows Arctic sea ice volume through mid February 2026, with an analysis of the strength of the melting between April (annual maximum) and September (annual minimum) by means of the bars colored magenta (strong melting) and green (little melting).
If the downward trend in annual maxima (blue circles) continues, Arctic sea ice looks set to reach an even lower maximum volume in April 2026. The difference between strong melting (magenta) and little melting (green) is 3000 km³, so if strong melting will take place from April 2026, this may well cause a Blue Ocean Event to occur later in 2026. A Blue Ocean Event could also be said to occur when only 1000 km³ or less Arctic sea ice volume remains. The image below, adapted from dmi.dk, shows that Arctic sea ice volume was at a record low for the time of year on April 17, 2026.

The image below, from an earlier post, illustrates the threat of thinning of Arctic sea ice resulting in increased ocean heat and methane eruptions. Arctic sea ice decline could strongly contribute to the temperature rise, as illustrated by the image below and also discussed in this earlier post.
 |
| [ The Buffer is gone ] |
Human extinction
In 2022, the IPCC said that limiting warming to 2°C would require global greenhouse gas emissions to peak before 2025 at the latest. As discussed in an earlier post, it looks like we have missed the target of limiting the temperature rise to 2°C, while humans are likely to go extinct with a 3°C rise in temperature, yet the IPCC refuses to warn people about the dire situation.


 |
| [ from the 2019 post When Will We Die? ] |
Climate Emergency Declaration
The situation is dire and unacceptably dangerous, and the precautionary principle necessitates rapid, comprehensive and effective action to reduce the damage and to improve the outlook, where needed in combination with a Climate Emergency Declaration, as described in posts such as in this 2022 post and this 2025 post, and as discussed in the Climate Plan group.

• NOAA - Recent Daily Average CO2 at Mauna Loa, Hawaii
• NOAA - Daily global CO2
• NOAA - Climate at a Glance Global Time Series
https://www.ncei.noaa.gov/access/monitoring/climate-at-a-glance/global/time-series/nhem/land/tavg/1/0/1850-2026
discussed on facebook at:
https://www.facebook.com/groups/arcticnews/posts/10164110285804679
discussed on facebook at:
https://www.facebook.com/groups/arcticnews/posts/10164110285804679
• NOAA - El Niño/Southern Oscillation (ENSO) diagnostic discussion
discussed on facebook at:
https://data.giss.nasa.gov/gistemp
• Rosenstiel School of Marine, Atmospheric, and Earth Science
https://isotherm.rsmas.miami.edu/heat/webp/pacific.php
• Danish Meteorological Institute - Arctic sea ice volume and thickness
https://ocean.dmi.dk/arctic/icethickness/thk.uk.php
• Danish Meteorological Institute - Arctic sea ice volume and thickness
https://ocean.dmi.dk/arctic/icethickness/thk.uk.php
• Transforming Society
https://arctic-news.blogspot.com/2022/10/transforming-society.html
https://arctic-news.blogspot.com/2022/10/transforming-society.html
• Climate Plan
https://arctic-news.blogspot.com/p/climateplan.html
https://arctic-news.blogspot.com/p/climateplan.html
• Climate Emergency Declaration
https://arctic-news.blogspot.com/p/climate-emergency-declaration.html
https://arctic-news.blogspot.com/p/climate-emergency-declaration.html