Friday, September 11, 2020

Forest fires cause high emissions in Oregon

The image below shows a forecast of very high carbon monoxide levels in Oregon, as high as 86,299 ppb on September 11, 2020, 21:00 UTC.

The map below shows the location of these peak levels at the red marker.

On September 12, 2020, a horrifying peak level of 126,728 ppb is forecast to occur at that same spot at 21:00 UTC.


As the image below shows, sulfur dioxide levels are forecast to be as high as 5056.4 µg/m³ on September 12, 2020, at 23:00 UTC.


On September 13, 2020, very high carbon dioxide levels are forecast to cover a huge area, with peak levels as high as 82,715 ppb at 07:00 UTC, as the image below shows.


The situation is dire and calls for immediate, comprehensive and effective action, as described in the Climate Plan.


Links

• Climate Plan
https://arctic-news.blogspot.com/p/climateplan.html


Wednesday, September 2, 2020

The unthinkable consequences of global warming

The unthinkable consequences of global warming
by Andrew Glikson

“We’re simply talking about the very life support system of this planet”. Hans Joachim Schellnhuber 2009.

“Burning all fossil fuels would create a different planet than the one that humanity knows. The paleoclimate record and ongoing climate change make it clear that the climate system would be pushed beyond tipping points, setting in motion irreversible changes, including ice sheet disintegration with a continually adjusting shoreline, extermination of a substantial fraction of species on the planet, and increasingly devastating regional climate extremes” and “this equates to 400,000 Hiroshima atomic bombs per day 365 days per yearJames Hansen et al. 2012.

Humanity is fast reaching our moment of truth. What Hansen, Schellnhuber and others have warned us is based on evidence consistent with the basic laws of science, the discipline which, contrary to medieval superstition, is founded on direct observations, calculations and on reason.

Figure 1. The change in state of the planetary climate since the onset of the industrial age in the 17ᵗʰ century.
To elaborate on the nature of the threat humanity and nature are now facing:
A. The rise in greenhouse gas levels (Figure 1) and temperatures at the Earth surface, rising by more than 1°Celsius since 1880, has been underestimated. This is because the temperature values take little account of the masking effects of sulphur dioxide and other aerosols, which transiently mitigates global temperatures by at least ~ -0.5°C. The actual rise could already be as much as 1.5 degrees Celsius, the upper level recommended by the Madrid climate conference. On present trends temperatures will rise to above 2 degrees relative to pre-industrial levels Celsius by 2030. Further temperature rises are likely to be irregular and affected by the flow of ice melt water from melting ice sheets into the oceans by mid-century.

B. The rise in temperature of large ocean regions, with much of the warming occurring to ~800 meter deep levels, reduces the ocean’s ability to absorb CO₂. This means that more CO₂ is trapped in the atmosphere, causing further warming. Also, as ocean temperatures rise, the oceans are depleted in oxygen, which leads to increased production of methane and hydrogen sulphide, which are poisonous to marine life.

C. Models projecting global warming as a linear trajectory, as outlined by the International panel of Climate Change (IPCC), take only limited account of the weakening of climate zone boundaries, as temperatures rise in the polar regions, notably the circum-Arctic jet stream. The weakening of the boundaries allows penetration of warm air masses from the south, as expressed by fires in the Tundra and the Arctic. Conversely, the injection of freezing air masses from the Arctic into North America and Europe (The so-called Beast from the East) provides further evidence for the weakening of the Arctic boundary. These are likely to produce more violent winter storms and heavier snowfalls, forming direct results of global warming. Cooling of large surface areas of the ocean by ice melt water flowing from Greenland and the Antarctica, and accumulation of warmer water in depth, lead to irregular warming trends, with a consequent three-fold rise in extreme weather events (Figure 2), especially where high temperature and cold air masses collide.
Figure 2. The number (bars, left axis), type (colors), and annual cost (right vertical axis) of U.S. billion-dollar disasters from 1980-2018. Running annual cost (grey line), along with the 95% confidence interval, and 5-year average costs (black line).The number and costs of disasters are increasing. Inland flooding (blue bars) and severe storms (green bars) are making in increasingly large contribution to the number of U.S. billion-dollar disasters.  
D. An estimated 1,400 billion tons (400 GTC) of carbon is embedded in the world’s permafrost, mostly in the Arctic and sub-Arctic, from where large amounts of carbon are released under the fast warming conditions. By comparison, the atmosphere presently contains 750 billion tons of carbon. Should a large part of the existing permafrost thaw, Earth could experience dramatic, fast and very dangerous warming. Huge amounts of methane (CH₄), the gas considered responsible for mass extinctions in the history of Earth about 251 million years ago (Permian -Triassic boundary) and 56 million years ago (Paleocene-Eocene boundary), are being released from melting permafrost and Arctic sediments, raising the atmospheric concentration of the gas by more than three-fold (from <600 to 1800 parts per billion) (Figure 3). Temperature rises during the PETM event are estimated as 5 to 8 degrees Celsius. When emitted the warming induced by methane is more than 84 times that of CO₂, declining to 25 times over some 20 years. The release to the atmosphere of a significant part of the stored carbon (permafrost ~900 billion ton carbon [GtC]), peatland 500 GtC and vegetation prone to fires (650 GtC), is sufficient to shift most of the Earth’s climate into a tropical to hyper-tropical state.
Figure 3. Global reserves and growth in the release of methane 1988-2019
E. The 2019-2010 wildfires in Australia have unleashed about 900 million tons of carbon dioxide into the atmosphere, which is equivalent to nearly double the country's total yearly fossil fuel emissions. As the planet warms, wildfires become more frequent and accelerate the warming process.

F. Sea level rise will flood the very regions where civilization has emerged, low river valleys, delta and coastal planes, which are also vital to food production. This is estimated to displace 100 million people initially, and more over time as major coastal cities are flooded.

G. The rising energy levels in warming regions of the Earth, notably tropical island chains such as the Caribbean and the Philippines, generate devastating tropical storms known as cyclones and typhoons. These wreak havoc on coastal regions of southeast North America, India, southern Africa, the Pacific and Australia.

H. Rising heat levels in tropical, subtropical and intermediate Mediterranean climate zones may render large areas unsuitable for agriculture and are physiologically difficult for humans to live in as “heat bulb” conditions set in.
An outline of the migration of climate zones in Australia and the southwestern Pacific is given in Figure 4. Further to NASA’s reported mean land-ocean temperature rise to +1.18°C for March 2020 relative to 1951-1980, large parts of the continents, including Siberia, central Asia, Canada, parts of west Africa, eastern South America and Australia, are warming toward mean temperatures of +2°C and higher. The rate exceeds that of the Last Glacial Termination (LGT) during 21–8 thousand years ago and earlier warming events. These includes the Paleocene-Eocene hyperthermal event (PETM) (about 55.9 million years ago [Ma]) and the Cretaceous-Tertiary boundary (K-T) (64.98 Ma) impact event. The relationships between the global warming rate and the migration of climate zones toward the poles are portrayed in detail on global climate maps (Figure 4).
Figure 4. The migration of the northward into southern Europe. Note the drying up of Spain,
Italy, Greece and Turkey and the increased in precipitation in Northern Europe.
In the 20th century the Earth climate has reached a tipping point, namely a point of no return. Global CO₂ and other greenhouse gases rise have reached a large factor to an order of magnitude higher than those of the past geological and mass extinction events, as have the rate of warming, the shift of climate zones and the rate of extreme weather events (Figure 2). Given the abrupt change in state of the atmosphere-ocean-cryosphere-land system, accelerating since the mid-20ᵗʰ century, the terms “climate change” and “global warming” no longer reflect the extreme scale and rate of these shifts.

Time is running out.


Andrew Glikson
Dr Andrew Glikson
Earth and Paleo-climate scientist
ANU Climate Science Institute
ANU Planetary Science Institute
Canberra, Australia


Books:
The Asteroid Impact Connection of Planetary Evolution
http://www.springer.com/gp/book/9789400763272
The Archaean: Geological and Geochemical Windows into the Early Earth
http://www.springer.com/gp/book/9783319079073
Climate, Fire and Human Evolution: The Deep Time Dimensions of the Anthropocene
http://www.springer.com/gp/book/9783319225111
The Plutocene: Blueprints for a Post-Anthropocene Greenhouse Earth
http://www.springer.com/gp/book/9783319572369
Evolution of the Atmosphere, Fire and the Anthropocene Climate Event Horizon
http://www.springer.com/gp/book/9789400773318
From Stars to Brains: Milestones in the Planetary Evolution of Life and Intelligence
https://www.springer.com/us/book/9783030106027
Asteroids Impacts, Crustal Evolution and Related Mineral Systems with Special Reference to Australia

http://www.springer.com/us/book/9783319745442


Tuesday, August 18, 2020

Methane Hydrates Tipping Point threatens to get crossed

The July 2020 ocean temperature anomaly on the Northern Hemisphere was 1.11°C or 2°F above the 20th century average, the highest July anomaly on record. The yellow circles onthe image below are July data and red circles are data for other months.

The July 2020 ocean temperature anomaly on the Northern Hemisphere was well above the latent heat tipping point of 1°C above the 20th century average, threatening to soon reach the methane hydrates tipping point of 1.35°C above the 20th century average.


These are only two of ten tipping points that are hitting the Arctic, as described in a earlier post, while additionally there are further tipping points that do not specifically hinge on what happens in the Arctic, e.g. the ozone layer is very vulnerable, as described in an earlier post.

The latent heat tipping point

An earlier analysis indicates that the latent heat tipping point gets crossed when ocean temperature anomalies on the Northern Hemisphere get higher than 1°C above the 20th century average. As above image indicates, the tipping point did get crossed temporarily on several occasions in recent years, but this year it looks to have been crossed irreversibly, as indicated by the trend.

[ Record low volume? ]
As the image on the right indicates, there still is sea ice present at the surface of the Arctic Ocean, so there still is sea ice in terms of volume. However, there now is virtually no ice left underneath the surface of the Arctic Ocean to act as a buffer.

In other words, the sea ice has virtually lost its capacity to act as a buffer to consume further heat entering the Arctic Ocean.

Once the latent heat tipping point is crossed, further incoming heat will have to get absorbed by the Arctic Ocean, instead of getting consumed by the melting of sea ice, as was previously the case.

As long as there is sea ice in the water, this sea ice will keep absorbing heat as it melts, so the temperature will not rise at the sea surface and remain at zero°C. The amount of energy that is consumed in the process of melting the ice is as much as it takes to heat an equivalent mass of water from zero°C to 80°C.


Ocean Heat

Meanwhile, global heating continues and more than 90% of global heating is going into oceans.


Arctic sea ice is getting very thin and, at this time of year, it is melting rapidly, due to heat entering the Arctic Ocean from above, from the Atlantic Ocean and the Pacific Ocean, and from rivers that end in the Arctic Ocean.

The two images below shows the difference in sea surface temperatures of the Arctic Ocean, between August 4, 2020, 12 GMT and a forecast for August 22, 2020, 12 GMT. The important difference between the two images is the shrinking of the pale blue area in the Arctic Ocean, where the sea surface temperature is below 0°C, and the increase in areas with other tints of blue where the sea surface temperature is above 0°C.


The image below, from a recent post, shows ocean surface temperatures on August 10, 2020, with very high anomalies showing up where the sea ice has disappeared. The image also shows that the Arctic Ocean in many places is very shallow (right panel).

[ from earlier post ]

The dramatic decline of the sea ice becomes more clear when looking at Arctic sea ice volume. The image below, by Nico Sun, shows volume up to August 31, 2020.


The dramatic decline of the sea ice is even more evident when looking at Arctic sea ice thickness. The image below, by Nico Sun, shows thickness up to August 31, 2020.


Below is a Universität Bremen image showing Arctic sea ice thickness on August 29, 2020.


The navy.mil animation below was run on September 15, 2020, and shows Arctic sea ice thickness over 30 days (last 8 frames are forecasts for September 16 - September 23, 2020).


The image below shows a forecast for September 15, run September 14, 2020. 


The image below shows that, on August 30, 2020, the mean air temperature in the Arctic (80°N to 90°N) was still above the freshwater freezing point (0°C or 32°F or 273.15°K), well above the mean temperature for 1958-2002 and also above the year 2012 which had exceptionally high temperatures in September.


As long as the air temperature remains above the freshwater freezing point, the sea ice will keep melting from above, on top of the melting that occurs from below as a result of ocean heat entering the Arctic Ocean from the Atlantic Ocean and the Pacific Ocean.


Above ads.nipr.ac.jp image shows sea ice in 2020 (red line) still shrinking in extent. Arctic sea ice on September 13, 2020, was 3.55 million km², i.e. well below extent for that date in any other year except for 2012, when extent was as low as 3.18 million km² (on September 15 and 16, 2012). 

According to NSIDC, sea ice extent on September 15, 2020, was 3.737 million km², while extent on September 17, 2012, was 3.387 million km².


The image below, updated by the University of Bremen September 10, 2020, shows Arctic sea ice extent perilously close to 2012 extent. Note that the University of Bremen has meanwhile "reprocessed the data".


On the Northern Hemisphere, ocean temperatures are very high at the moment. The image below illustrates that, showing sea surface temperatures as high as 33.8°C on August 26, 2020. For some time to come, water flowing into the Arctic Ocean from the Atlantic Ocean and the Pacific Ocean will therefore remain higher than it used to be.


River water flowing into the Arctic Ocean also contributes to rising temperatures of the water of the Arctic Ocean.

Furthermore, there are numerous feedbacks, e.g. when black carbon from forest fires settles on sea ice, this causes albedo changes in a self-reinforcing feedback loop, i.e. as less sunlicht gets reflected back up into the sky, more sunlight will be absorbed by the sea ice, speeding up its decline.

As confirmed by a recent study, dramatic abrupt climate change is taking place in the Arctic, and another dangerous feedback of the rising heat is stronger storms, as also discussed in an earlier post.


Stronger storms can bring more moisture into the Arctic. Above image shows a forecast for August 29, 2020, 1200Z, with two cyclones hitting the Arctic Ocean and with 100% relative humidity at the North Pole, at 1000 hPa.


Above image shows a cyclone, forecast for August 25, 2020, with wind north of Greenland as fast as 67 km/h or 41 mph.


Above image shows that rain is forecast to fall over the North Pole on August 26, 202, 12Z.

The image on the right is a forecast for August 26, 2020, 21Z. The image shows strong wind over the North Atlantic, while another cyclone is showing up north of Greenland.

Sea ice is very thin at the moment, so it is vulnerable to get broken up into small small pieces, thus speeding up its melting, as warm water can more easily reach the broken-up pieces from all sides.

Such storms can batter the sea ice, and they can come with rain, further devastating the sea ice by speeding up melting and creating melt-pools on top of the ice with a low albedo.

The image on the right shows a forecast for August 29, 2020. Rain is showing up north of Greenland, as another cyclone is forecast to hit the area. The cyclone is forecast to have strong winds spinning counter-clockwise, thus threatening to speed up the drift of the sea ice north of Greenland toward Fram Strait.

A sequence of cyclones could in a short time push much of the thickest of the remaining sea ice out of the Arctic Ocean through Fram Strait.

The methane hydrates tipping point

As discussed in earlier posts such as this one, the rising temperature of the Arctic Ocean threatens to destabilize methane hydrates contained in sediments at the seafloor of the Arctic Ocean.

As the top image shows, the methane hydrates tipping point could be crossed soon, as the Arctic Ocean is heating up dramatically, which is in part the result of the latent heat tipping point getting crossed, which makes that the temperature of the Arctic Ocean can rise very rapidly.

The methane hydrates tipping point threatens to get crossed as ocean temperature anomalies on the Northern Hemisphere become higher than 1.35°C above the 20th century average, which threatens to occur early next year.

Because the Arctic Ocean in many places is very shallow, heat can quickly reach sediments at the seafloor, which threatens to destabilize methane hydrates. The water of the Arctic Ocean is particularly shallow over the East Siberian Arctic Shelf (ESAS), making that the water there can warm up very quickly during summer heat peaks with heat reaching the seafloor and penetrating cracks in frozen sediments at the seafloor, which can lead to abrupt destabilization of methane hydrates contained in these sediments.

As discussed in an earlier post, the loss of subsurface sea ice is only one of ten tipping points hitting the Arctic. As the temperature of the oceans keeps rising, more heat will reach sediments at the seafloor of the Arctic Ocean that contain vast amounts of methane, as discussed in this page and this post.


Large abrupt methane releases in one spot will quickly deplete the oxygen in shallow waters, making it harder for microbes to break down the methane there, while methane that is rising through waters that are only shallow will also be able to enter the atmosphere very quickly, leaving little time for microbes to break down the methane.

As illustrated by the 2012 image on the right, a large abrupt release of methane from hydrates in the Arctic can have more warming impact than all carbon dioxide emitted by burning of fossil fuel in a year. This is due to the high global warming potential (GWP) of methane following its release.

As this heating is concentrated in the Arctic, it will contribute to further methane releases from hydrates in the Arctic, in another self-reinforcing feedback loop.

The situation is extremely dangerous, given the vast amounts of methane present in sediments in the ESAS and given that there is very little hydroxyl in the air over the Arctic to break down the methane.

[ from earlier post ]

Ominously, the MetOp-1 satellite recorded a peak methane level of 2945 parts per billion (ppb), at 586 mb on the afternoon of August 18, 2020.


Two days later, the MetOp-1 satellite recorded a peak methane level of 2778 ppb, at 469 mb on the afternoon of August 20, 2020, while mean methane levels reached 1907 ppb.


That afternoon, on August 20, 2020, the MetOp-1 satellite recorded an even higher methane level, of 1923 ppb, at 293 mb, i.e. higher up in the atmosphere.


The danger is further illustrated by the image below, posted in February 2019 and showing a potential rise of 18°C or 32.4°F from 1750 by the year 2026.


Indeed, a rise of 18°C could eventuate by 2026, as illustrated by the image below and as discussed in an earlier post.


The situation is dire and calls for immediate, comprehensive and effective action, as described in the Climate Plan.


Links

• NOAA Global Climate Report - July 2020
https://www.ncdc.noaa.gov/sotc/global/202007

• Danish Meteorological Institute - 5 Day Ocean Forecast - Universal (Greenwich) Time
http://ocean.dmi.dk/anim/index.uk.php

• Danish Meteorological Institute - sea ice thickness and volume
http://polarportal.dk/en/sea-ice-and-icebergs/sea-ice-thickness-and-volume

• Danish Meteorological Institute - Arctic temperature
http://ocean.dmi.dk/arctic/meant80n.uk.php

• Danish Meteorological Institute - Arctic sea ice extent
http://ocean.dmi.dk/arctic/icecover.uk.php

• NOAA ocean heat content
https://www.nodc.noaa.gov/OC5/3M_HEAT_CONTENT/index.html

• MetOp satellite - methane
https://www.ospo.noaa.gov/Products/atmosphere/soundings/iasi

• Arctic sea ice - thickness - navy.mil
https://www7320.nrlssc.navy.mil/GLBhycomcice1-12/arctic.html

• Arctic sea ice - thickness - Universität Bremen
https://seaice.uni-bremen.de/databrowser

• Climate reanalyzer - precipitation, wind and pressure forecasts
https://climatereanalyzer.org/wx/fcst/?mdl_id=gfs&dm_id=world-ced&wm_id=prcp-mslp-gph500

• New release: Arctic warming satisfies criteria for abrupt climate change https://www.bjerknes.uib.no/en/article/news/arctic-warming-satisfies-criteria-abrupt-climate-change

• Past perspectives on the present era of abrupt Arctic climate change - by Eystein Jansen et al. https://www.nature.com/articles/s41558-020-0860-7

• Copernicus Atmosphere Monitoring Service
https://atmosphere.copernicus.eu/charts/cams

• Arctic sea ice extent - NSIDC
http://nsidc.org/arcticseaicenews/charctic-interactive-sea-ice-graph

• Arctic sea ice extent - Vishop, Arctic Data archive System, National Institute of Polar Research, Japan
https://ads.nipr.ac.jp/vishop/#/extent

• Arctic sea ice extent - University of Bremen 
https://seaice.uni-bremen.de/data/amsr2/today/extent_n_running_mean_amsr2_previous.png

• North Hole 2020?
https://arctic-news.blogspot.com/2020/08/north-hole-2020.html

• Arctic Hit By Ten Tipping Points
https://arctic-news.blogspot.com/2020/04/arctic-hit-by-ten-tipping-points.html

• Why stronger winds over the North Atlantic are so dangerous
https://arctic-news.blogspot.com/2020/02/why-stronger-winds-over-north-atlantic-are-so-dangerous.html

• Very High Greenhouse Gas Levels
https://arctic-news.blogspot.com/2020/05/very-high-greenhouse-gas-levels.html

• Critical Tipping Point Crossed In July 2019
https://arctic-news.blogspot.com/2019/09/critical-tipping-point-crossed-in-july-2019.html

• Fast Path to Extinction
https://arctic-news.blogspot.com/2020/06/fast-path-to-extinction.html

• Crossing the Paris Agreement thresholds
https://arctic-news.blogspot.com/p/crossing.html

• 2°C crossed
https://arctic-news.blogspot.com/2020/03/2c-crossed.html

• Why America should lead on climate
https://arctic-news.blogspot.com/2016/01/why-america-should-lead-on-climate.html

• Methane's Role in Arctic Warming
https://arctic-news.blogspot.com/2016/02/methanes-role-in-arctic-warming.html

• The Threat
https://arctic-news.blogspot.com/p/threat.html

• When will we die?
https://arctic-news.blogspot.com/2019/06/when-will-we-die.html

• A rise of 18°C or 32.4°F by 2026?
https://arctic-news.blogspot.com/2019/02/a-rise-of-18c-or-324f-by-2026.html

• Most Important Message Ever
https://arctic-news.blogspot.com/2019/07/most-important-message-ever.html

• Climate Plan
https://arctic-news.blogspot.com/p/climateplan.html


Wednesday, August 5, 2020

North Hole 2020?

Will there be open water at the North Pole in August 2020?


Above images show, on the left, sea surface temperatures on August 4, 2020, with a forecast on the right for August 9, 2020.

On the image at the left, the center of the Arctic Basin (pale-blue) still has a sea surface temperature below 0°C (or 32°F).

Around that pale-blue area is a blue area where sea surface temperatures are 0 to 2°C (or 32 to 35.6°F).

Seawater will freeze and stay frozen at about −2 °C (28 °F). The sea surface of the Arctic Ocean contains less salt, so the sea ice will stay frozen longer, even as temperatures rise, but it will melt at 0°C (or 32°F).

As the images show, the blue area where sea surface temperatures are at or above 0°C (or 32°F), is encroaching upon the pale-blue area at the center of the Arctic Basin, and appears to reach the North Pole at August 9, 2020.

Hat-tip to Albert Kallio for pointing at this.

Above combination image shows the running twelve-month averages of global-mean (top) and European-mean (bottom) surface air temperature anomalies relative to 1981-2010, based on monthly values from January 1979 to July 2020.

The shape of current anomalies is very similar to the peak reached around 2016. This in itself is alarming and it is even more alarming since the peak around 2016 was reached under El Niño conditions, whereas the July 2020 temperature was reached under ENSO-neutral conditions, as the image below illustrates.


The image below shows surface temperatures as high as 6.1°C or 42.9°F north of Greenland for August 7, 2020, with wind coming from the south-east.


The image below shows sea surface temperatures as high as 2.2°C or 36°F north of Greenland on August 7, 2020.


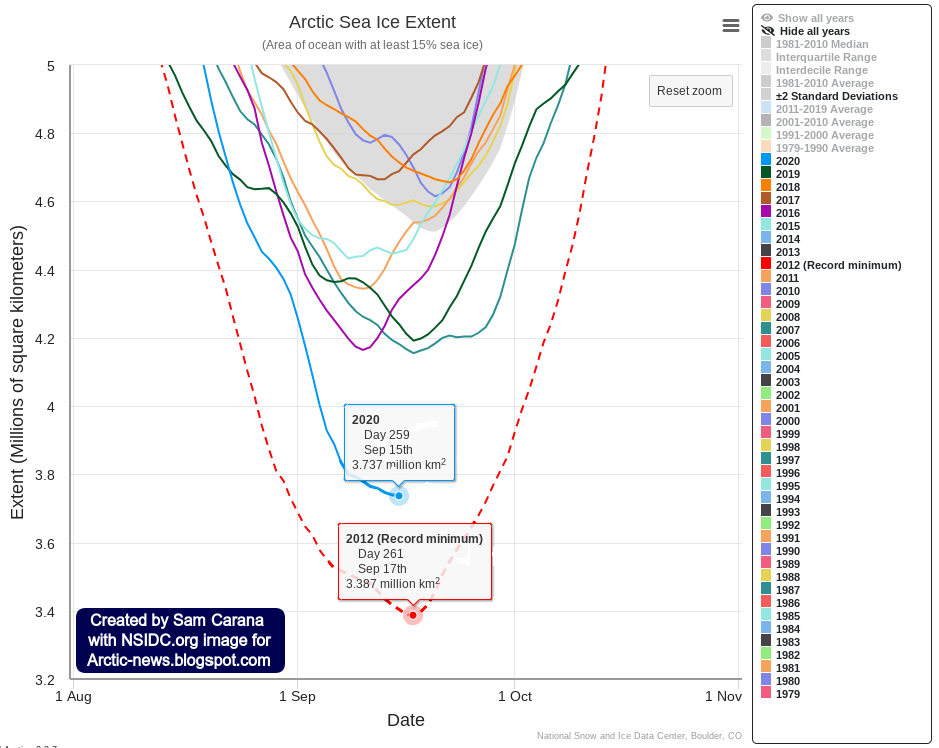
The image below shows Arctic sea ice volume, with the black line showing volume in 2020, up to August 12, 2020.
The dramatic decline of the sea ice becomes even more evident when looking at the fall in thickness. The navy.mil animation below was run on August 11, 2020, and shows sea ice thickness over 30 days (last 8 frames are forecasts for August 12 - August 19, 2020).


16°C (or 60.8°F) at northern tip of Greenland

The temperature was 16°C (or 60.8°F) on August 7, 2020, 10:00 am, at Kap Morris Jesup, at the northern tip of Greenland. The lowest temperature at Kap Morris Jesup over the past few days (i.e. from July 27 Jul 1:00 am — August 11, 1:00 am) was 0°C, i.e. on August 6, 2020, 7:00 pm. The average temperature at Kap Morris Jesup over this period was 8°C (or 46.4°F).

Remember that above 0°C, ice will melt. The water temperature of the Arctic Ocean underneath the sea ice is warmer, and this has been melting the sea ice from below. There still is a (rapidly thinning and shrinking) layer of sea ice at the surface of the Arctic Ocean, because until recently, air temperatures had remained low enough to maintain it, while it also takes time for the ice to melt. As long as there is ice, the heat will be consumed by the process of melting - once the ice is gone, temperatures will rise even more rapidly.

Relative humidity over this period was 69%, which means there was quite a bit of rain as well, further speeding up the melting.

The image below shows the ice at the northern tip of Greenland on August 6, 2020.


The image below shows ocean surface temperatures, with very high anomalies showing up where the sea ice has disappeared.


Above image also shows that the Arctic Ocean in many places is very shallow, which means that heat can quickly reach sediments at the seafloor, threatening to destabilize methane hydrates.

Methane levels are very high at the moment, the MetOp-1 sattelite recorded a mean methane level of 1917 ppb at 293 mb on August 4, 2020 pm, with high methane levels visible over the East Siberian Arctic Shelf (ESAS).
High methane levels were recorded over the Arctic Ocean by the MetOp-1 satellite on the morning of August 8, 2020, at 469 mb.

The situation is dire and calls for immediate, comprehensive and effective action, as described in the Climate Plan.


Links

• Danish Meteorological Institute - 5 Day Ocean Forecast - Universal (Greenwich) Time
http://ocean.dmi.dk/anim/index.uk.php

• Danish Meteorological Institute - sea ice thickness and volume
http://polarportal.dk/en/sea-ice-and-icebergs/sea-ice-thickness-and-volume

• Copernicus - Surface air temperature for July 2020
https://climate.copernicus.eu/surface-air-temperature-july-2020

• NOAA - ENSO: Recent Evolution, Current Status and Predictions - August 3, 2020
https://www.cpc.ncep.noaa.gov/products/analysis_monitoring/lanina/enso_evolution-status-fcsts-web.pdf

• Temperature at Kap Morris Jesup, the northern tip of Greenland
https://www.timeanddate.com/weather/@3421844/historic

• NASA Worldview image of northern tip of Greenland, August 6, 2020