Sunday, June 13, 2021

Could temperatures keep rising?

Orbital changes are responsible for Milankovitch cycles that make Earth move in and out of periods of glaciation, or Ice Ages. Summer insolation on the Northern Hemisphere reached a peak some 10,500 years ago, in line with the Milankovitch cycles, and insolation has since gradually decreased.
Summer insolation on the Northern Hemisphere in red and in langleys
per day (left axis, adapted from Walker, 2008). One langley is 1 cal/cm²
(thermochemical calorie per square centimeter), or 41840 J/m² (joules
per square meter), or about 11.622 Wh/m² (watt-hours per square meter). 
In blue is the mean annual sea surface temperature, given as the difference
from the temperature over the last 1000 years (right axis, from Bova, 2021).

Snow and ice cover acting as a buffer

While temperatures rose rapidly, especially before the insolation peak was reached, the speed at which temperatures rose was moderated by the snow and ice cover, in a number of ways:
  • snow and ice cause sunlight to get reflected back into space
  • energy from sunlight is consumed in the process of melting snow and ice, and thawing permafrost
  • meltwater from sea ice and runoff from melting glaciers and thawing permafrost cools oceans.
In other words, the snow and ice cover acted as a buffer, moderating the temperature rise. While this buffer has declined over time, it is still exercizing this moderation today, be it that the speed at which this buffer is reducing in size is accelerating, as illustrated by the image below, showing the rise of the sea surface temperature on the Northern Hemisphere.

[ from earlier post ]

Will the snow and ice cover ever grow back?

More recently, the temperature rise has been fueled by emissions caused by people. While emission of greenhouse gases did rise strongly since the start of the Industrial Revolution, the rise in emission of greenhouse gases by people had already started some 7,000 years ago with the rise in modern agriculture and associated deforestation, as illustrated by the image below, based on Ruddiman et al. (2015).


The temperature has risen accordingly since those times. At the start of the Industrial Revolution, as the image at the top shows, temperatures already had risen significantly, compared to some 6000 years before the Industrial Revolution started. When also taking into account that the temperature would have fallen naturally (i.e. in the absence of these emissions), the early temperature rise caused by people may well be twice as much.

Temperatures could keep rising for many years, for a number of reasons:
  • Snow & Ice Cover Loss - A 2016 analysis by Ganapolski et al. suggests that even moderate anthropogenic cumulative carbon dioxide emissions would cause an absence of the snow and ice cover in the next Milankovitch cycle, so there would be no buffer at the next peak in insolation, and temperatures would continue to rise, making the absence of snow and ice a permanent loss.
  • Brighter Sun - The sun is now much brighter than it was in the past and keeps getting brighter.
  • Methane - Due to the rapid temperature rise, there is also little or no time for methane to get decomposed. Methane levels will skyrocket, due to fires, due to decomposition of dying vegetation and due to releases from thawing of terrestrial permafrost and from the seafloor as hydrates destabilize.
  • No sequestration - The rapidity of the rise in greenhouse gases and of the associated temperature rise leaves species little or no time to adapt or move, and leaving no time for sequestration of carbon dioxide by plants and by deposits from other species, nor for formation of methane hydrates at the seafloor of oceans.
  • No weathering - The rapidity of the rise also means that weathering doesn't have a chance to make a difference. Rapid heating is dwarfing what weathering can do to reduce carbon dioxide levels. 
  • Oceans and Ozone Layer Loss - With a 3°C rise, many species including humans will likely go extinct. A 2013 post warned that, with a 4°C rise, Earth will enter a moist-greenhouse scenario. A 2018 study by Strona & Bradshaw indicates that most life on Earth would disappear with a 5°C rise. As temperatures kept rising, the ozone layer would disappear and the oceans would keep evaporating and eventually disappear into space, further removing elements and conditions that are essential to sustain life on Earth.

Paris Agreement

All this has implications for the interpretation of the Paris Agreement. At the Paris Agreement, politicians pledged to take efforts to ensure that the temperature will not exceed 1.5°C above pre-industrial levels.

So, what is pre-industrial? To calculate how much the temperature has risen, let's start at 2020 and go back one century. According to NASA data, the temperature difference between 1920 and 2020 is 1.29°C (image below). 


The NASA ocean data are for sea surface temperatures, so another 0.10°C can be added to obtain global air near surface temperatures (2 m). Furthermore, it makes sense to add another 0.10°C for higher polar anomalies. This would bring the temperature rise from 1920 up to 1.49°C.  


Of course, 1920 is not pre-industrial. As the IPCC mentions, the 'pre-' in pre-industrial means 'before', implying that 'pre-industrial' refers to levels as they were in times well befóre (as opposed to when) the Industrial Revolution started.

When taking the rise over the past century and adding 0.30°C for the rise over the previous 170 years, that brings the rise up to 1.79°C (from ≈1750, the start of the Industrial Revolution). Carbon dioxide and methane levels started to rise markedly about 6000 years ago, causing a 0.29°C rise for the years from 3480 BC to 1520 (see image at top). Finally, there will also have been a rise for the years from 1520 to 1750 that, when estimated at 0.20°C, would mean that emissions by people could have caused the temperature to rise by 2.28°C (4.122°F), compared to the temperature some 5500 years ago (see inset on above image).

A huge temperature rise by 2026?

A recent post suggests that the 1.5°C threshold was already crossed in 2012, i.e. well before the Paris Agreement was adopted by the U.N. (in 2015), while there could be a temperature rise of more than 3°C by 2026.

Such a rise could be facilitated by a number of events and developments, including:

[ from earlier post see CH4 GWP]
• The Arctic sea ice latent heat tipping point and the seafloor methane hydrates tipping point look set to get crossed soon (see above image).

• Continued emissions. Politicians are still refusing to take effective action, even as greenhouse gas emissions appear to be accelerating. The warming impact of carbon dioxide reaches its peak a decade after emission, while methane's impact over a few years is huge.

• Sunspots. We're currently at a low point in the sunspot cycle. As the image on the right shows, the number of sunspots can be expected to rise as we head toward 2026, and temperatures can be expected to rise accordingly. According to James Hansen et al., the variation of solar irradiance from solar minimum to solar maximum is of the order of 0.25 W/m⁻².

• Temperatures are currently also suppressed by sulfate cooling, and their impact is falling away as we progress with the necessary transition away from fossil fuel and biofuel, toward the use of more wind turbines and solar panels instead. Aerosols typically fall out of the atmosphere within a few weeks, so as the transition progresses, this will cause temperatures to rise over the next few years.

• El Niño events, according to NASA, occur roughly every two to seven years. As temperatures keep rising, ever more frequent strong El Niño events are likely to occur. NOAA anticipates the current La Niña to continue for a while, so it's likely that a strong El Niño will occur between 2023 and 2025.

• Rising temperatures can cause growth in sources of greenhouse gases and a decrease in sinks, as discussed in an earlier post.

The mass extinction event that we are currently in is rapidly progressing, even faster than the Great Permo-Triassic Extinction, some 250 million years ago, when the temperature rose to about 28°C, i.e. some 14.5°C higher than pre-industrial.

In the video below, Guy McPherson discusses the current mass extinction.


In the video below, Ye Tao introduces and discusses the MEER ReflEction idea.


In conclusion, there could be a huge temperature rise by 2026 and with a 3°C rise, humans will likely go extinct, which is a daunting prospect. Even so, the right thing to do is to help avoid the worst things from happening, through comprehensive and effective action as described in the Climate Plan.


Links

• Climate change and ecosystem response in the northern Columbia River basin - A paleoenvironmental perspective - by Ian R. Walker and Marlow G. Pellat (2008)
https://cdnsciencepub.com/doi/10.1139/A08-004

• Vance, R.E. 1987. "Meteorological Records of Historic Droughts as Climatic Analogues for the Holocene." In N.A. McKinnon and G.S.L. Stuart (eds), Man and the Mid-Holocene Climatic Optimum - Proceedings of the Seventeenth Annual Conference of the Archaeological Association of the University of Calgary. The University of Calgary Archaeological Association, Calgary: 17-32.

• Seasonal origin of the thermal maxima at the Holocene and the last interglacial - by Samantha Bova et al. (2021)
https://www.nature.com/articles/s41586-020-03155-x

• Palaeoclimate puzzle explained by seasonal variation (2021)
https://www.nature.com/articles/d41586-021-00115-x

• Important Climate Change Mystery Solved by Scientists (news release 2021)
https://www.rutgers.edu/news/important-climate-change-mystery-solved-scientists

• Milankovitch (Orbital) Cycles and Their Role in Earth's Climate - by Alan Buis (NASA news, 2020)
https://climate.nasa.gov/news/2948/milankovitch-orbital-cycles-and-their-role-in-earths-climate

• Milankovitch cycles - Wikipedia
https://en.wikipedia.org/wiki/Milankovitch_cycles

• Insolation changes
https://energyeducation.ca/encyclopedia/Insolation
http://www.geo.umass.edu/faculty/bradley/bradley2003x.pdf

• Late Holocene climate: Natural or anthropogenic? - by William Ruddiman et al. (2015)
https://agupubs.onlinelibrary.wiley.com/doi/full/10.1002/2015RG000503

• Critical insolation–CO2 relation for diagnosing past and future glacial inception - by Andrey Ganapolski et al. (2016)
https://www.nature.com/articles/nature16494

• Co-extinctions annihilate planetary life during extreme environmental change - by Giovanni Strona & Corey Bradshaw (2018)

• Earth is on the edge of runaway warming
https://arctic-news.blogspot.com/2013/04/earth-is-on-the-edge-of-runaway-warming.html

• Paris Agreement
https://unfccc.int/process-and-meetings/the-paris-agreement/the-paris-agreement
https://unfccc.int/sites/default/files/english_paris_agreement.pdf

• IPCC Special Report: Global warming of 1.5 ºC — Box SPM.1: Core Concepts 
https://www.ipcc.ch/sr15/chapter/spm/

• IPCC AR5 Synthesis Report — Figure 2.8
https://www.ipcc.ch/report/ar5/syr/synthesis-report

• IPCC AR5 Report, Summary For Policymakers
https://www.ipcc.ch/site/assets/uploads/2018/02/WG1AR5_SPM_FINAL.pdf

• NASA Analysis Graphs and Plots - LSAT and SST change

• Most Important Message Ever
https://arctic-news.blogspot.com/2019/07/most-important-message-ever.html

• Radiative forcing of carbon dioxide, methane, and nitrous oxide: A significant revision of the methane radiative forcing - by M. Etminan et al.
https://agupubs.onlinelibrary.wiley.com/doi/full/10.1002/2016GL071930

• When Will We Die?
https://arctic-news.blogspot.com/2019/06/when-will-we-die.html

• Possible climate transitions from breakup of stratocumulus decks under greenhouse warming - by Tapio Schneider et al.
https://www.nature.com/articles/s41561-019-0310-1

• A World Without Clouds
https://www.quantamagazine.org/cloud-loss-could-add-8-degrees-to-global-warming-20190225

• How close are we to the temperature tipping point of the terrestrial biosphere? - by Katharyn Duffy et al.

• What Carbon Budget?


Thursday, June 3, 2021

Greenhouse gas levels keep rising at accelerating rates

At the Paris Agreement in 2015, politicians pledged to limit the global temperature rise from pre-industrial levels to 1.5°C and promised to stop rises in greenhouse gas emissions as soon as possible and to make rapid reductions in accordance with best available science, to achieve a balance between people's emissions by sources and removals by sinks of greenhouse gases in the second half of this century. 

Yet, greenhouse gas levels keep rising and the rise appears to be accelerating. 

Carbon Dioxide

The annual mean global growth rate of carbon dioxide (CO₂) has been increasing over the years (see above image). The February 2021 global CO₂ level was 2.96 ppm higher than the February 2020 global CO₂ level (image left).
The March 2021 global CO₂ level was 2.89 ppm higher than the March 2020 global CO₂ level (image left), again much higher than the average annual growth rate over the past decade. No discernible signal in the data was caused by restrictions associated with the COVID-19 pandemic.

More recent values are available for Mauna Loa, Hawaii. As the image on the right shows, the monthly average CO₂ level at Mauna Loa was 419.13 ppm for May 2021, while the weekly average was as high as 420.01 ppm (for the week ending at May 1, 2021). 

On April 8, 2021, CO₂ levels at Mauna Loa, Hawaii, reached a level of 421.36 ppm, while several hourly averages recorded in early April were approaching 422 ppm (see earlier post).

According to NOAA, the atmospheric burden of CO₂ is now comparable to where it was during the Pliocene Climatic Optimum, between 4.1 and 4.5 million years ago, when CO₂ was close to, or above 400 ppm. During that time, the average temperature was about 4°C (7°F) higher than in pre-industrial times, and sea level was about 24 m (78 feet) higher than today.

Methane
 
The 2020 global annual methane (CH₄) growth rate of 15.85 ppb was the highest on record. The global CH₄ level in January 2021 was 1893.4 ppb, 20 ppb higher than the January 2020 level. 

The image at the top shows a trend indicating that CH₄ could reach a level of 4000 ppb in 2026, which at a 1-year GWP of 200 translates into 800 ppm CO₂e, so just adding this to the current CO₂ level would cause the Clouds Tipping Point at 1200 CO₂e to be crossed, which in itself could raise global temperatures by 8°C, as described in an earlier post

Nitrous Oxide

The 2020 global annual nitrous oxide (N₂O) growth rate of 1.33 ppb was the highest on record. The global N₂O level in January 2021 was 333.9 ppb, 1.4 ppb higher than the January 2020 level. 

Greenhouse gas levels are accelerating, despite promises by politicians to make dramatic cuts in emissions. As it turns out, politicians have not taken the action they promised they would take. 

Of course, when also adding nitrous oxide, the Clouds Tipping Point can get crossed even earlier.

Elements contributing to temperature rise

Next to rising greenhouse gas levels, there are further elements that can contribute to a huge temperature rise soon. 


As illustrated by above image by Nico Sun, the accumulation of energy going into melting the sea ice is at record high for the time of year. 


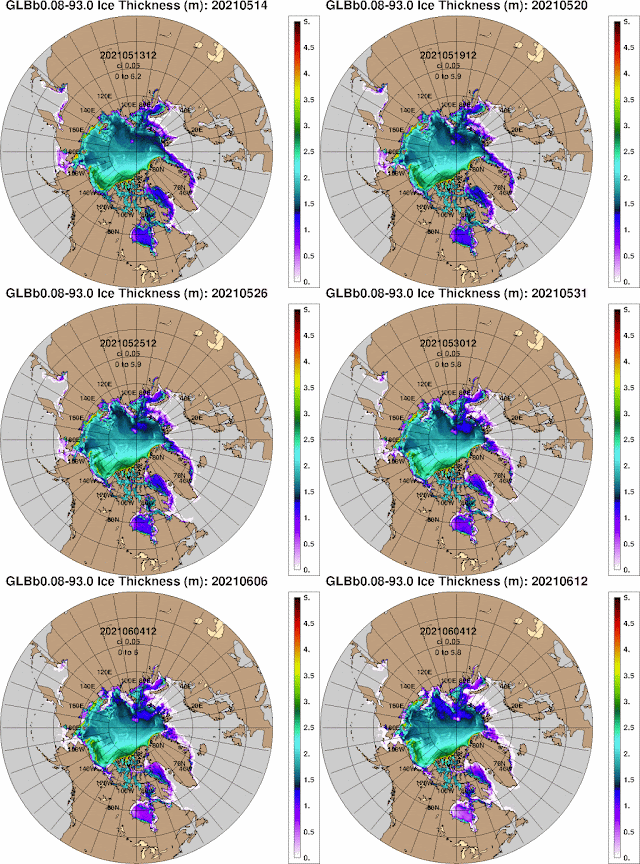
As illustrated by above combination image, the thickness of the sea ice is now substantially less than it used to be. The image compares June 1, 2021 (left), with June 1, 2015 (right). 

The animation on the right shows that sea ice is getting rapidly thinner, indicating that the buffer constituted by the sea ice underneath the surface is almost gone, meaning that further heat entering the Arctic Ocean will strongly heat up the water.

As described in an earlier post, this can destabilizate methane hydrates in sediments at the seafloor of the Arctic Ocean, resulting in eruption of methane from these hydrates and from methane that is located in the form of free gas underneath such hydrates. 

Such methane eruptions will first of all heat up the Arctic, resulting in loss of Arctic sea ice's ability to reflect sunlight back into space (albedo feedback), in disappearing glaciers and in rapidly thawing terrestrial permafrost (and the associated release of greenhouse gases).

The Snowball Effect


Temperatures are rising and they are rising at accelerating pace, especially in the Arctic. A strong El Niño and a distortion in the jet stream could cause the latent heat and methane hydrates tipping points to be crossed soon, causing many feedbacks to kick in with ever greater ferocity, and pushing up the global temperature beyond 3°C, 4°C and 5°C above pre-industrial, like a snowball that keeps growing in size while picking up ever more snow, as it is racing down a very steep slope.

Crossing of tipping points and further events and developments can combine with feedbacks into a snowball effect of rapidly rising temperatures.

Feedbacks include changes to the Jet Stream that result in ever more extreme weather events such as storms and forest fires. Such events can cause huge emissions of greenhouse gases. 

Temperatures can also be expected to rise over the next few years as sulfate cooling decreases. Aerosols can further cause additional warming if more black carbon and brown carbon gets emitted due to more wood getting burned and more forest fires taking place. Black carbon and brown carbon have a net warming effect and can settle on snow and ice and speed up their decline.

Therefore, the 8°C rise as a result of crossing the Clouds Tipping Point would come on top of the warming due to other elements, and the total rise could be as high as 18°C or 32.4°F from preindustrial, as ilustrated by the image on the right, from an earlier post.

Very high sea surface temperature anomalies

Meanwhile, sea surface temperatures on the Northern Hemisphere keep rising. The image below shows that sea surface temperature anomalies off the North American east coast (at the green circle) were as high as as 13.7°C (24.7°F) on June 3, 2021.


More heat is flowing from the tropics along the North American east coast toward the Arctic Ocean, carried by the Gulf Stream, as illustrated by the image on the right. 

In conclusion, there could be a huge temperature rise by 2026. 

At a 3°C rise, humans will likely go extinct, making it from some perspectives futile to speculate about what will happen beyond 2026. 

Even so, the right thing to do is to help avoid the worst things from happening, through comprehensive and effective action as described in the Climate Plan.


• NOAA: Trends in Greenhouse gases
https://gml.noaa.gov/ccgg/trends

• NOAA: Carbon dioxide peaks near 420 parts per million at Mauna Loa observatory

• Overshoot or Omnicide?
• Cryosphere Computing - by Nico Sun
https://cryospherecomputing.tk

• Arctic Ocean invaded by hot, salty water

• Most Important Message Ever
https://arctic-news.blogspot.com/2019/07/most-important-message-ever.html


Sunday, May 30, 2021

Methane and the mass extinction of species

by Andrew Glikson

“The smart way to keep people passive and obedient is to strictly limit the spectrum of acceptable opinion, but allow very lively debate within that spectrum.” Noam Chomsky (1998).

The level of atmospheric methane, a poisonous gas considered responsible for major mass extinction events in the past, has nearly tripled during the 20-21st centuries, from ~722 ppb (parts per billion) to above ~1866 ppb, currently reinforced by coal seam gas (CSG) emissions. As the concentration of atmospheric methane from thawing Arctic permafrost, from Arctic sediments and from marshlands worldwide is rising, the hydrocarbon industry, subsidized by governments, is progressively enhancing global warming by extracting coal seam gas in defiance of every international agreement.

Methane (CH₄), a powerful greenhouse gas ~80 times the radiative power of carbon dioxide (CO₂) when fresh, sourced in from anaerobic decomposition in wetlands, rice fields, emission from animals, fermentation, animal waste, biomass burning, charcoal combustion and anaerobic decomposition of organic waste, is enriched by melting of leaking permafrost, leaks from sediments of the continental shelf (Figure 1) and extraction as coal seam gas (CSG). The addition to the atmosphere of even a part of the estimated 1,400 billion tons of carbon (GtC) from Arctic permafrost would destine the Earth to temperatures higher than 4 degrees Celsius and thereby demise of the biosphere life support systems.


During the last and present centuries, global methane concentrations have risen from approximately ~700 parts per billion (ppb) to near-1900 ppb, an increase by a factor of ~2.7, the highest rate in the last 800,000 years.


Since the onset of the Industrial age global emissions of carbon have reached near-600 billion tonnes of carbon (>2100 billion tonnes CO₂) at a rate faster than during the demise of dinosaurs. According to research published in Nature Geoscience, CO₂ is being added to the atmosphere at least ten times faster than during a major warming event about 55 million years ago.

Australia, possessing an abundance of natural gas, namely methane resources, is on track to become the world's largest exporter. Leaks from hydraulic fracturing (fracking) production wells, transport and residues of combustion are bound to contribute significantly to atmospheric methane. However, despite economic objections, not to mention accelerating global warming, natural gas from coal seam gas, liquefied to -161°C, is favored by the government for domestic use as well as exported around the world.

In the Hunter Valley, NSW, release of methane from open-cut coal mining reached above 3000 ppb. In the US methane released in some coal seam gas fields constitutes between 2 and 17 per cent of the emissions.

While natural gas typically emits between 50 and 60 percent less CO₂ than coal when burned, the drilling and extraction of natural gas from wells, fugitive emissions, leaks from transportation in pipelines result in enrichment of the atmosphere in methane, the main component of natural gas, 34 times stronger than CO₂ at trapping heat over a 100-year period and 86 times stronger over 20 years. So, while natural gas when burned emits less CO₂ than coal, that doesn’t mean that it’s clean – the reason summed up in one word: methane.

Global warming triggered by the massive release of CO₂ may be catastrophic, but release of CH₄ from methane hydrates may be apocalyptic. According to Brand et al. (2016), the release of methane from permafrost and shelf sediment has constituted the ultimate source and cause for the dramatic life-changing global warming. The mass extinction at the end of the Permian 251 million years ago, when 96 percent of species was lost, holds an important lesson for humanity regarding greenhouse gas emissions, global warming, and the life support system of the planet (Brand et al. 2016, Methane Hydrate: Killer cause of Earth's greatest mass extinction).

The pledge for zero-emissions by 2050 is questioned as governments continue to subsidize, mine and export hydrocarbons. Examples include Saudi-Arabia, the Gulf States, Russia, Norway and Australia. A mostly compliant media highlights a zero-emission pledge, but is reluctant to report the scale of exported emissions as well as the ultimate consequences of the open-ended rise of global temperatures.

Norway, a country committed to domestic clean energy, is conducting large scale drilling for Atlantic and Arctic oil. Australia, the fourth-largest producer of coal, with 6.9% of global production, is the biggest net exporter, with 32% of global exports in 2016. 23 new coal projects are proposed n the Hunter Valley, NSW, with a production capacity equivalent to 15 Adani-sized mines.

Australian electricity generation is dominated by fossil fuel and about 17% renewable energy. Fossil fuel subsidies hit $10.3 billion in 2020-21, about twice the investment in solar energy in 2019-2020. State Governments spent $1.2 billion subsidizing exploration, refurbishing coal ports, railways and power stations and funding “clean coal” research, ignoring the pledge for “zero emissions by 2050”.

The pledge overlooks the global amplifying effects of cumulative greenhouse gases. At the current rate of emissions, atmospheric CO₂ levels would be near 500 ppm CO₂ by 2050, generating warming of the oceans (expelling CO₂), decreased albedo due to melting of ice, release of methane, desiccated vegetation and extensive fires.

Claims of “clean coal”, “clean gas” and “clean hydrogen” ignore the contribution of these methods to the rise in greenhouse gases. Coal seam gas has become an additional source of methane which has an 80 times more powerful greenhouse effect than CO₂. This adds to the methane leaked from Arctic permafrost, with atmospheric methane rising from ~ 600 parts per billion early last century to higher than 2000 ppb. In the Hunter Valley, NSW, release of methane from open-cut coal mining reached above 3000 ppb. In the US, methane released in some coal seam gas fields constitutes between 2 and 17 per cent of the emissions.

The critical index of global warming, rarely mentioned by politicians or the media, is the atmospheric concentration of CO₂. During 2020-2021 CO₂ rose from 416.45 to 419.05 parts per million at a rate of 2.6 ppm/year, a trend unprecedented in the geological record of the last 55 million years. The combined effects of greenhouse gases such as cabon dioxide (CO₂), methane (CH₄) and nitrous oxide (N₂O) have reached near ~500 ppm CO2-equivalent.

Since 1880, the world has warmed by 1.09 degrees Celsius on average, near ~1.5°C on the continents and ~2.2°C in the Arctic, with the five warmest years on record during 2015-2020. Since the 1980s, the wildfire season has lengthened across a quarter of the world's vegetated surface. As extensive parts of Earth are burning, “forever wars” keep looming. 

It is not clear how tracking toward +4 degrees Celsius by the end of the century can be arrested. A level of +4°C above pre-industrial temperature endangers the very life support systems of the planet. The geological record indicates past global heating events on a scale and rate analogous to the present have led to mass extinctions of species. According to Professor Will Steffen, Australia’s top climate scientist “we are already deep into the trajectory towards collapse”. While many scientists are discouraged by the extreme rate of global heating, it is left to a heroic young girl to warn the world of the greatest calamity since a large asteroid impacted Earth some 66 million years ago.


Andrew Glikson
A/Prof. Andrew Glikson

Earth and Paleo-climate scientist
The University of New South Wales,
Kensington NSW 2052 Australia


Books:
The Asteroid Impact Connection of Planetary Evolution
http://www.springer.com/gp/book/9789400763272
The Archaean: Geological and Geochemical Windows into the Early Earth
http://www.springer.com/gp/book/9783319079073
Climate, Fire and Human Evolution: The Deep Time Dimensions of the Anthropocene
http://www.springer.com/gp/book/9783319225111
The Plutocene: Blueprints for a Post-Anthropocene Greenhouse Earth
http://www.springer.com/gp/book/9783319572369
Evolution of the Atmosphere, Fire and the Anthropocene Climate Event Horizon
http://www.springer.com/gp/book/9789400773318
From Stars to Brains: Milestones in the Planetary Evolution of Life and Intelligence
https://www.springer.com/us/book/9783030106027
Asteroids Impacts, Crustal Evolution and Related Mineral Systems with Special Reference to Australia
http://www.springer.com/us/book/9783319745442
The Event Horizon: Homo Prometheus and the Climate Catastrophe
https://www.springer.com/gp/book/9783030547332


Saturday, May 22, 2021

Arctic Ocean invaded by hot, salty water


Sea surface temperatures on the Northern Hemisphere have been rising dramatically over the years, as illustrated by above image, indicating that the latent heat tipping point is getting crossed, while the methane hydrates tipping point could get crossed soon, depending on developments.

At the moment, the surface temperature of most of the Arctic ocean's is still below 0°C.

Heat is entering the Arctic Ocean from the south, as illustrated by the image on the right. Hot, salty water is entering the Arctic Ocean from the Atlantic Ocean as currents dive underneath the ice, causing the ice to melt from below. 
[ click on images to enlarge ]

The image on the right, from the NSIDC article A step in our Spring, compares sea ice age between March 12 to 18 for the years 1985 (a) and 2021 (b).

The bottom graph (c) shows a time series from 1985 to 2021 of percent ice coverage of the Arctic Ocean domain. The Arctic Ocean domain is depicted in the inset map with purple shading.

At the end of the ice growth season in mid-March, 73.3% of the Arctic Ocean domain was covered by first-year ice, while 3.5% was covered by ice 4+ years old. 

This compares to 70.6% and 4.4% respectively in March 2020.

In March 1985, near the beginning of the ice age record, the Arctic Ocean region was comprised of nearly equal amounts of first-year ice (39.3%) and 4+ year-old ice (30.6%).

Sea ice that hasn't yet survived a summer melt season is referred to as first-year ice. This thin, new ice is vulnerable to melt and disintegration in stormy conditions. Ice that survives a summer melt season can grow thicker and less salty, since snow that thickens the ice contains little salt. Thickness and salt content determine the resistance of the ice to melt. Multiyear ice is more likely to survive temperatures that would melt first-year ice, and to survive waves and winds that would break up first-year ice.

The image on the right shows a forecast of the thickness of the sea ice, run on May 20, 2021 and valid for May 21, 2021. 

An area is visible north of Severnaya Zemlya toward the North Pole where thickness is getting very thin, while there is one spot where the ice has virtually disappeared. 

The spot is likely a melting iceberg, the animation on the right shows that the spot has been there for quite a few days, while the freshwater in this spot appears to result from melting amid salty water. 

Overall, sea ice is getting very thin, indicating that the buffer constituted by the sea ice underneath the surface is almost gone, meaning that further heat entering the Arctic Ocean will strongly heat up the water. 

As the animation underneath on the right shows, freshwater is entering the Arctic Ocean due to runoff from land, i.e. rainwater from rivers, meltwater from glaciers and groundwater runoff from thawing permafrost. 

At the same time, very salty water is entering the Arctic Ocean from the Atlantic Ocean. 

The map below shows how salty and hot water from the Atlantic Ocean enters the Arctic Ocean along two currents, flowing on each side of Svalbard, and meeting at this area north of Severnaya Zemlya where thickness is getting very low. 

The blue color on the map indicates depth (see scale underneath). 

The image below, by Malcolm Light and based on Max & Lowrie (1993), from a recent post, shows vulnerable Arctic Ocean slope and deep water methane hydrates zones below 300 m depth. 

Malcolm Light indicates three areas: 
Area 1. Methane hydrates on the slope;
Area 2. Methane hydrates on the abyssal plane; 
Area 3. Methane hydrates associated with the spreading Gakkel Ridge hydro-thermal activity (the Gakkel Riidge runs in between the northern tip of Greenland and the Laptev Sea). 


The freezing point of freshwater is 0°C or 32°F. For salty water, the freezing point is -2°C or 28.4°F.

During April 2021, sea ice was about 160 cm thick.

In June and July 2021, thickness will fall rapidly, as illustrated by the image on the right by Nico Sun. 

Sea ice acts as a buffer, by consuming energy in the process of melting, thus avoiding that this energy causes a temperature rise of the water. 

As long as there is sea ice in the water, this sea ice will keep absorbing heat as it melts, so the temperature will not rise at the sea surface and remain at zero°C. The amount of energy that is consumed in the process of melting the ice is as much as it takes to heat an equivalent mass of water from zero°C to 80°C.

The accumulated ice melt energy until now is the highest on record, as illustrated by the image on the right, by Nico Sun.

The image below further illustrate the danger. As the temperature of the water keeps rising, more heat will reach sediments at the seafloor of the Arctic Ocean that contain vast amounts of methane, as discussed at this page and in this post.

Ominously, methane levels reached a peak of 2901 ppb at 469 mb on May 13, 2021. 

Research

In the extract of a 2008 paper, Natalia Shakhova et al. conclude: ". . we consider release of up to 50 Gt of predicted amount of hydrate storage as highly possible for abrupt release at any time."


The video below contains excerpts from Nick Breeze's interview with Natalia Shakhova at the European Geophysical Union in Vienna, 2012, on the likelihood and timeframe of a large methane release from the seafloor of the Arctic Ocean. 

Natalia Shakhova: "The total amount of methane in the atmosphere is about 5Gt. The amount of carbon in the form of methane in this Arctic shelf is - approximately - from hundreds to thousands Gt and, of course, only 1% of [such an] amount is required to double the atmospheric burden of methane."

"But to destabilize 1% of this carbon pool, I think, not much effort is needed, considering the state of the permafrost and the amount of methane involved, because what divides the methane from the atmosphere is a very shallow water column and the weakening permafrost, which is losing its ability to seal, to serve as a seal, and this is, I think, not a matter of thousands of years, it's a matter of decades, at most hundred years." 

(Natalia talks with Igor Semiletov)
Natalia Shakhova: "Just because this area is seismically and tectonically active, and there was some investigation that the tectonic activity was increasing, and the seismic activity, the destabiliation of the ground, just mechanical forcing destabiliation [may suffice to act as] additional pathway for this methane to escape. There are many factors that are very convincing for us [to conclude] that it might happen."

Elaborating on the timeframe.
Natalia Shakhova: "Not any time, any time sounds like it might happen today, it might happen tomorrow, the day after tomorrow . . " 
Igor Simelitov: "It might!"


The image below was created with content from a 2019 paper by Natalia Shakhova et al. It concludes that methane releases could potentially increase by 3-5 orders of magnitude, considering the sheer amount of methane preserved within the shallow East Siberian Arctic Shelf seabed deposits and the documented thawing rates of subsea permafrost reported recently.

In a 2021 paper by researchers from Europe, Russia and the U.S., results from field research are published showing that methane is getting released from locations deep below the submarine permafrost. Lead author, Julia Steinbach, from Stockholm University, says: “The permafrost is a closed lid over the seafloor that’s keeping everything in place. And now we have holes in this lid.” 

In the video below, Nick Breeze interviews Igor Semiletov on methane plumes detected during this 2020 field research over the East Siberian Arctic Shelf (ESAS).


In the video below, Nick Breeze interviews Örjan Gustafsson on field research on methane in the East Siberian Arctic Shelf (ESAS)


In the video below, Peter Wadhams analyses the threat of Arctic methane releases.


In the video below, Guy McPherson discusses the situation.


In conclusion, temperatures could rise dramatically soon. A 3°C will likely suffice for humans to go extinct, making it in many respects rather futile to speculate about what will happen in the longer term. On the other hand, the right thing to do is to help avoid the worst things from happening, through comprehensive and effective action as described in the Climate Plan.

Links

• NOAA Climate at a Glance

• Danish Meteorological Institute - Arctic temperature
http://ocean.dmi.dk/arctic/meant80n.uk.php

• Freezing point of water - Climate Change: Arctic sea ice

• Arctic surface temperature

• NSIDC: A step in our Spring, image credit: T. Tschudi, University of Colorado, and W. Meier and J.S. Stewart, National Snow and Ice Data Center/Image by W. Meier

• Arctic sea ice - thickness and salinity - navy.mil
https://www7320.nrlssc.navy.mil/GLBhycomcice1-12/arctic.html

• CryosphereComputing - by Nico Sun
https://cryospherecomputing.tk

• A 4.5 km resolution Arctic Ocean simulation with the global multi-resolution model FESOM 1.4 - by Qiang Wang et al. 

• Max, M.D. & Lowrie, A. 1993. Natural gas hydrates: Arctic and Nordic Sea potential. In: Vorren, T.O., Bergsager, E., Dahl-Stamnes, A., Holter, E., Johansen, B., Lie, E. & Lund, T.B. Arctic Geology and Petroleum Potential, Proceedings of the Norwegian Petroleum Society Conference, 15-17 August 1990, Tromso, Norway. Norwegian Petroleum Society (NPF), Special Publication 2 Elsevier, Amsterdam, 27-53.
https://www.elsevier.com/books/arctic-geology-and-petroleum-potential/vorren/978-0-444-88943-0

• Extinction by 2027- by Malcolm Light
https://arctic-news.blogspot.com/2021/05/extinction-by-2027.html


• Anomalies of methane in the atmosphere over the East Siberian shelf: Is there any sign of methane leakage from shallow shelf hydrates? - by Shakhova, Semiletov, Salyuk and Kosmach (2008)
https://www.cosis.net/abstracts/EGU2008/01526/EGU2008-A-01526.pdf

• Understanding the Permafrost–Hydrate System and Associated Methane Releases in the East Siberian Arctic Shelf - by Natalia Shakhova, Igor Semiletov and Evgeny Chuvilin 
https://www.mdpi.com/2076-3263/9/6/251

• A Massive Methane Reservoir Is Lurking Beneath the Sea 


Tuesday, May 18, 2021

Extinction by 2027

by Malcolm Light

The greatest threat to humanity on Earth is the escalating Arctic atmospheric methane buildup, caused by the destabilization of subsea methane hydrates. This subsea Arctic methane hydrate destabilization will go out of control in 2024 and lead to a catastrophic heatwave by 2026.

While the source region for this subsea methane is in Russian waters, the hot ocean current setting them off is the northern extension of the Gulf Stream - North Atlantic Drift, the “Svalbard Current”, which makes United States and Canadian atmospheric pollution guilty of this looming catastrophic Global Extinction event.


References

Extinction by 2027 - Post by Malcolm Light and comments 
https://www.facebook.com/malcolm.light.50/posts/4013328748745929

Anomalies of methane in the atmosphere over the East Siberian shelf: Is there any sign of methane leakage from shallow shelf hydrates? - by Shakhova, Semiletov, Salyuk and Kosmach (2008) 
http://www.cosis.net/abstracts/EGU2008/01526/EGU2008-A-01526.pdf

Max, M.D. & Lowrie, A. 1993. Natural gas hydrates: Arctic and Nordic Sea potential. In: Vorren, T.O., Bergsager, E., Dahl-Stamnes, A., Holter, E., Johansen, B., Lie, E. & Lund, T.B. Arctic Geology and Petroleum Potential, Proceedings of the Norwegian Petroleum Society Conference, 15-17 August 1990, Tromso, Norway. Norwegian Petroleum Society (NPF), Special Publication 2 Elsevier, Amsterdam, 27-53. 
https://www.elsevier.com/books/arctic-geology-and-petroleum-potential/vorren/978-0-444-88943-0

Lucy-Alamo Projects - Hydroxyl Generation and Atmospheric Methane Destruction