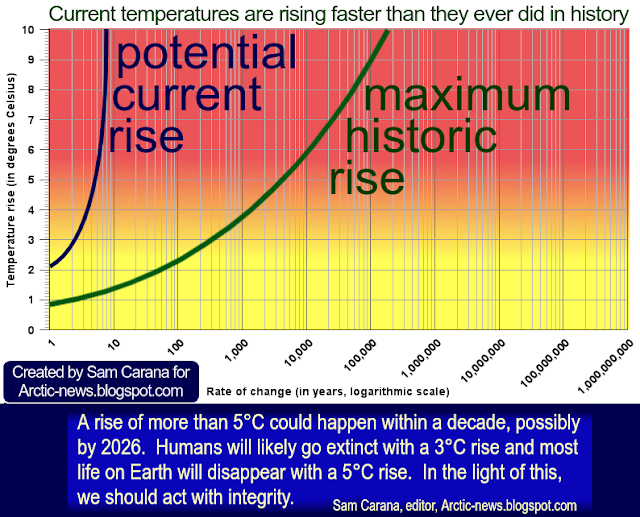
In a recent paper, Guy McPherson, Beril Sirmacek and Ricardo Vinuesa discuss Environmental thresholds for mass-extinction events. Authors point at an image by Song et al. (2021) that shows how major mass extinctions over the past 541 million years (the Phanerozoic) are linked to temperature rises higher than 5.2°C and rates of change higher than 10°C/Myr.
In the video below, authors Guy McPherson, Beril Sirmacek and Ricardo Vinuesa discuss their analysis 'Environmental thresholds for mass extinction events'.
Authors point out that, next to temperature rise and rates of change, there are further variables such as rates of deforestation, ocean acidification and spreading of toxic substances that can additionally contribute to cause species to disappear.
Accordingly, many species are likely to go extinct at rises much lower than 5°C.
Humans - who depend on many species - could go extinct with a 3°C rise, as the above-mentioned earlier post concluded.
This makes it even more critical to assess how much the temperature has already risen from pre-industrial. As illustrated by the image below, we may already be more than 2°C above pre-industrial and face a potentially huge temperature rise over the next few years.
When Turco et al. (1983) and Carl Sagan (1983) warned the world about the climatic effects of a nuclear war, they pointed out that the amount of carbon stored in a large city was sufficient to release enough aerosols (smoke, soot and dust) to block sunlight over large regions, leading to a widespread failure of crops and thereby extensive starvation.
Current nuclear arsenals by the United States and Russia could inject 150 Teragram (Tg) (10⁹ kilogram) of soot from fires ignited by nuclear explosions into the upper troposphere and lower stratosphere (Coupe et al., 2019), lasting for a period of 10 years or longer, followed by a period of intense radioactive radiation over large areas. Even a “limited” nuclear war, such as between India and Pakistan, would release enough aerosols to affect large regions, killing millions or billions through starvation. As stated by Robock et al., 2007): “The casualties from the direct effects of blast, radioactivity, and fires resulting from the massive use of nuclear weapons by the superpowers would be so catastrophic … the ensuing nuclear winter would produce famine for billions of people far from the target zones”.
By 2021, with a global arsenal of ~13.000 nuclear warheads, 90 percent of which held by Russia and the US, regional conflicts such as in the Ukraine and Taiwan threaten to spill world-wide. As the clock of the atomic scientists is set at 100 seconds to doomsday, the rising probability of an intended or inadvertent nuclear war, in the background of rising global warming, indicate an hour of truth for the species―a choice between the defence of life on Earth and global suicide.
While the inhabitants of the planet are preoccupied with the 24 hours news cycle, media hype, superlatives, a deadly Virus, economic issues and sport games, the hair-trigger nuclear gun loaded by the powers to be, east and west, are threatening all life on Earth.
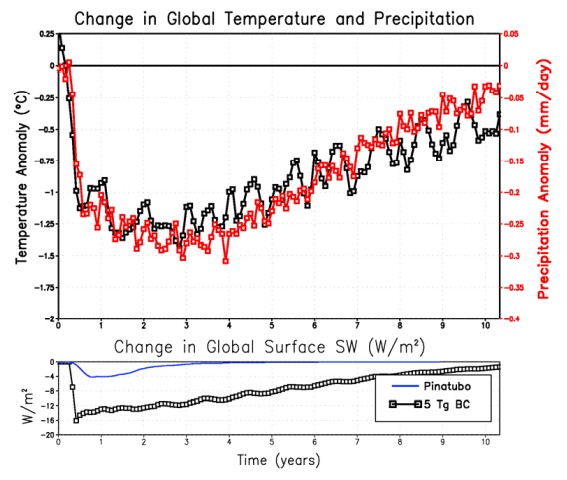
A release of 5Tg (Tera-gram) of black carbon is modelled to lower the average global temperature by about 1.5°C (Robock et al. 2007), although over the continents cooling is likely to be more abrupt.
Figure 3.Robock et al. (2007): Time variation of global average net surface shortwave radiation, surface air temperature, and precipitation changes for the 5 Tg standard case. The global average precipitation in the control case is 3.0 mm/day, so the changes in years 2-4 represent a 9% global average reduction in precipitation. The precipitation recovers faster than the temperature, but both lag the forcing. For comparison the global average net surface shortwave forcing from a model simulation of the 1991 Mt. Pinatubo eruption (Oman et al., 2005) is shown.
Inherent in nuclear war strategy is a “use them or lose them” approach, namely hitting the enemy’s air and missile launch pads before missiles can be launched, which amounts to a virtual guarantee many or most nuclear war heads are potentially used. With the estimated size of the global nuclear warheads inventory of many tens of thousands warheads (Figure 4) this guarantees a global catastrophe.
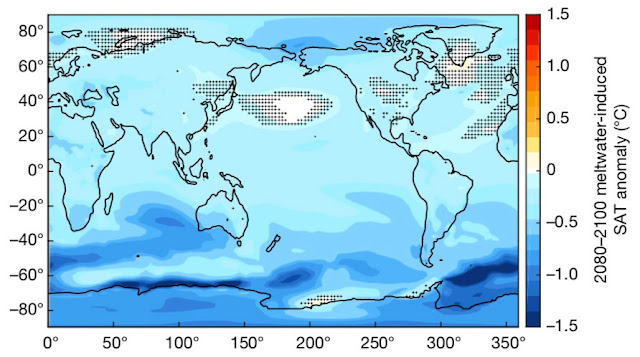
Such an extreme event would arrest global warming for a period of about 10 years or longer (Figures 2 and 3), possibly in part analogous to the consequences of a less abrupt flow of polar ice melt into the oceans, as modelled by Bronselaer et al. (2018) (Figure 5).
Figure 5. Model 2080–2100 meltwater-induced sea-air temperature anomalies relative to the standard RCP8.5 ensemble (Bronselaer et al., 2018), indicating marked cooling of parts of the southern oceans. Hatching indicates where the anomalies are not significant at the 95% level.
When Sagan and colleagues published their observations of a nuclear winter scenario as a warning to humanity, Sagan was painted as an “alarmist” by many, facing extensive criticism not just from pro-nuclear conservatives but also from scientists who resented him for leveraging his personal fame for advocating what some regarded as political views. A similar situation occurs nowadays with regard to the accelerating global warming and the nuclear threat, as confirmed by the warning by the Bulletin of the Atomic Scientists.
From the January 20, 2022 Bulletin of the Atomic Scientists news release: While the past year offered glimmers of hope that humankind might reverse its march toward global catastrophe, the Doomsday Clock was set at just 100 seconds to midnight. The time is based on continuing and dangerous threats posed by nuclear weapons, climate change, disruptive technologies, and COVID-19. All of these factors were exacerbated by “a corrupted information ecosphere that undermines rational decision making.” The Doomsday Clock statement explains that the “decision does not, by any means, suggest that the international security situation has stabilized. On the contrary, the Clock remains the closest it has ever been to civilization-ending apocalypse because the world remains stuck in an extremely dangerous moment.”
Time is running out.
Andrew Glikson
A/Prof. Andrew Glikson
Earth and Paleo-climate scientist School of Biological, Earth and Environmental Sciences The University of New South Wales, Kensington NSW 2052 Australia
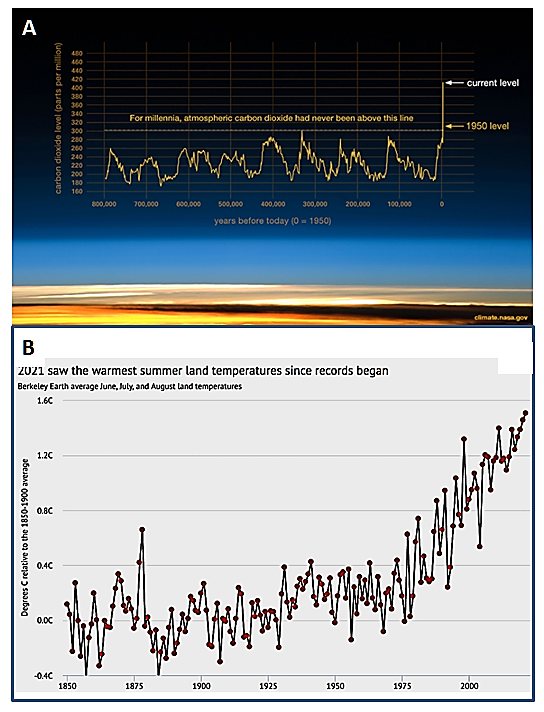
Figure 1. A. Mean global CO₂ levels from 800,000 years to the present (NASA). B. Mean global temperature rise from 1850 to 2021 (Berkeley Earth).
As stated by CarbonBrief: “The year so far has been one of extremes, featuring record-shattering heatwaves, wildfires and flooding, as well as the warmest-ever northern-hemisphere summer – June, July and August – in the global land-surface record.”
Other estimates are much longer. Because of the longevity of CO₂ and other greenhouses gases in the atmosphere, a decrease in carbon emissions, while essential, is not sufficient to reduce CO₂ levels in the atmosphere in time.
According to the IPCC “about 50% of a CO₂ increase will be removed from the atmosphere within 30 years, and a further 30% will be removed within a few centuries. The remaining 20% may stay in the atmosphere for many thousands of years”. According to the US EPA (Environmental Protection Agency) “Atmospheric lifetime: 50-200 years. No single lifetime can be defined for CO₂ because of the different rates of uptake by different removal processes”.
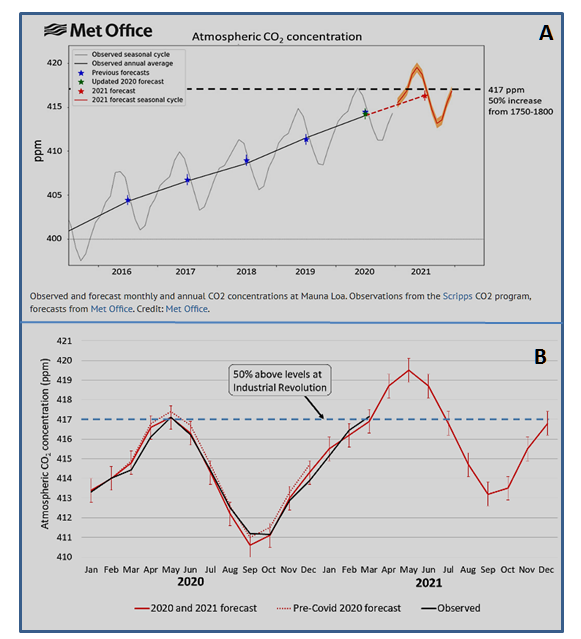
Figure 2. A. Observed and forecast monthly and annual CO2 concentrations at Mauna Loa.
Observations from the Scripps CO2 program, forecasts from Met Office. Credit: Met Office.
B. Measured and forecast monthly CO2 concentrations at Mauna Loa Observatory, Hawaii.
Black line: measurements by the Scripps Institution of Oceanography, UC San Diego. Solid red line
with vertical uncertainty bars: forecast by the Met Office, including the revised forecast for 2020
issued in May 2020 accounting for reduced global emissions due to societal responses to Covid-19.
The forecast uncertainty estimate is ± 0.6 ppm. Dotted red line: original Met Office forecast for
2020 issued in January 2020, not accounting for Covid-related emissions reductions.
Horizontal dashed blue line: 417 ppm, a 50% increase above 278 ppm, the level in 1750-1800
from ice core records.
All taking place notwithstanding hollow promises made at COP26, a meeting noted for the near-absence of contributions by climate scientists.
In trying to avoid an exponential rise in greenhouse gases toward catastrophic levels, one option exists, namely urgent attempts at drawing down at least part of the CO₂ concentration of the atmosphere. The $trillions of dollars required, constituting the “Price of the Earth”, may not exceed the $trillion dollars military expenses spent by the world over the last 70 years, including nuclear missile fleets which constitute a separate threat for life on Earth, as warned by Albert Einstein: “The unleashed power of the atom has changed everything save our modes of thinking and we thus drift toward unparalleled catastrophe”.
Andrew Glikson
A/Prof. Andrew Glikson
Earth and Paleo-climate scientist School of Biological, Earth and Environmental Sciences The University of New South Wales, Kensington NSW 2052 Australia