1. El Niño


Current conditions still are El Niño-neutral. Since the temperature rise is amplified in the Arctic, a strong El Niño later in 2020 can hit the Arctic particularly hard, which can act as a catalyst that triggers further tipping points to get crossed, as also discussed in an earlier post. This can in turn cause a steep global temperature rise, as illustrated by the image on the right.
The image below shows that, on the Northern Hemisphere, the March sea surface temperature anomaly for 2020 was higher than previous years.


Sea ice hanging meters below the surface has until now consumed huge amounts of ocean heat moving into the Arctic Ocean in Spring on the Northern Hemisphere. As a result, there has been a huge reduction in Arctic sea ice volume over the years.
Moreover, Arctic sea ice is getting very thin. The image below shows a sea ice thickness (in meters) comparison below between April 26, 2015 and April 26, 2020, i.e. forecasts for February 26, run on April 25.
Arctic sea ice volume is now past its annual peak and looks set for a steep fall. Arctic sea ice volume has been at a record low for the time of year since the start of 2020.

Ocean heat is on the rise, particularly on the Northern Hemisphere. As the sea ice is getting thinner, there now is little or no buffer left to consume the influx of ever warmer and salty water from the Atlantic Ocean and Pacific Ocean. As illustrated by the image below, there is a tipping point at 1°C above the 20th century average, i.e. there are indications that a rise of 1°C will result in most of the sea ice underneath the surface to disappear.
 |
| [ from earlier post ] |

As long as there is sea ice in the water, this sea ice will keep absorbing heat as it melts, so the temperature will not rise at the sea surface. But there is ever less sea ice volume left to absorb ocean heat, and the amount of energy absorbed by melting ice is as much as it takes to heat an equivalent mass of water from zero to 80°C.

Meanwhile, temperatures keep rising globally and more than 90% of global warming is going into oceans.
3. Loss of Sea Ice Albedo
Disappearance of the sea ice goes hand in hand with albedo changes that mean that a lot more sunlight will be absorbed by the Arctic Ocean, instead of getting reflected back into space as occurred previously.
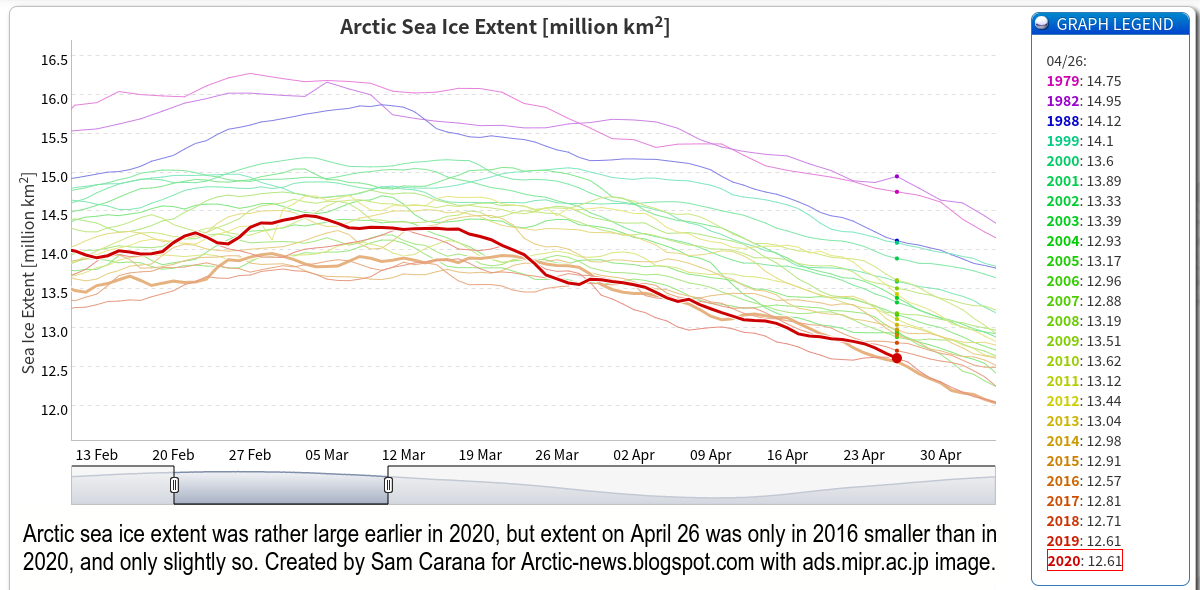
Arctic sea ice extent was rather large earlier in 2020, but extent on April 26 was only in 2016 smaller than in 2020, and only slightly so.
The annual fall in Arctic sea ice is strongly influenced by weather conditions over the Arctic Ocean, as well as weather conditions over Russia and North America, as discussed in the next point.

4. Loss of Terrestrial Permafrost
 Rising heat threatens to have a strong impact across the Arctic. One of the tipping points is abrupt thawing of terrestrial permafrost, resulting in loss of albedo, increased flow of hot water into the Arctic Ocean and mobilization of large amounts of greenhouse gases.
The Rutgers University image on the right shows a strong reduction in Eurasian snow cover in March 2020.
The albedo changes due to decline of terrestrial permafrost are likely similar in size compared to the changes taking place over over the sea ice.
Furthermore, as the albedo feedback speeds up demise of the permafrost, huge amounts of warm water flow into the Arctic Ocean from rivers and groundwater in Russia and North America, also mobilizing large amounts of carbon and nitrogen, as a recent study indicates.
Emissions across 2.5 million km² of abrupt thaw could provide a similar climate feedback as gradual thaw emissions from the entire 18 million km² permafrost region under the warming projection of Representative Concentration Pathway 8.5, a study published in February 2020 finds.
5. Jet Stream Changes
As the temperature difference between the Equator and the North Pole narrows, the Jet Stream gets ever more deformed, resulting in more extreme weather events.

 Above image shows Instantaneous Wind Power Density at 250 hPa (Jet Stream) on April 18, 2020, 06:00Z, with wind speed over North Greenland as high as 208 km/h or 129 mph (at green circle).
 The image on the right shows the same, but uses a different projection (Northern Hemisphere only).
The Jet Stream is crossing the Arctic Ocean at high speed and circular patterns show up all over the Arctic. Such changes to the jet stream can lead to strong temperature extremes closer to the surface.
 On average, Arctic temperature on April 20, 2020, was 5°C or 9°F higher than 1979-2000.
The image on the right is a temperature (air 2m) forecast for April 20, 2020, 21:00 UTC, run that day, showing the temperature in the Arctic to be 5.5°C or 9.9°F higher than 1979-2000. Over parts of the Arctic Ocean, the temperature was more than 20°C or 36°F (red color) higher.
On April 20, 2020, 09:00 UTC, the temperature over parts of the Arctic Ocean was well above 0°C or 32°F, and as high as 2.5°C or 36.5°F at the green circle on the image below.
The situation is dire and threatens to cause early demise of the sea ice and releases of huge amounts of methane from the seafloor of the Arctic Ocean.

Later in the year, more extreme weather is likely to cause very high temperatures on land in parts of North America, Russia and Greenland, resulting in ever more fresh water entering the Arctic Ocean.
Fresh water has a very low alkalinity or buffering capacity, which reduces the ability of the Arctic Ocean to take up carbon dioxide, a recently-published study finds, which leads to the following point, i.e. loss of carbon sinks.
6. Loss of Carbon Sinks
While the COVID-19 lockdowns have caused emissions to come down, especially emissions associated with transport and industry, greenhouse gas levels still appear to be rising at accelerating pace.

As above image illustrates, the relentless rise in daily average carbon dioxide isn't slowing down, the rise actually appears to be accelerating. The annual peak in carbon dioxide is typically reached in May, so the recent rise can be expected to continue for some time.
More extreme weather is causing stronger droughts, heatwaves and forest fires. This threatens to destroy farmland as well as forests that were carbon sinks until now.
Important is also what happens in oceans. A recent study finds that one particular layer in the North Atlantic Ocean, a water mass called the North Atlantic Subtropical Mode Water, is very efficient at drawing carbon dioxide out of the atmosphere. Ocean warming is restricting its formation and changing the anatomy of the North Atlantic, making it a less efficient sink for heat and carbon dioxide.
Indeed, more carbon carbon may already get released from oceans than they can take up from the atmosphere. The Arctic has a pivoting role in this.
7. Seafloor Methane
The image below shows the rise in methane levels at Barrow, Alaska.

 Globally, NOAA reports a growth in methane levels of 11.54 parts per billion in 2019, the highest growth rate of the past few years.
The image on the right shows an added trend ominously pointing at a doubling of methane levels by 2026.
A doubling of methane over the next decade would have more warming impact globally than a doubling of carbon dioxide levels.
These are marine surface data; the largest rise in methane has actually taken place at higher altitudes.
The image below shows high methane levels over the Arctic, as well as over Antarctica, with methane levels recorded as high as 2755 ppb.
One explanation for the high levels of methane over Antarctica is that wild pressure and temperature swings are causing cracks to widen and release methane.

While freshwater generally is increasing due to increased melting, the Arctic Ocean can occasionally experience be a huge influx of warm, salty water from the Atlantic Ocean.
Changes to the Jet Stream make that stronger winds push warm water along the path of the Gulf Stream toward the Arctic Ocean, as discussed in a recent post. A recent study finds increasing current velocities in the European Arctic Corridor, an increase, up to two-fold, in North Atlantic current surface velocities over the last 24 years.
Such an influx of warm, salty water could cause another tipping point to get crossed, i.e. the point where temperatures rise at the seafloor of the Arctic Ocean and start destabilizing methane hydrates. This can occur when ice melts of the hydrate cages, thus causing methane to erupts, causing it to expand 160 times in volume when changing from a liquid to a gas.
As the temperature of the oceans keeps rising, the danger increases that heat will reach the seafloor of the Arctic Ocean and will destabilize hydrates contained in sediments at the seafloor, resulting in abrupt eruption of vast amounts of methane that further speed up Arctic warming.

8. Nitrous Oxide and Ozone Layer Decline
The image below shows levels of nitrous oxide as high as 354 ppb on April 6, 2020, with very high levels over Antarctica.

One explanation for the high levels of nitrous oxide could evolve around the presence of some very cold areas at the poles. Again, more extreme weather events, including wild temperature and pressure swings, could be behind this. Similarly, this could also be behind ozone depletion in the stratosphere.
The Arctic is particularly vulnerable to a rapid temperature rise. Greenhouse gas levels are already very high over the Arctic. At the same time, hydroxyl levels are low over the Arctic, increasing the lifetime of methane over the Arctic. Furthermore, changes in aerosols can have a strong impact on Arctic temperatures. Black carbon settling on snow and ice hits the Arctic hard, as it is speeding up warming.
Without the dimming impact of other aerosols, the Arctic would have heated up even more in March 2020 is. Dust and sulfate currently mask much of the impact that high levels of greenhouse gas levels have over the Arctic.
9. Aerosols and Falling away of the Aerosol Masking Effect
According to IPCC AR5, dust has a direct impact of -0.1 W/m², while additionally contributing to aerosol–cloud interactions. When taking into account a 0.15 W/m² warming impact found to be caused by coarse dust, dust may well cause net warming, which is the more important since dust is likely to increase due to more fires, stronger winds and further desertification.
Above image shows that τ, i.e. light at 550 nm as a measurement of aerosol optical thickness due to dust aerosols, was as high as 8.9534 on March 28, 2020, at 07:00 UTC. The image also shows that quite a lot of dust ends up over the Arctic.
Globally, sulfur has an even larger impact. The image on the right shows sulfur dioxide emissions over Wuhan, China, reaching peak levels of 2745.54 µg/m³ on April 19, 2020 (top), 3572.28 µg/m³ on April 04, 2019(middle) and 3410.96 µg/m³ on April 27, 2018 (bottom).
As a result of the COVID-19 lockdowns, traffic and large parts of industrial activity have ground to a halt worldwide. Nonetheless, sulfur emissions can still be high, while ship tracks are clearly visible on the top image. The impact of shipping alone is huge, as discussed in a recent post.
Most sulfur emissions are originating from coal-fired power plants, shipping and smelters, which until now appear not to have slowed down much.
Consequently, sulfate aerosol levels can still be high, as illustrated by the image below which shows that τ, i.e. light at 550 nm as a measurement of aerosol optical thickness due to sulfate aerosols, was as high as 5.233 on April 29, 2020, at 07:00 UTC.

According to the IPCC AR5 (image on the right), the direct cooling impact of sulfate aerosols is as much as -0.62 W/m². Additionally, sulfate aerosols strongly contribute to the impact of aerosol–cloud interactions, estimated in AR5 to provide as much as -1.2 W/m² cooling. Taken together, the two add up to as much as -1.82 W/m² of cooling.
As said, sulfate currently has a strong cooling impact on the Arctic, as above image shows. Reductions in the aerosol masking effect could make temperatures in the Arctic and globally rise abruptly and dramatically.
A steep rise in temperature is in line with unfolding developments that are causing the aerosol masking effect to fall away, such as a decrease in industrial activity due to COVID-19 fears. The danger is illustrated by the image below. The image below shows a potential rise of 18°C or 32.4°F from 1750 by the year 2026.

Above image was posted more than a year ago and illustrates that much of this potentially huge temperature rise over the next few years could eventuate as a result of a reduction in the cooling now provided by sulfate. In other words, a steep temperature rise could result from a decline in industrial activity caused by the virus, as also discussed in the video at an earlier post.
Furthermore, above image also shows strong warming due to black carbon and brown carbon. Indeed, the virus could cause not only a decline in the use of fossil fuel for smelters, transport and energy, including for heating, cooking and lighting. That would be great, since there are cleaner alternatives, but when many people instead switched to burning biomass in woodburners (stoves, heaters and fireplaces, for heating, preparing food and boiling water) and in open fires, while also burning more forests to create more pasture for grazing, and while burning more waste in the absence of appropriate waste management, the net warming (due to increased black carbon and brown carbon) could be a lot higher, especially when combined with a strong increase in forest fires.
10. Collapse of Biosystems and further Tipping Points
Rising temperatures are causing more extreme weather events and are changing the Jet Stream, which further contributes to more extreme weather.
In the past, Earth's climate zones used to be kept well apart by the Jet Streams. On the Northern Hemisphere, the Northern Polar Jet Stream used to be working hard to keep the Tundra and Boreal climate zones' colder air in the North separate from the Temperate climate and the Subtropical climate zones' warmer air closer to the Equator. This has now changed. More generally, rising temperatures and changes to the Jet Streams are threatening Earth's climate zones to collapse, in turn resulting in biosystems collapse.
Fresh water has a very low alkalinity or buffering capacity, which reduces the ability of the Arctic Ocean to take up carbon dioxide, a recently-published study finds, which leads to the following point, i.e. loss of carbon sinks.
6. Loss of Carbon Sinks
While the COVID-19 lockdowns have caused emissions to come down, especially emissions associated with transport and industry, greenhouse gas levels still appear to be rising at accelerating pace.

As above image illustrates, the relentless rise in daily average carbon dioxide isn't slowing down, the rise actually appears to be accelerating. The annual peak in carbon dioxide is typically reached in May, so the recent rise can be expected to continue for some time.
More extreme weather is causing stronger droughts, heatwaves and forest fires. This threatens to destroy farmland as well as forests that were carbon sinks until now.
Important is also what happens in oceans. A recent study finds that one particular layer in the North Atlantic Ocean, a water mass called the North Atlantic Subtropical Mode Water, is very efficient at drawing carbon dioxide out of the atmosphere. Ocean warming is restricting its formation and changing the anatomy of the North Atlantic, making it a less efficient sink for heat and carbon dioxide.
Indeed, more carbon carbon may already get released from oceans than they can take up from the atmosphere. The Arctic has a pivoting role in this.
7. Seafloor Methane
The image below shows the rise in methane levels at Barrow, Alaska.
 Globally, NOAA reports a growth in methane levels of 11.54 parts per billion in 2019, the highest growth rate of the past few years.
The image on the right shows an added trend ominously pointing at a doubling of methane levels by 2026.
A doubling of methane over the next decade would have more warming impact globally than a doubling of carbon dioxide levels.
These are marine surface data; the largest rise in methane has actually taken place at higher altitudes.
The image below shows high methane levels over the Arctic, as well as over Antarctica, with methane levels recorded as high as 2755 ppb.
One explanation for the high levels of methane over Antarctica is that wild pressure and temperature swings are causing cracks to widen and release methane.

While freshwater generally is increasing due to increased melting, the Arctic Ocean can occasionally experience be a huge influx of warm, salty water from the Atlantic Ocean.
Changes to the Jet Stream make that stronger winds push warm water along the path of the Gulf Stream toward the Arctic Ocean, as discussed in a recent post. A recent study finds increasing current velocities in the European Arctic Corridor, an increase, up to two-fold, in North Atlantic current surface velocities over the last 24 years.
Such an influx of warm, salty water could cause another tipping point to get crossed, i.e. the point where temperatures rise at the seafloor of the Arctic Ocean and start destabilizing methane hydrates. This can occur when ice melts of the hydrate cages, thus causing methane to erupts, causing it to expand 160 times in volume when changing from a liquid to a gas.
As the temperature of the oceans keeps rising, the danger increases that heat will reach the seafloor of the Arctic Ocean and will destabilize hydrates contained in sediments at the seafloor, resulting in abrupt eruption of vast amounts of methane that further speed up Arctic warming.

8. Nitrous Oxide and Ozone Layer Decline
The image below shows levels of nitrous oxide as high as 354 ppb on April 6, 2020, with very high levels over Antarctica.

One explanation for the high levels of nitrous oxide could evolve around the presence of some very cold areas at the poles. Again, more extreme weather events, including wild temperature and pressure swings, could be behind this. Similarly, this could also be behind ozone depletion in the stratosphere.
Without the dimming impact of other aerosols, the Arctic would have heated up even more in March 2020 is. Dust and sulfate currently mask much of the impact that high levels of greenhouse gas levels have over the Arctic.
9. Aerosols and Falling away of the Aerosol Masking Effect
According to IPCC AR5, dust has a direct impact of -0.1 W/m², while additionally contributing to aerosol–cloud interactions. When taking into account a 0.15 W/m² warming impact found to be caused by coarse dust, dust may well cause net warming, which is the more important since dust is likely to increase due to more fires, stronger winds and further desertification.
 |
| [ Dust, from the Aerosols page ] |
 |
| [ click on images to enlarge ] |
Globally, sulfur has an even larger impact. The image on the right shows sulfur dioxide emissions over Wuhan, China, reaching peak levels of 2745.54 µg/m³ on April 19, 2020 (top), 3572.28 µg/m³ on April 04, 2019(middle) and 3410.96 µg/m³ on April 27, 2018 (bottom).
As a result of the COVID-19 lockdowns, traffic and large parts of industrial activity have ground to a halt worldwide. Nonetheless, sulfur emissions can still be high, while ship tracks are clearly visible on the top image. The impact of shipping alone is huge, as discussed in a recent post.
Most sulfur emissions are originating from coal-fired power plants, shipping and smelters, which until now appear not to have slowed down much.
Consequently, sulfate aerosol levels can still be high, as illustrated by the image below which shows that τ, i.e. light at 550 nm as a measurement of aerosol optical thickness due to sulfate aerosols, was as high as 5.233 on April 29, 2020, at 07:00 UTC.

 |
| [ Radiative Forcing, IPCC, from the Aerosols page ] |
According to the IPCC AR5 (image on the right), the direct cooling impact of sulfate aerosols is as much as -0.62 W/m². Additionally, sulfate aerosols strongly contribute to the impact of aerosol–cloud interactions, estimated in AR5 to provide as much as -1.2 W/m² cooling. Taken together, the two add up to as much as -1.82 W/m² of cooling.
As said, sulfate currently has a strong cooling impact on the Arctic, as above image shows. Reductions in the aerosol masking effect could make temperatures in the Arctic and globally rise abruptly and dramatically.
A steep rise in temperature is in line with unfolding developments that are causing the aerosol masking effect to fall away, such as a decrease in industrial activity due to COVID-19 fears. The danger is illustrated by the image below. The image below shows a potential rise of 18°C or 32.4°F from 1750 by the year 2026.

Above image was posted more than a year ago and illustrates that much of this potentially huge temperature rise over the next few years could eventuate as a result of a reduction in the cooling now provided by sulfate. In other words, a steep temperature rise could result from a decline in industrial activity caused by the virus, as also discussed in the video at an earlier post.
Furthermore, above image also shows strong warming due to black carbon and brown carbon. Indeed, the virus could cause not only a decline in the use of fossil fuel for smelters, transport and energy, including for heating, cooking and lighting. That would be great, since there are cleaner alternatives, but when many people instead switched to burning biomass in woodburners (stoves, heaters and fireplaces, for heating, preparing food and boiling water) and in open fires, while also burning more forests to create more pasture for grazing, and while burning more waste in the absence of appropriate waste management, the net warming (due to increased black carbon and brown carbon) could be a lot higher, especially when combined with a strong increase in forest fires.
10. Collapse of Biosystems and further Tipping Points
Rising temperatures are causing more extreme weather events and are changing the Jet Stream, which further contributes to more extreme weather.
 |
| [ from earlier post ] |
As said, more extreme weather is causing stronger droughts, heatwaves and forest fires. This threatens to destroy farmland as well as forests that were carbon sinks until now. The Boreal forests in Siberia and North America and the tundra within the Arctic Circle are particularly vulnerable, but also under threat are the peat fields and forests in Africa and South-east Asia and South America. Forest fires in Australia earlier this year will also have contributed to higher carbon dioxide levels. Links between extreme weather events over the permafrost and methane releases, earthquakes and sudden stratospheric warming were discussed in a recent post.
Further tipping points can exist outside of the Arctic, such as hydrological changes, in particular changes to the monsoons in India and Africa, and rapid melting of the snow and ice cover of mountain ranges such as the Himalayas, which could temporarily cause flooding and eventually drought, famine, heatwaves and mass starvation, further exacerbated by worldwide crop failure, loss of species and entire biosystems, and by collapse of the Antarctic and Greenland Ice Sheets causing flooding of coastal areas around the globe.
For more on collapse of biosystems, loss of habitat for many species (including humans) and more, view the video below by Guy McPherson.
Again, the emissions and temperature rises associated with such further tipping points will hit the Arctic particularly hard, given the amplification of the global temperature rise in the Arctic.
Conclusions, further reflections on methane
How important are these points? How much harm could result from, say, seafloor methane releases? Well, such releases can speed up the temperature rise rapidly and dramatically. How fast? In a matter of years. How much? Have another look at the image below, from an earlier post, showing the global warming potential (GWP) of methane.

Why is methane's GWP so important? The trend in above image shows that, over the first few years after its release, methane's GWP is 150 times higher than carbon dioxide. This trend is based on IPCC AR5 figures and is actually conservative, i.e. the IPCC also gives higher values for methane's GWP in AR5, i.e. for fossil methane and when including climate change feedbacks, while there also is additional warming due to the carbon dioxide that results from methane's oxidation. Furthermore, new research has calculated that methane's radiative forcing is higher than reported in IPCC AR5, so methane's GWP will be over 150 for a longer period than just over the first few years.
The trend in the image indicates that methane's GWP over a period of 12.4 years is 100. The IPCC in AR5 gives methane a lifetime of 12.4 years, i.e. the methane in the atmosphere gets broken down in 12.4 years time. Importantly, the methane gets more than replenished, since the overall methane burden keeps rising. In other words, a GWP of 100 applies to all methane in the atmosphere, i.e. the existing burden + new releases that (more than) replenish what gets broken down.
The trend points at a GWP of 150 over the first few years. Given that, as said above, the trend in the image is conservative, methane may well have a GWP of 150 over a period of 5⅔ years, i.e. the time between now and 2026.
When using a GWP of 150 for methane over 5⅔ years, the joint burden of the carbon dioxide and the methane now present in the atmosphere is about 700 ppm CO₂e. When adding a seafloor methane release of twice the size of the methane that's already in the atmosphere and when again using a GWP of 150 for methane over 5⅔ years, such a methane release would be enough to trigger the clouds feedback by 2026, which on its own could raise the global temperature by 8°C in 2026.
Keep in mind that, next to seafloor methane, there are further elements that also contribute to the temperature rise, so the clouds feedback could be triggered with far less methane. In total, a rise of 18°C could eventuate by 2026, as illustrated by the image below and as discussed in an earlier post.

The situation is dire and calls for immediate, comprehensive and effective action, as described in the Climate Plan.
Links
• Climate Plan
https://arctic-news.blogspot.com/p/climateplan.html
• NOAA Trends in Atmospheric Methane
https://www.esrl.noaa.gov/gmd/ccgg/trends_ch4
• Eurasian Snow Cover Anomalies, 1967-2020 March, Rutgers University
https://climate.rutgers.edu/snowcover/chart_anom.php?ui_set=1&ui_region=eurasia&ui_month=3
• Carbon release through abrupt permafrost thaw - by Merritt Turetsky et al.
https://www.nature.com/articles/s41561-019-0526-0
• Groundwater as a major source of dissolved organic matter to Arctic coastal waters - by Craig Connolly et al. https://www.nature.com/articles/s41467-020-15250-8
• A recent decline in North Atlantic subtropical mode water formation - by Samuel Stevens et al.
https://www.nature.com/articles/s41558-020-0722-3
• Freshening of the western Arctic negates anthropogenic carbon uptake potential - by Ryan Woosley
https://aslopubs.onlinelibrary.wiley.com/doi/abs/10.1002/lno.11421
• Why stronger winds over the North Atlantic are so dangerous
https://arctic-news.blogspot.com/2020/02/why-stronger-winds-over-north-atlantic-are-so-dangerous.html
• Faster Atlantic currents drive poleward expansion of temperate phytoplankton in the Arctic Ocean - by L. Oziel et al. https://www.nature.com/articles/s41467-020-15485-5
• What's wrong with the weather?
http://arctic-news.blogspot.com/2014/07/whats-wrong-with-the-weather.html
• Aerosols
https://arctic-news.blogspot.com/p/aerosols.html
• Climate models miss most of the coarse dust in the atmosphere - by Adeyemi Adebiyi et al.
https://advances.sciencemag.org/content/6/15/eaaz9507
• Arctic Ocean February 2020
https://arctic-news.blogspot.com/2020/02/arctic-ocean-february-2020.html
• 2°C crossed
https://arctic-news.blogspot.com/2020/03/2c-crossed.html
• Blue Ocean Event
https://arctic-news.blogspot.com/2018/09/blue-ocean-event.html
• 2020 El Nino could start 18°C temperature rise
https://arctic-news.blogspot.com/2019/11/2020-el-nino-could-start-18-degree-temperature-rise.html
• Stronger Extinction Alert
https://arctic-news.blogspot.com/2019/03/stronger-extinction-alert.html
• Methane, Earthquake and Sudden Stratospheric Warming
https://arctic-news.blogspot.com/2020/03/methane-earthquake-and-sudden-stratospheric-warming.html
• Most Important Message Ever
https://arctic-news.blogspot.com/2019/07/most-important-message-ever.html


