Showing posts with label seafloor. Show all posts

Sunday, December 12, 2021

Terrifying Arctic methane levels

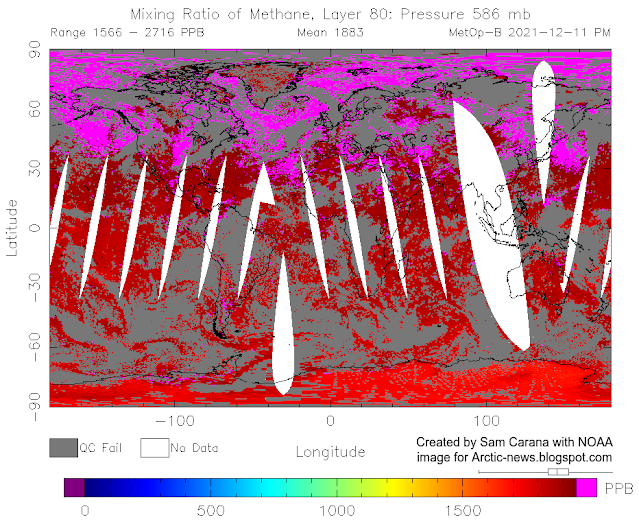
A peak methane level of 3026 ppb was recorded by the MetOp-B satellite at 469 mb on December 11, 2021 am.

This follows a peak methane level of 3644 ppb recorded by the MetOp-B satellite at 367 mb on November 21, 2021, pm.


A peak methane level of 2716 ppb was recorded by the MetOp-B satellite at 586 mb on December 11, 2021, pm, as above image shows. This image is possibly even more terrifying than the image at the top, as above image shows that at 586 mb, i.e. much closer to sea level, almost all methane shows up over sea, rather than over land, supporting the possibility of large methane eruptions from the seafloor, especially in the Arctic. 

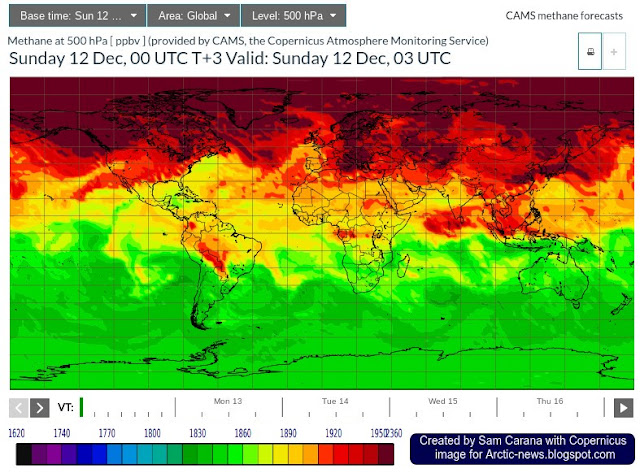
Also, the image was recorded later than the image at the top with the 3026 ppb peak, indicating that even more methane may be on the way. This appears to be confirmed by the Copernicus forecast for December 12, 2021, 03 UTC, as illustrated by the image below, which shows methane at 500 hPa (equivalent to 500 mb).


Furthermore, very high methane levels have recently been recorded at Barrow, Alaska, as illustrated by the image below, showing monthly averages.


And carbon dioxide levels have also been very high recently at Barrow, Alaska, as illustrated by the image below, showing daily averages. 


What causes these terrifying methane levels?

As the combination image below shows, the sea surface temperature north of Svalbard was as high as 4.3°C (or 39.74°F, green circle in the left panel) on December 12, 2021, i.e. as much as 5°C (or 9°F, green circle in the right panel) higher than 1981-2011.

[ click on images to enlarge ]

As temperatures in the Arctic keep rising faster than elsewhere in the world, the Jet Stream gets ever more distorted. The image on the right shows a heavily distorted Jet Stream covering most of the Northern Hemisphere on December 13, 2021, with sea surface temperatures off the coast of North America as much as 10.7°C (or 19.2°F, at the green circle) higher than 1981-2011.

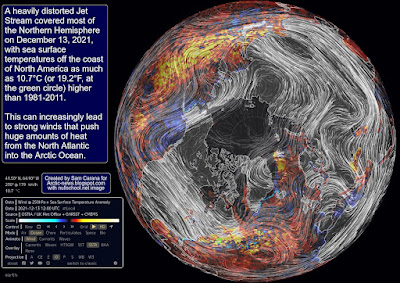
At times, this can lead to very strong winds that push huge amounts of heat from the North Atlantic into the Arctic Ocean.

The image on the right is a forecast for December 14, 2021, showing strong wind causing waves as high as 8.3 m (or 27.2 ft) off the coast of Norway, speeding up the flow of warm water as it dives underneath the sea ice north of Svalbard. 

Huge amounts of heat can thus move into the Arctic Ocean, driven by ocean currents and temperature differences.

The danger is that warmer water will cause methane to erupt from the seafloor of the Arctic Ocean, as an earlier post warned.

[ The buffer is gone, from earlier post ]

Sea ice used to act as a buffer, by consuming energy in the process of melting, thus avoiding that this energy could raise the temperature of the water of the Arctic Ocean. As above image indicates, the buffer has now virtually disappeared. 

As sea ice gets thinner, ever less sea ice can act as a buffer. This is also illustrated by the 30-day navy.mil animation (up to November 12, the last 8 days are forecasts) on the right, from an earlier post.

Furthermore, huge amounts of heat did get transferred to the atmosphere over the Arctic Ocean, while and as long as sea ice was low in extent.

The image on the right, also from that earlier post, shows the October 2021 temperature anomaly, with anomalies over the Arctic showing up of as much as 9.1°C.

As the sea ice animation also shows, lower air temperatures after September caused the sea ice to grow in extent, effectively sealing off the Arctic Ocean and reducing heat transfer from the Arctic Ocean to the atmosphere.

Heat that was previously melting the ice or that was getting transferred to the atmosphere is now instead heating up the water. Some 75% of ESAS (East Siberian Arctic Shelf) is shallower than 50 m. Being shallow, these waters can easily warm up all the way down to the sea floor, where heat can penetrate cracks and conduits, destabilizing methane hydrates and sediments that were until now sealing off methane held in chambers in the form of free gas in these sediments.

Sealed off from the atmosphere by sea ice, greater mixing of heat in the water will occur down to the seafloor of the Arctic Ocean.

[  From the post September 2015 Sea Surface Warmest On Record ]
There are some further factors that can contribute to the high methane levels over the Arctic. As the sea ice grows in extent, this results in less moisture evaporating from the water, which together with the change of seasons results in lower hydroxyl levels at the higher latitudes of the Northern Hemisphere, in turn resulting in less methane getting broken down in the atmosphere over the Arctic.

Also, as land around the Arctic Ocean freezes over, less fresh water will flow from rivers into the Arctic Ocean. As a result, the salt content of the Arctic Ocean increases, all the way down to the seafloor of the Arctic Ocean, making it easier for ice in cracks and passages in sediments at the seafloor to melt, allowing methane contained in the sediment to escape. Meanwhile, salty and warm water (i.e. warmer than water that is present in the Arctic Ocean) keeps getting carried along the track of the Gulf Stream into the Arctic Ocean.

The threat

[ The Buffer has gone, feedback #14 on the Feedbacks page ]
The threat is that some of the extra heat will reach sediments at the seafloor of the Arctic Ocean that contain huge amounts of methane in currently still frozen hydrates and in pockets of gas underneath.

Cracks and holes in these sediments that are filled with ice can, as the ice melts away, become passageways for heat to destabilize hydrates, causing an eruption of gas as the methane expands to 160 times its frozen volume. The shockwave resulting from such an eruption can then destabilize neighboring hydrates.

This process threatens to result in ever more methane getting released, as illustrated in the image on the right, from an earlier post.


NOAA's most recent global mean methane reading is 1890.9 ppb for August 2021, with a trend of 1894.8 ppb. Meanwhile, NOAA's global mean methane level will have risen further (December levels are typically more than 10 ppb higher than August levels), while NOAA's data are also for marine surface measurements, and more methane tends to accumulate at higher altitudes. 

In other words, the current global mean of methane is now above 1900 ppb. Given that methane's concentration is rising at accelerating pace (see image right), the implication is that in an expanding troposphere, the volume of methane and thus its greenhouse effect will be rising even faster. 

A study published November 2021 in Science Advances finds a continuous rise of the tropopause in the Northern Hemisphere over 1980–2020, resulting primarily from tropospheric warming. 

As illustrated by the image below, methane on December 26 am, 2021, reached a global mean of 1939 ppb between 293 mb and 280 mb, while the highest peak level (2554 ppb) was reached higher in the atmosphere, at 218 mb.


[ click on images to enlarge ]
The animation on the right, showing methane on December 31, 2021 am, may be helpful in analysis of the origin of these terrifying methane levels.

The CO₂ level at Mauna Loa was 415.87 ppm on December 9, 2021. The MetOp-B satellite recorded a mean methane level of 1958 ppb on October 25, 2021 am at 295 mb, and when using a 1-year GWP of 200, this translates into 391.6 ppm CO₂e. Together, that's 391.6 + 415.87 = 807.47 ppm CO₂e.  

Now add an additional 5 Gt of methane from an abrupt eruption of the seafloor, which is only 10% of the 50Gt that Natalia Shakhova et al. warned about long ago, while 50 Gt is in turn only a small fraction of all the methane contained in sediments in the Arctic. Such an eruption of seafloor methane would raise the global mean methane concentration by almost 2000 ppb which, at a 1-year GWP of 200, would translate into 400 ppm CO₂.

So, that would abruptly cause the joint CO₂e of methane and CO₂ to cross the 1200 ppm clouds tipping point, triggering a further 8°C global temperature rise, due to the clouds feedback


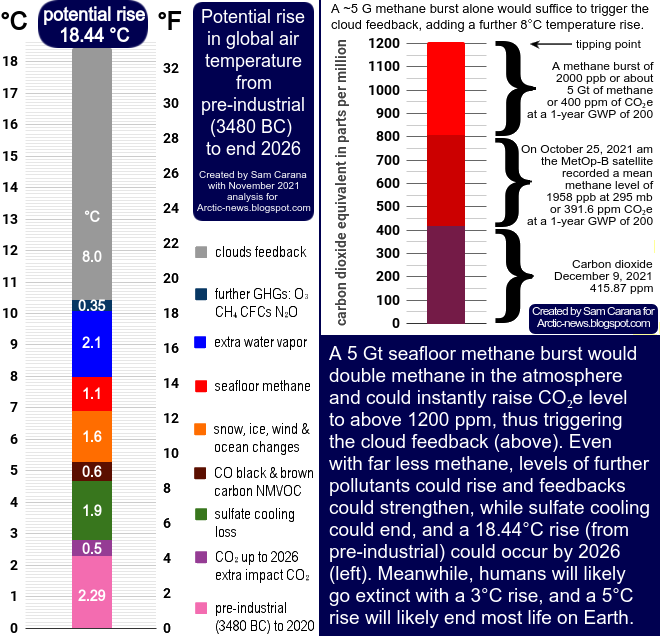
A 5 Gt seafloor methane burst would double the methane in the atmosphere and could instantly raise CO₂e level to above 1200 ppm, thus triggering the cloud feedback (panel top right). Even with far less methane, levels of further pollutants could rise and feedbacks could strengthen, while sulfate cooling could end, and a 18.44°C rise (from pre-industrial) could occur by 2026 (left panel). Meanwhile, humans will likely go extinct with a 3°C rise, and a 5°C rise will likely end most life on Earth.


Conclusion

The situation is dire and calls for the most comprehensive and effective action, as described at the Climate Plan.


Links

• NOAA Infrared Atmospheric Sounding Interferometer (IASI) Sounding Products

• CAMS, the Copernicus Atmosphere Monitoring Service
https://atmosphere.copernicus.eu/charts/cams

• Carbon Cycle Gases, NOAA, Barrow Atmospheric Baseline Observatory, United States

• Nullschool.net

• Warning of mass extinction of species, including humans, within one decade


• Human Extinction by 2022?

• The Methane Threat
https://arctic-news.blogspot.com/2017/04/the-methane-threat.html

• High methane levels over the Arctic Ocean on January 14, 2014

• NOAA mean global monthly methane

• The Importance of Methane

• SCRIPPS - The Keeling Curve

• Will COP26 in Glasgow deliver?

• Continuous rise of the tropopause in the Northern Hemisphere over 1980–2020 - by Lingyun Meng et al.

• Frequently Asked Questions

• When Will We Die?


Sunday, September 8, 2019

Arctic Ocean overheating


The Arctic Ocean is overheating, as illustrated by above image.
[ from earlier post ]

Heating of the water in the Arctic Ocean is accelerating, as illustrated by above map that uses 4-year smoothing and that shows temperatures in the Arctic that are up to 4.41°C hotter than the average global temperature during 1880-1920.

The NOAA image on the right shows the sea surface temperature difference from 1961-1990 in the Arctic at latitudes 60°N - 90°N on September 7, 2019.

Where Arctic sea ice disappears, hot water emerges on the image, indicating that the temperature of the ocean underneath the sea ice is several degrees above freezing point.

The nullschool.net image on the right shows sea surface temperature differences from 1981-2011 on the Northern Hemisphere on September 8, 2019, with anomalies reaching as high as 15.2°C or 27.4°F (near Svalbard, at the green circle).

Accelerating heating of the Arctic Ocean could make global temperatures skyrocket in a matter of years.

Decline of the sea ice comes with albedo changes and further feedbacks, such as the narrowing temperature difference between the North Pole and the Equator, which slows down the speed at which the jet stream circumnavigates Earth and makes the jet stream more wavy.


Disappearance of the sea ice also comes with loss of the buffer that has until now been consuming ocean heat as part of the melting process. As long as there is sea ice in the water, this sea ice will keep absorbing heat as it melts, so the temperature will not rise at the sea surface. The amount of energy absorbed by melting ice is as much as it takes to heat an equivalent mass of water from zero to 80°C. Once the sea ice is gone, further heat must go elsewhere.

[ click on images to enlarge ]
The Naval Research Laboratory image on the right shows a forecast for Sep. 8, 2019, run on Sep. 7, 2019, of the thickness of the sea ice. Sea ice has become terribly thin, indicating that the heat buffer constituted by the sea ice has effectively gone. Only a very thin layer of sea ice remains in place throughout much of the Arctic Ocean.

This remaining sea ice is stopping a lot of ocean heat from getting transferred to the air, so the temperature of the water of the Arctic Ocean is now rising rapidly, with the danger that some of the accumulating ocean heat will reach sediments at the seafloor and cause eruptions of huge amounts of methane.


This situation comes at a time that methane levels are very high globally. Mean global methane levels were as high as 1911 parts per billion on the morning of September 3, 2019, a level recorded by the MetOp-1 satellite at 293 mb (image below).


[ from an earlier post ]
As the image on the right shows, mean global levels of methane (CH₄) have risen much faster than carbon dioxide (CO₂) and nitrous oxide (N₂O), in 2017 reaching, respectively, 257%, 146% and 122% their 1750 levels.

Compared to carbon dioxide, methane is some 150 times as potent as a greenhouse gas during the first few years after release.

Huge releases of seafloor methane alone could make marine stratus clouds disappear, as described in an earlier post, and this clouds feedback could cause a further 8°C global temperature rise.

In total, global heating by as much as 18°C could occur by the year 2026 due to a combination of elements, including albedo changes, loss of sulfate cooling, and methane released from the ocean seafloor.

from an earlier post (2014)  

In the image below, from an earlier post, a global warming potential (GWP) of 150 for methane is used. Just the existing carbon dioxide and methane, plus seafloor methane releases, would suffice to trigger the clouds feedback tipping point to be crossed that by itself could push up global temperatures by 8°C, within a few years time, adding up to a total rise of 18°C by 2026.


Progression of heating could unfold as pictured below.

[ from an earlier post ]

In the video below, John Doyle describes out predicament.


The situation is dire and calls for comprehensive and effective action, as described in the Climate Plan.


Links

• Climate Plan
https://arctic-news.blogspot.com/p/climateplan.html

• Arctic Sea Ice Gone By September 2019?
https://arctic-news.blogspot.com/2019/07/arctic-sea-ice-gone-by-september-2019.html

• July 2019 Hottest Month On Record
https://arctic-news.blogspot.com/2019/08/july-2019-hottest-month-on-record.html

• Cyclone over Arctic Ocean - August 24, 2019
https://arctic-news.blogspot.com/2019/08/cyclone-over-arctic-ocean-august-24-2019.html

• Most Important Message Ever
https://arctic-news.blogspot.com/2019/07/most-important-message-ever.html


Friday, August 24, 2018

The once-thickest Arctic sea ice has gone

The image below shows Arctic sea ice north of Greenland and around Ellesmere Island. This is the area where for thousands of years the sea ice has been the thickest, in many places remaining thicker than 5 meters (16.4 ft) throughout the year.

[ The once-thickest sea ice has gone - click on images to enlarge ]
The image is a compilation of NASA Worldview images over seven days, from August 14 through to August 21, 2018. The least cloudy areas have been selected from each image to get the best insight in the magnitude of this catastrophe.

The loss of this sea ice indicates that the buffer is gone. Sea ice acts as a buffer that absorbs heat, while keeping the temperature at the freezing point of water, about zero degrees Celsius. As long as there is sea ice in the water, this sea ice will keep absorbing heat, so the temperature doesn't rise at the sea surface.

Once the buffer is gone, further energy that enters the Arctic Ocean will go into heating up the water. The amount of energy absorbed by melting ice is as much as it takes to heat an equivalent mass of water from zero to 80°C.

[ The Latent Heat Buffer has gone, feedback #14 on the Feedbacks page ]
At the same time, decline of the snow and ice cover in the Arctic causes more sunlight to get reflected back into space, resulting in more energy getting absorbed in the Arctic Ocean.

[ Albedo Change, feedback #1 on the Feedbacks page ]

Numerous feedbacks are associated with sea ice loss. As the temperature difference between the Arctic and the Equator decreases, changes are taking pace to the Jet Stream that in turn trigger a multitude of further feedbacks, such as more extreme weather and a more scope for heat to enter the Arctic Ocean (see feedbacks page).


A further huge danger is that, as warming of the Arctic Ocean continues, heat will reach methane hydrates at the seafloor of the Arctic Ocean, causing them to get destabilized and release methane.

[ Seafloor methane, feedback #2 on the Feedbacks page ]
Adding up all warming elements associated with disappearance of the sea ice could result in additional global warming many times as much as the current global warming, all in a few years time.

Meanwhile, for the first time in human history, mean global methane levels as high as 1900 ppb have been recorded. The measurements were recorded by the MetOp-1 satellite on the morning of August 22, 2018, at 280 mb, 266 mb, 307 mb and 321 mb, as shown by the images below.


At 293 mb, MetOp-1 recorded an even higher level, i.e. mean global methane level was 1901 ppb on the morning of August 22, 2018.


The situation is dire and calls for comprehensive and effective action, as described in the Climate Plan.


Links

• It could be unbearably hot in many places within a few years time
https://arctic-news.blogspot.com/2016/07/it-could-be-unbearably-hot-in-many-places-within-a-few-years-time.html

• Feedbacks
https://arctic-news.blogspot.com/p/feedbacks.html

• Latent Heat
https://arctic-news.blogspot.com/p/latent-heat.html

• Albedo and more
https://arctic-news.blogspot.com/p/albedo.html

• How much warming have humans caused?
https://arctic-news.blogspot.com/2016/05/how-much-warming-have-humans-caused.html

• The Threat
https://arctic-news.blogspot.com/p/threat.html

• Extinction
https://arctic-news.blogspot.com/p/extinction.html

• Climate Plan
https://arctic-news.blogspot.com/p/climateplan.html


Monday, March 13, 2017

Methane Erupting From Arctic Ocean Seafloor

Seafloor methane often missed in measurements

Large amounts of methane are erupting from the seafloor of the Arctic Ocean. These methane eruptions are often missed by measuring stations, because these stations are located on land, while measurements are typically taken at low altitude, thus missing the methane that rises in plumes from the Arctic Ocean. By the time the methane reaches the coast, it has typically risen to higher altitudes, thus not showing up in low-altitude measurements taken at stations on land.

The image below shows the highest mean global methane levels on March 10 over the years from 2013 through 2017, for selected altitudes corresponding to 945 mb (close to sea level) to 74 mb.


The table below shows the altitude equivalents in feet (ft), meter (m) and millibar (mb).
57,016 ft44,690 ft36,850 ft30,570 ft25,544 ft19,820 ft14,385 ft 8,368 ft1,916 ft
17,378 m13,621 m11,232 m 9,318 m 7,786 m 6,041 m 4,384 m 2,551 m 584 m
 74 mb 147 mb 218 mb 293 mb 367 mb 469 mb 586 mb 742 mb 945 mb

The signature of seafloor methane

Above image shows that, over the years, methane levels have risen strongly high in the Troposphere, up into the Stratosphere. This looks like the signature of methane that originated from the seafloor of the Arctic Ocean. The image below further explains why.


The Tropopause separates the Troposphere from the Stratosphere. The Troposphere ends at a height of some 9 km (5.6 mi; 30,000 ft) at the poles, and at a height of some 17 km (11 mi; 56,000 ft) at the Equator.

As said, methane is erupting from the seafloor of the Arctic Ocean concentrated in plumes, unlike methane from wetlands and agriculture that is typically emitted over a wide area. Since seafloor methane is rising in plumes, it hardly shows up on satellite images at lower altitude either, as the methane is very concentrated inside the area of the plume, while little or no increase in methane levels is taking place outside the plume. Since the plume will cover less than half the area of one pixel, such a plume doesn't show up well at low altitudes on satellite images,

Methane over the Arctic typically does show up on satellite images at altitudes between 4.4 km and 6 km (14,400 ft and 19,800 ft). Seafloor methane will show up better at these higher altitudes where it spreads out over larger areas. At even higher altitudes, methane will then follow the Tropopause, i.e. the methane will rise in altitude while moving closer to the equator.

NOAA image

In conclusion, methane originating from the seafloor of the Arctic Ocean can strongly contribute to high methane levels that show up over the Equator at higher altitudes, but this methane can be misinterpreted for methane originating from tropical wetlands.

Methane levels as high as 2846 ppb
[ click on images to enlarge ]

On March 14, 2017, methane levels were as high as 2846 ppb, as illustrated by the image on the right. While the origin of these high levels looks hard to determine from this image, the high levels showing up over the East Siberian Arctic Shelf (ESAS) later that day (image underneath) give an ominous warning that destabilization of methane hydrates is taking place.

The images also show that high methane levels are showing up at many other places, e.g. over Antarctica where hydrate destabilization also appears to be taking place, which could also be the cause of noctilucent clouds as discussed in earlier posts (see links at end of this post).

Why is methane erupting from the Arctic Ocean?

Why are increasingly large quantities of methane erupting from the seafloor of the Arctic Ocean? The main driver is warming of the Arctic Ocean that is destabilizing once-permanently-frozen sediments that contain huge amounts of methane in the form of hydrates and free gas.

Ocean heat is increasingly entering the Arctic Ocean from the Atlantic Ocean, as illustrated by the images below. Self-reinforcing feedbacks, in particular sea ice decline, further speed up warming of the Arctic Ocean.

[ from earlier post ]

[ from earlier post ]
Self-reinforcing feedback loops

[ click on images to enlarge ]
Meanwhile, the next El Niño event has already started, at a time when sea surface temperature anomalies over the Pacific Ocean are very high as illustrated by the image on the right showing sea surface temperature anomalies east of South America as high as 5.3°C or 9.5°F (compared to 1981-2011) on February 28, 2017.

Greater contrast between sea surface temperatures and temperatures on land has contributed to flooding in California and South America.

Importantly, more water vapor in the atmosphere results in more warming, since water vapor is a potent greenhouse gas.

[ click on images to enlarge ]
Above images shows ECMWF (European Centre for Medium-Range Weather Forecasts) plumes with strong positive anomalies in all three El Niño regions (on the right).

In other words, temperatures in 2017 look set to be very high, which spells bad news for the Arctic where temperature anomalies are already several times higher than in the rest of the world.

Arctic sea ice looks set to take a steep fall, as illustrated by the image below.


The danger is that further self-reinforcing feedback loops such as albedo decline and methane releases will accelerate warming and, in combination with further warming elements, cause a temperature rise as high as 10°C or 18°F by the year 2026, as described at the extinction page.

The situation is dire and calls for comprehensive and effective action as described in the Climate Plan.


Links

• Climate Plan
http://arctic-news.blogspot.com/p/climateplan.html

• Extinction
http://arctic-news.blogspot.com/p/extinction.html

• Warning of mass extinction of species, including humans, within one decade
http://arctic-news.blogspot.com/2017/02/warning-of-mass-extinction-of-species-including-humans-within-one-decade.html

• Low sea ice extent contributes to high methane levels at both poles
http://arctic-news.blogspot.com/2017/03/low-sea-ice-extent-contributes-to-high-methane-levels-at-both-poles.html

• Noctilucent clouds indicate more methane in upper atmosphere
http://arctic-news.blogspot.com/2012/09/noctilucent-clouds-indicate-more-methane-in-upper-atmosphere.html

• Noctilucent clouds: further confirmation of large methane releases
http://methane-hydrates.blogspot.com/2013/12/noctilucent-clouds-further-confirmation-of-large-methane-releases.html