Showing posts with label sea surface. Show all posts

Monday, October 14, 2019

Arctic Ocean October 2019


Above image shows temperatures north of 80°N. The red line on the image shows the 2019 daily mean temperature up to Oct 13, 2019. The temperature is now well above the 1958-2002 mean (green line). The image also shows the freezing point of fresh water (273.15K, 0°C or 32°F, blue line).

The freezing point for salt water is lower, at around -2°C, or 28.4°F, or 271.2°K. In other words, a rise in the salt content of the water alone can make ice melt, i.e. even when the temperature of the water doesn't rise.


Above combination image shows forecasts for October 26, 2019. The left panel shows that air temperatures (2 m) are forecast to be 5.4°C higher over the Arctic than 1979-2000. Parts of the Arctic Ocean where there is no sea ice are forecast to be especially hot, since this is where heat gets transferred from the Arctic Ocean to the atmosphere. Anomalies are as high as 30°C, the top end of the scale. Temperature anomalies are in line with changes to the Jet Stream, as illustrated by the forecast in the right panel.


As above image shows, there was very little sea ice north of Greenland on October 11, 2019. Arctic sea ice extent is very low. As the image below shows, Arctic sea ice extent was 4.88 million km² on October 13, 2019, the lowest on record for the time of year.

[ click on image to enlarge ]

As the image below shows, the heat rising from the Arctic Ocean is such that sea ice extent is hardly growing.


The image below shows Arctic sea ice extent for the years, 1980,1990, 2010, 2012 and 2019, for the period as indicated.


The image below indicates that Arctic sea ice volume has been at record low levels for the time of year for some time.

Rising temperatures of water in the Arctic Ocean cause the sea ice to melt away from below. The image below, created with NOAA 2007-2019 June-September sea surface temperature data, shows heating of the sea surface on the Northern Hemisphere, with an ominous trend added.


The image indicates that a critical tipping point was crossed this year, with the disappearance of the thick sea ice that hangs underneath the surface.


This indicates that the buffer has gone that has until now been consuming ocean heat as part of the melting process. As long as there is sea ice in the water, this sea ice will keep absorbing heat as it melts, so the temperature will not rise at the sea surface. The amount of energy absorbed by melting ice is as much as it takes to heat an equivalent mass of water from zero to 80°C.

[ click on image to enlarge ]
The situation is so precarious because hot, salty water keeps flowing into the Arctic Ocean, at a time of year when the sea ice is growing in extent and sealing off the surface of the Arctic Ocean, thus reducing the heat that can get transferred to the atmosphere.

How hot is that water flowing into the Arctic Ocean? The image on the right shows sea surface temperature anomalies. On October 13, 2019, the sea surface near Svalbard at the green circle was 18.3°C or 65°F, i.e. 14.7°C or 26.4°F hotter than 1981-2011.

This is an indication of how hot the water is underneath the sea surface. At the sea surface, water gets colder due to evaporation and rain, resulting in a lid of fresh water at the surface sealing off hot and salty water underneath.

This hot and salty water moves underneath the sea surface in line with the deeper parts of the ocean, to emerge at this area near Svalbard (marker in the image below), as the water at this area becomes more shallow, making the sea current push the water to the surface.


Back in 2011, a study by Micha Ruhl et al. pointed at huge methane releases from clathrates during the end-Triassic mass extinction event, as discussed in an earlier post. The danger is that, in the absence of thick sea ice, hot water with a high salt content will reach the seafloor of the Arctic Ocean, making it easier for ice in cracks in sediments at the seafloor to melt, resulting in huge methane releases.

[ from an earlier post ]
Ominously, methane levels as high as 2961 parts per billion were recorded by the MetOp-2 satellite on October 24, 2019, in the afternoon at 469 mb.


The situation is dire and calls for comprehensive and effective action, as described in the Climate Plan.


Links

• Climate Plan
https://arctic-news.blogspot.com/p/climateplan.html

• Critical Tipping Point Crossed In July 2019
https://arctic-news.blogspot.com/2019/09/critical-tipping-point-crossed-in-july-2019.html

• Most Important Message Ever
https://arctic-news.blogspot.com/2019/07/most-important-message-ever.html

• Arctic Ocean overheating
https://arctic-news.blogspot.com/2019/09/arctic-ocean-overheating.html

• How extreme will it get?
https://arctic-news.blogspot.com/2012/07/how-extreme-will-it-get.html

• Warning Signs
https://arctic-news.blogspot.com/2018/03/warning-signs.html

Saturday, August 24, 2019

Cyclone over Arctic Ocean - August 24, 2019


As illustrated by above map, Arctic heating is accelerating, with temperatures showing up in the Arctic that are up to 4.41°C hotter than the average global temperature during 1880-1920.

The image below shows two plots. On the left-hand side is the temperature plot associated with above map, had a monthly mean been selected. To smooth the data, a 4-year running mean was chosen, and the plot on the right-hand side shows the associated global mean anomalies. Note that, due to this smoothing, only data from 1882 to August 2017 are displayed in the plot of the right-hand side.


It is appropriate to adjust the data by 0.5°C, as follows:
  1. An adjustment of 0.3°C to reflect a pre-industrial baseline (heating occurred due to people's emissions before 1880-1920);
  2. An adjustment of 0.1°C to reflect air temperatures over oceans (as opposed to sea surface temperatures);
  3. An adjustment of 0.1°C to better include polar temperatures (the top and bottom of the image at the top shows large polar areas that should not be excluded, the more so since the Arctic has the highest temperature anomalies).
The image below shows both adjusted and unadjusted data as dark blue lines, with a light-blue polynomial trend added over the adjusted data.

Such a trend can further smooth out seasonal differences and El Niño/La Niña variability.

Such a trend can also show the potential for further temperature rise in the near future, which can constitute an important warning.

This is particularly important as the trend shows that we could be crossing the 2°C guardrail this year, i.e. the threshold that was too dangerous to be crossed.

What is the danger? Arctic heating is accelerating, as the image at the top shows, and this could make global temperatures skyrocket in a matter of years. Where Arctic sea ice disappears, hot water emerges due to albedo changes and loss of the buffer that has until now been consuming heat as part of the melting process. This is illustrated by the image below showing the sea surface temperature difference from 1961-1990 in the Arctic at latitudes 60°N - 90°N on August 23, 2019.


Disappearance of Arctic sea ice comes with numerous feedbacks that further speed up the heating, as described in the recent post Arctic Sea Ice Gone By September 2019?. Heatwaves can strongly heat up the water that gets carried by rivers into the Arctic Ocean. As the image below shows, the water was as hot as 10.7°C or 51.3°F at green circle on August 20, 2019, i.e. 9.4°C or 16.9°F hotter than 1981-2011.


As the Arctic is heating up faster than the rest of the world, the Jet Stream gets more and more distorted. A cyclone is forecast over the Arctic Ocean for August 24, 2019, pulling hot air over the Arctic Ocean, resulting in temperatures at the green circle as high as 10.4°C or 50.6°F at 1000 hPa and 7.4°C or 45.2°F at surface level, as the image below shows.


The image below illustrates the distortion of the Jet Stream, moving over the Arctic Ocean on August 24, 2019.


Such a cyclone can pull huge amounts of hot air over the Arctic Ocean, while it can also devastate the sea ice with the destructive power of winds, rain and hail.


As above animation shows, Arctic sea ice is very thin and vulnerable at the moment. The cyclone also looks set to batter the sea ice at a time when huge amounts of ocean heat are entering the Arctic Ocean from the Atlantic and Pacific Oceans. More ocean heat looks set to be on the way. As the image below shows, sea surface temperatures around North America were as high as 33°C or 91.4°F on August 21, 2019.


The image below shows the worrying rise of Northern Hemisphere sea surface temperature anomalies from the 20th century average, with the added trend illustrating the danger that this rise will lead to Arctic sea ice collapse and large methane eruptions from the seafloor of the Arctic Ocean, further accelerating the temperature rise.

[ from an earlier post ]
The image below shows the cyclone over the Arctic Ocean on August 26, 2019.


The image below shows a close-up of the sea ice just north of the North Pole, on August 26, 2019.


The situation is dire and calls for comprehensive and effective action, as described in the Climate Plan.


Links

• Climate Plan
https://arctic-news.blogspot.com/p/climateplan.html

• Arctic Sea Ice Gone By September 2019?
https://arctic-news.blogspot.com/2019/07/arctic-sea-ice-gone-by-september-2019.html

• July 2019 Hottest Month On Record
https://arctic-news.blogspot.com/2019/08/july-2019-hottest-month-on-record.html


Saturday, February 2, 2019

Global Warming is destroying our Liveable Climate

Global Warming is destroying our Liveable Climate. To illustrate what's going on, have a look at the images below, showing low temperatures in Africa at 32°N latitude and high temperatures near Svalbard at about 78°N latitude.

2018 image
2019 image

Surface air temperatures near Svalbard were as high as 5.2°C or 41.4°F near Svalbard on February 3, 2019. At the same time, it was as cold as -3.5°C or 25.6°F in Africa.

The contrast was even more profound on February 4, 2018, when at those same spots it was as cold as -10°C or 13.9°F in Africa, while at the same time it was as warm as 5.8 or 42.4°F near Svalbard.

How is this possible?

As the Arctic warms up faster than the rest of the world, the temperature difference between the North Pole and the Equator narrows, making the jet stream wavier, thus enabling cold air from the Arctic to descend further south, as illustrated by the image on the right, showing instantaneous wind power density at 250 hPa (jet stream) on February 4, 2018.
[ NOAA Climate.gov cartoon by Emily Greenhalgh ]

Furthermore, as oceans get warmer, the temperature difference between land and oceans increases in Winter. This larger temperature difference results in stronger winds that can carry more warm, moist air inland, e.g. into the U.S., as illustrated by the cartoon on the right.

As the jet stream becomes wavier, this also enables more heat to enter the Arctic.

On December 8, 2018, the sea surface temperature near Svalbard was 18.2°C or 32.7°F warmer than 1981-2011. On January 23, 2019, sea surface temperatures at that spot were as high as 18.3°C or 64.9°F, as illustrated by the image on the right, from an earlier post.

A warmer sea surface can cause winds to grow dramatically stronger, and they can push warm, moist air into the Arctic, while they can also speed up sea currents that carry warm, salty water into the Arctic Ocean.

As warmer water keeps flowing into the Arctic Ocean and as air temperatures in the Arctic are now starting to rise on the back of a strengthening El Niño, fears for a Blue Ocean Event are rising.

Rivers can also carry huge amounts of warm water from North America and Siberia into the Arctic Ocean, as these areas are getting hit by ever stronger heatwaves that are hitting the Arctic earlier in the year.

With Arctic sea ice at a low, it won't be able to act as a buffer to absorb heat for long, with the danger that an influx of warm, salty water will reach the seafloor and trigger methane eruptions.

Ominously, the image below shows peak methane levels as high as 2764 ppb on February 2, 2019.


The situation is dire and calls for comprehensive and effective action, as described in the Climate Plan.

See also Dave Borlace's video below:


Links

• How frigid polar vortex blasts are connected to global warming, by Jennifer Francis
https://arctic-news.blogspot.com/2019/02/how-frigid-polar-vortex-blasts-are-connected-to-global-warming.html

• Are record snowstorms proof that global warming isn’t happening?
https://www.climate.gov/news-features/climate-qa/are-record-snowstorms-proof-global-warming-isn%E2%80%99t-happening

• Accelerating growth of carbon dioxide in the atmosphere
https://arctic-news.blogspot.com/2019/01/accelerating-growth-of-carbon-dioxide-in-the-atmosphere.html

• Dangerous situation in Arctic
https://arctic-news.blogspot.com/2018/11/dangerous-situation-in-arctic.html

• Blue Ocean Event
https://arctic-news.blogspot.com/2018/09/blue-ocean-event.html

• Climate Plan
https://arctic-news.blogspot.com/p/climateplan.html

• Extinction
https://arctic-news.blogspot.com/p/extinction.html


Tuesday, April 17, 2018

Heat Storm

[ click on images to enlarge ]
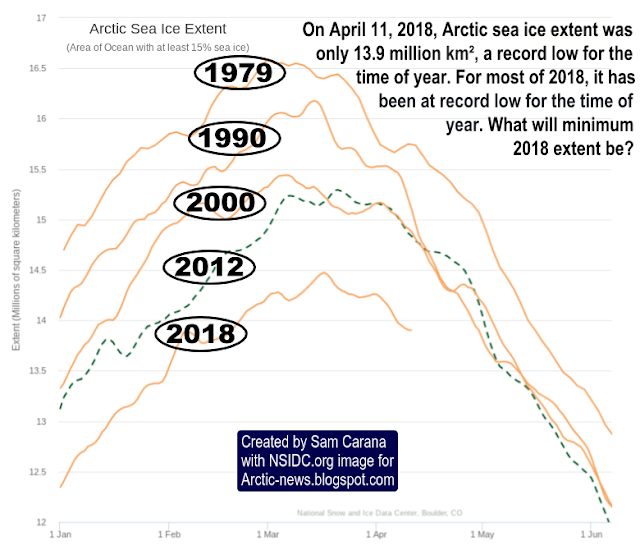
On April 11, 2018, Arctic sea ice extent was only 13.9 million km². Arctic sea ice extent has been at a record low for the time of year for most of 2018, as illustrated by above image. In 2012, extent went below 3.4 million km². The question is what minimum 2018 extent will be.

Arctic sea ice could disappear altogether in 2018. Have a look at the progressive loss of sea ice volume depicted in the image on the right, from an earlier post. Zero sea ice volume by 2018 is within the margins of the trend line contained in the data going back to 1979.

What drives volume decline is the combination of extent loss and especially thickness loss. Sea ice thickness has declined particularly where the ice once was at its thickest, i.e. north of Greenland and the Canadian Arctic Archipelago.

The combination image below shows the decline of the thicker sea ice, by comparing sea ice thickness on April 15 (run April 14) for the years 2015 through to 2018, showing that sea ice this year is entering the melting season with little or no thick sea ice left north of Greenland and the Canadian Arctic Archipelago to cope with the influx of warmer water.


The image below shows how much Bering Strait sea ice is at a historic low and the associated International Arctic Research Center post describes that this is caused by higher ocean temperatures and frequent storms.


The influx of warm water from the Atlantic Ocean and from the Pacific Ocean is melting the sea ice from below, while sunlight is melting the sea ice from above. Furthermore, warm water from rivers that end in the Arctic Ocean also contribute to melting of the sea ice, and there are numerous feedbacks that can dramatically speed up melting.

Disappearance of the sea ice means that the buffer that until now has consumed huge amounts of heat, will be gone and that heat that previously went into melting the sea ice, will instead warm up the Arctic.

Sea ice can be expected to continue its downward spiral, given the continued rise of the temperature of the sea surface in the North Atlantic Ocean and the North Pacific Ocean, as illustrated by the image below.


The sea surface is not necessarily the place where the water is at its warmest. This is illustrated by the image below, showing subsurface ocean heat in the area most relevant to El Niño/La Niña events.


[ click on images to enlarge ]
We're currently still in a La Niña period in which temperatures are suppressed, as illustrated by the Multivariate El Niño/Southern Oscillation (ENSO) Index image on the right.

As illustrated by the forecast plumes image underneath on the right, it looks like a new El Niño will arrive this summer, which will elevate temperatures from the trend.

This could result in a heat storm as early as summer 2018, in which heat waves could decimate the sea ice, while storms could push the remaining sea ice out of the Arctic Ocean.

This danger is further illustrated by the trend line in the image below, a trend that is contained in NASA LOTI data up to March 2018, adjusted by +0.79°C to better reflect the rise from preindustrial and surface air temperatures, and to better include Arctic temperatures.


[ click on images to enlarge ]
The temperature rise in the Arctic is causing decline of the sea ice extent as well as the extent of the snow cover on land.

The image on the right shows the progressive decline of the spring snow cover on land in the Northern Hemisphere.

A recent study shows that the amount of water melt from the glaciers on Mt. Hunter, Alaska, is now 60 times greater than it was before 1850.

Heat waves combined with strong rainfall due to storms could devastate the snow cover in 2018.

Decline of the snow and ice cover in the Arctic comes with a huge loss in albedo, which means that huge amounts of sunlight that were previously reflected back into space instead get absorbed by the Arctic.

The Buffer has gone, feedback #14 on the Feedbacks page
A rapid rise in temperatures in the Arctic will also accelerate changes to jet stream, which can cause huge amounts of heat from the Atlantic Ocean and the Pacific Ocean to enter the Arctic Ocean, further speeding up its warming and threatening to destabilize methane hydrates in sediments under the Arctic Ocean.

The methane will initially be felt most strongly in the Arctic, further speeding up Arctic warming which is already accelerating due to numerous feedbacks including - as said - the loss of the snow and ice cover in the Arctic, which makes that less sunlight is reflected back into space and instead adds to warming up the Arctic.

All this shouldn't come unexpected. In the video below, Guy McPherson warns that a rapid temperature rise will affect agriculture across the globe, threatening to cause a collapse of industrial civilization, in turn resulting in an abrupt halt of the sulfates that are currently co-emitted as a result of burning fuel, which will further add to a temperature rise that is already threatening to cause people across the globe to perish at massive scale, due to heatstroke, dehydration and famine, if not perish due to nuclear radiation and further toxic effects of war, as people fight over who controls the last habitable places on Earth.


Guy mentions the President of Finland, Sauli Niinistö, who in a press conference on August 28, 2017, warns that: "If we lose the Arctic, we lose the globe". The video below shows an extract of the press conference.


The situation is dire and calls for comprehensive and effective action, as described in the Climate Plan.

Links

• Climate Plan
https://arctic-news.blogspot.com/p/climateplan.html

• Feedbacks in the Arctic
https://arctic-news.blogspot.com/p/feedbacks.html

• How much warmer is it now?
https://arctic-news.blogspot.com/2018/04/how-much-warmer-is-it-now.html

• Extinction
https://arctic-news.blogspot.com/p/extinction.html

• Ten Dangers of Global Warming
https://arctic-news.blogspot.com/p/ten-dangers-of-global-warming.html

• Methane Erupting From Arctic Ocean Seafloor
https://arctic-news.blogspot.com/2017/03/methane-erupting-from-arctic-ocean-seafloor.html

• Warning of mass extinction of species, including humans, within one decade
https://arctic-news.blogspot.com/2017/02/warning-of-mass-extinction-of-species-including-humans-within-one-decade.html

• In the coastal communities near the Bering Strait, a winter unlike the rest
https://www.climate.gov/news-features/features/coastal-communities-near-bering-strait-winter-unlike-rest

• A 400‐Year Ice Core Melt Layer Record of Summertime Warming in the Alaska Range
https://agupubs.onlinelibrary.wiley.com/doi/abs/10.1002/2017JD027539

• Warning Signs
https://arctic-news.blogspot.com/2018/03/warning-signs.html


Tuesday, January 2, 2018

Unfolding Arctic Catastrophe

On January 1, 2018, methane levels as high as 2764 ppb (parts per billion) were recorded. The solid magenta-colored areas near Greenland indicate that this very high reading was likely caused by methane hydrate destabilization in the sediments on the seafloor of the Arctic Ocean.


The state of the sea ice is behind this. On January 1, 2018, Arctic sea ice extent was at record low for the time of the year. The smaller the extent, the less sunlight gets reflected back into space and is instead absorbed in the Arctic.

At this time of year, though, hardly any sunshine is reaching the Arctic. So, what triggered this destabilization? As the image below indicates, year-to-date average Arctic sea ice volume has been at record low in 2017, which means that there has been very little sea ice underneath the surface throughout 2017.


Warm water will melt the sea ice from below, which keeps the water at greater depth cool. However, when there is little or no sea ice underneath the surface, little or no heat will be absorbed by the process of melting and the heat instead stays in the water, with the danger that it will reach sediments at the bottom of the Arctic Ocean, as illustrated by the image below.

The Buffer has gone, feedback #14 on the Feedbacks page
[ image from: Warming is accelerating ]
The image on the right shows warm water from the North Atlantic arriving near Svalbard. How warm is the water beneath the surface of the Arctic Ocean? The image below gives an indication, showing how much warmer the water was from October 1, 2017, to December 30, 2017, at selected areas near Svalbard, where warm water from the North Atlantic dives under the sea ice of the Arctic Ocean, carried by the Gulf Stream.

[ click on images to enlarge ]
In 1981-2011, temperatures were gradually falling by more than one degree Celsius from October 1 to the December 21 Solstice, then started to rise again in line with the change in seasons (blue line). In 2017, temperatures were rising in October. On October 25, 2017, the sea surface was as warm as 17.5°C or 63.5°F, i.e. a 14.1°C or 24.5°F anomaly. On average, it was 12.96°C or 23.35°F warmer during the period from October 1 to December 30, 2017 (red line), compared to the same days in 1981-2011.

The images below further illustrate the situation. Surface temperature of the atmosphere near Svalbard was as warm as 7°C or 44.5°F on January 13, 2018 (at green circle, left panel). The sea surface near Svalbard was as warm as 15.9°C or 60.8°F on January 12, 2018, compared to 2.4°C or 36.4°F on January 12 for the period 1981-2011 (at green circle, center panel). Waves as high as 13.04 m or 42.8 ft (at green circle, right panel) batter the North Atlantic along Norway's coast all the way to Svalbard on January 15, 2018.


The image below shows that waves as high as 16.01 m or 52.5 ft are forecast to batter the North Atlantic on January 16, 2018 (green circle, left panel). 100% relative humidity is recorded over the Arctic Ocean on January 15, 2018 (green circle, center panel). The Jet Stream reaches speeds as high as 426 km/h or 264 mph on January 15, 2018 (green circle, right panel).


Similar extreme weather patterns can be seen elsewhere in the Arctic. The image below on the left shows that temperatures as high as 18.5°C or 65.3°F were recorded on Jan. 14 and 15, 2018 in Metlakatla, Alaska. The image below on the right shows that surface temperatures as high as 7.4°C or 45.2°F were reached on January 16, 2018, in Yukon Territory, Canada (at green circle).

[ click on images to enlarge ]

In conclusion, as the Arctic is warming up faster than the rest of the world, Jet Streams are getting more wavy, resulting in more extreme weather events. Wind speed accelerates over warmer oceans, pushing more heat into the Arctic Ocean, threatening to cause eruptions of huge amounts of methane from the Arctic Ocean seafloor.

The situation is dire and calls for comprehensive and effective action as described at the Climate Plan.


Links

• Climate Plan
https://arctic-news.blogspot.com/p/climateplan.html

• Warming is accelerating
https://arctic-news.blogspot.com/2017/11/warming-is-accelerating.html

• Feedbacks
https://arctic-news.blogspot.com/p/feedbacks.html

• 10°C or 18°F warmer by 2021?
https://arctic-news.blogspot.com/2017/04/10c-or-18f-warmer-by-2021.html

• Abrupt Warming - How Much And How Fast?
https://arctic-news.blogspot.com/2017/05/abrupt-warming-how-much-and-how-fast.html

• Accelerating growth in CO₂ levels in the atmosphere
https://arctic-news.blogspot.com/2017/02/accelerating-growth-in-co2-levels-in-the-atmosphere.html

• High methane levels over the Arctic Ocean on January 14, 2014
https://arctic-news.blogspot.com/2014/01/high-methane-levels-over-the-arctic-ocean-on-january-14-2014.html

• Extinction
https://arctic-news.blogspot.com/p/extinction.html

• Methane Erupting From Arctic Ocean Seafloor
https://arctic-news.blogspot.com/2017/03/methane-erupting-from-arctic-ocean-seafloor.html

• 2015 warmest year on record
https://arctic-news.blogspot.com/2015/12/2015-warmest-year-on-record.html

• Accelerating Warming of the Arctic Ocean
https://arctic-news.blogspot.com/2016/12/accelerating-warming-of-the-arctic-ocean.html

• Arctic Ocean Feedbacks
https://arctic-news.blogspot.com/2017/01/arctic-ocean-feedbacks.html

• Warning of mass extinction of species, including humans, within one decade
https://arctic-news.blogspot.com/2017/02/warning-of-mass-extinction-of-species-including-humans-within-one-decade.html