Showing posts with label ocean. Show all posts

Friday, October 15, 2021

Will COP26 in Glasgow deliver?


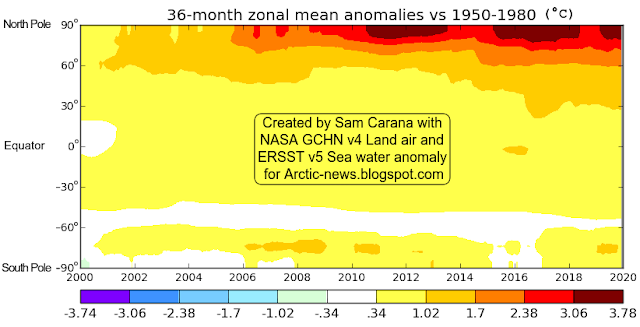
September 2021 was the second warmest September on record, after September 2020, according to NASA, Copernicus and James Hansen, despite the cooling effect of the current La Niña. Above NASA map shows that the Arctic Ocean was hit severely by high temperatures.

The NASA map shows an anomaly of 0.96°C compared to 1951-1980. With COP26 to be held in Glasgow, from October 31 to November 12, 2021, it's important to realize that using the period from 1951 to 1980 as a base is not the same as pre-industrial. So, how much has the temperature risen from pre-industrial and what are the prospects? Will COP26 deliver?

[ from earlier post ]
Let's do the calculations once more. The trend in the image below indicates that the NASA data need to be adjusted by 0.29°C to change the base from 1951-1980 to 1900. 


Of course, 1900 is still not pre-industrial. The chart below shows three trends:
  1. The green trend is based on unadjusted NASA data (1951-1980 base). 
  2. The lilac trend is based on data adjusted by 0.79°C for a 1750 base, for higher polar anomalies and for ocean air temperatures. The lilac trend shows that the 1.5°C threshold was already crossed when the Paris Agreement was adopted in 2015, while a 3°C could be crossed well before 2050.
  3. The red trend is based on data adjusted by 1.28°C, adding an extra 0.49°C to the lilac data for a 3480 BC base. The red trend shows that the 2°C threshold was already crossed when the Paris Agreement was adopted in 2015, while a 5°C anomaly could crossed by 2060.

The way these adjustments are calculated is also discussed in an earlier post and at the pre-industrial page.

Another thing to consider is the impact of short-term variables. The chart below shows the same red data, i.e. 1.28°C adjusted, with two trends added: a red trend based on 1880-Sept. 2021 data, and a blue trend based on 2015-Sept. 2021 data.


The blue trend is more in line with short-term variables, such as El Niño, sunspots and volcanoes. The blue trend shows that temperatures are currently suppressed.

Within a few years time, sunspots can be expected to reach the peak of their current cycle, and they are looking stronger than forecast, as illustrated by the image on the right, adapted from NOAA.

Furthermore, the next El Niño could raise surface temperatures significantly. The image below indicates that the difference between the top of El Niño and the bottom of La Niña could be more than half a degree Celsius.

As the image on the right shows, NOAA expects the current La Nina to deepen and to continue well into 2022. 

The threatening situation is that we'll go into the next El Niño, while sunspots are increasing and while the aerosol impacts may go from dimming into further driving up temperatures. A huge temperature rise could occur as the sulfates fall away that are currently co-emitted by traffic and industry, while at the same time releases of other aerosols such as black and brown carbon can increase dramatically as more wood burning and forest fires take place.

Such short-term natural variability can furthermore act as a catalyst, causing numerous feedbacks to kick in with ever greater ferocity.


Such feedbacks can result in collapse of Arctic sea ice and eruption of huge quantities of carbon dioxide, methane and nitrous oxide, further driving up the temperature rise abruptly, as illustrated by the blue trend in the image further above. 

The World Meteorological Organization (WMO) has released 2020 figures for carbon dioxide (CO₂), which reached 413.2 parts per million (ppm) in 2020, 149% of the 1750 level. Methane (CH₄) reached 1889 parts per billion (ppb) in 2020, 262% of the 1750 level and nitrous oxide (N₂O) reached 333.2 ppb, 123% of the 1750 level.

“The last time the Earth experienced a comparable concentration of CO₂ was 3-5 million years ago, when the temperature was 2-3°C warmer and sea level was 10-20 meters higher than now”, said WMO Secretary-General Prof. Petteri Taalas.

Sadly, the IPCC appears to have dramatically underplayed the gravity of the situation. The image on the right, from James Hansen, shows the gap between RCP 2.6 and added forcing since 1990.

The image below, from Tian et al. (2020), shows differences between the RCP and SSP pathways for nitrous oxide.


[ from earlier post ]
The image on the right, from an earlier post, illustrates the rise in nitrous oxide levels up April 2020.

Perhaps even more frightening is the situation regarding methane, as illustrated by the combination image below. The MetOp-2 satellite recorded some terrifying methane levels recently. On October 14, 2021 pm, a peak methane level of 4354 ppb was recorded at 293 mb (left panel), while a mean level of 2068 ppb was recorded at 367 mb (right panel). The images show only a partial cover of the globe, so there may be some problems with this satellite, yet it could be an ominous sign of things to come.


No images were available for the MetOp-2 satellite the next day, October 15, 2021. Further complicating things, no images were available for two further satellites either, the SNPP satellite and the NOAA 20 satellite. 


Very few methane measurements are available for the Arctic. Measurements are available from only a handful of ground stations, i.e. flask and in situ data at Barrow, Alaska, and flask data at Cold Bay, Alaska, at Ny-Alesund, Svalbard, at Alert, Nunavut, and at Summit, Greenland, while one-off measurements have been taken by vessels and by aircraft, such as at Poker Flats, near Fairbanks, Alaska. Availability of flask data stopped in 1997 at Mould Bay, Northwest Territories, and in 2018 at Tiksi, Russia. Moreover, to monitor methane releases from the seafloor of the Arctic Ocean, it is essential to have more continuous measurements taken at numerous altitudes by polar-orbiting satellites. And of course, taking measurements alone is not enough to reduce the danger.

Meanwhile, NOAA has put up a notice that IASI data and products from Metop-A (MetOp-2) will no longer update and the satellite will be retired on November 15, 2021.

Data from the MetOp-1 satellite are still available. The animation on the right shows methane as recorded by the MetOp-1 satellite on October 16, 2021 pm from 972 mb (roughly sea level) to 766 mb (some 2.3 km or 7,546 ft).

The magenta color indicates the highest methane levels. The animation shows that magenta-colored areas (with the highest levels) first show up over the Arctic Ocean, close to sea level. When rising up further toward the Tropopause, beyond what the animation shows, even more magenta shows up, with methane moving toward the Equator, as the Tropopause is higher closer to the Equator. 

The image on the right shows the situation on October 25, 2021 am at 295 mb, which is at an altitude of about 9 km (5.592 miles), where the tropopause starts over the North Pole. 

The image shows that the mean global methane level at this altitude was 1958 ppb. Very high methane levels show up over the high Arctic, as indicated by the magenta color. The image further shows the strong accumulation of methane at this altitude.

Below is an image by Copernicus, showing methane at 500 hPa on October 16, 2021 at 03 UTC. 


As said, the IPCC sadly keeps downplaying the temperature rise and the threat of a huge rise soon, while promoting the idea that there was a “carbon budget” to be divided among polluters that would enable polluters to keep polluting for decades to come. Hopefully, politicians at COP26 will do the right thing. The situation is dire and calls for the most comprehensive and effective action, as described at the Climate Plan.


Links

• NASA GISS Surface Temperature Analysis (GISTEMP v4)
https://data.giss.nasa.gov/gistemp/

• Glasgow Climate Change Conference (COP26)
https://unfccc.int/process-and-meetings/conferences/glasgow-climate-change-conference

• IPCC special report on the impacts of global warming of 1.5 °C above pre-industrial levels and related global greenhouse gas emission pathways (SR1.5)
https://report.ipcc.ch/sr15/

• IPCC AR6
https://www.ipcc.ch/assessment-report/ar6/

• Paris Agreement, adopted 2015
https://unfccc.int/sites/default/files/resource/docs/2015/cop21/eng/l09r01.pdf
https://arctic-news.blogspot.com/2015/12/paris-agreement.html

• WMO - Greenhouse Gas Bulletin: Another Year Another Record
https://public.wmo.int/en/media/press-release/greenhouse-gas-bulletin-another-year-another-record
https://library.wmo.int/index.php?lvl=notice_display&id=21975

• MetOp satellites
https://www.ospo.noaa.gov/Products/atmosphere/soundings/iasi/

• Copernicus - methane
https://atmosphere.copernicus.eu/charts/cams/methane-forecasts

• September Temperature Update & COP 26 - 14 October 2021 - by James Hansen and Makiko Sato

• NOAA Sunspots

• A comprehensive quantification of global nitrous oxide sources and sinks - by Hanqin Tian et al. (2020)
https://www.nature.com/articles/s41586-020-2780-0

• NOAA - ENSO: Recent Evolution, Current Status and Predictions - October 11, 2021
https://arctic-news.blogspot.com/2021/08/is-the-ipcc-creating-false-perceptions-again.html

• Pre-industrial

• Feedbacks
https://arctic-news.blogspot.com/p/feedbacks.html

• Climate Plan
https://arctic-news.blogspot.com/p/climateplan.html

Tuesday, August 3, 2021

Climate Change Henchmen: Storm, Flood, Heat, Smoke and Fire

As climate change strikes with ever greater ferocity, five henchmen dominate the news: Storm, Flood, Heat, Smoke and Fire.


During the first 6 months of 2021, there have been 8 separate billion-dollar weather and climate disaster events across the United States. The U.S. has sustained 298 weather and climate disasters since 1980 where overall damages/costs reached or exceeded $1 billion (including CPI adjustment to 2020). The total cost of these 298 events exceeds $1.975 trillion. The total cost over the last 5 complete years (2016-2020) exceeds $630.0 billion — averaging more than $125.0 billion/year — both new records.

The image on the right shows very high temperatures over North America end July 2021, with fire radiative power as high as 247.3 MW.

The NASA Worldview satellite image below shows large smoke plumes on July 7, 2021, reaching Hudson Bay. Furthermore, large smoke plumes are also visible over British Columbia.


The NASA Worldview satellite image below shows smoke traveling from the West Coast to the East Coast of the U.S. on July 26, 2021.


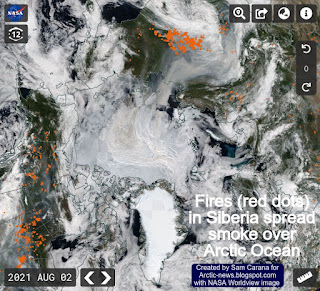
The Copernicus image on the right shows Siberian fires spreading aerosols over the Arctic Ocean on August 2, 2021 

The NASA Worldview satellite image underneath on the right shows fires (red dots) in Siberia spreading smoke over the Arctic Ocean on August 2, 2021. 

Mainstream media do cover such disasters, often with sensational footage and while pointing at the extensive damage and loss of life caused by such events. 

However, mainstream media rarely point out that climate change is getting worse and and even more so due to feedbacks that can amplify extreme weather events and can further speed up how climate change unfolds.

One of these feedbacks is albedo loss, i.e. decline of the snow and ice cover resulting in less sunlight getting reflected back into space. Fires also come with soot that can settle on snow and ice, resulting in surface darkening that will speed up melting and albedo loss. 

The rapid thinning of Arctic sea ice was discussed in an earlier post and is again illustrated by the image on the right.

The image shows the sea ice (or rather the lack of it) north of Greenland on August 15, 2021. This is where years ago the thickest sea ice was located.

The melt season will continue for at least another month time, so the situation is very worrying, since the disappearance of the thicker sea ice means that the buffer is gone, i.e. that the latent heat tipping point of Arctic sea ice has been crossed.

Here's a link to compare the sea ice north of Greenland between July 29, 2021, and August 15, 2021.

The NSIDC image on the right shows that the proportion of multiyear ice in the Arctic during the first week of August was at 1.6 million km² (618,000 million miles²).

NSIDC adds: The loss of the multiyear ice since the early 1980s started in earnest after the 2007 record low minimum sea ice cover that summer, and while there have been slight recoveries since then, it has not recovered to values seen in the 1980s, 1990s, or early 2000s. This loss of the oldest and thickest ice in the Arctic Ocean is one of the reasons why the summer sea ice extent has not recovered, even when weather conditions are favorable for ice retention.

The Naval Research Lab animation on the right shows Arctic sea ice thickness (in m) for the 30 days up to August 27, 2021, with eight days of forecasts included. 

As the temperature difference between the North Pole and the Equator narrows, the wind flowing north on the Northern Hemisphere slows down, which changes the Jet Stream, resulting in more extreme weather events, including heatwaves and fires. 

One of the most dangerous feedbacks is that, as temperatures of the water of the Arctic Ocean keeps rising, more heat will reach sediments under the Arctic Ocean where huge amounts of methane are stored, causing destabilization. 

[ from the feedbacks page ]
This destabilization threatens to cause huge quantities of methane to erupt and enter the atmosphere, as has been discussed in many earlier posts such as this one and this one

This threat becomes dramatically larger as the latent heat threshold gets crossed and the buffer constituted by Arctic sea ice disappears, so further heat entering the Arctic Ocean from the Atlantic Ocean and the Pacific Ocean can no longer be consumed in the process of melting the subsurface sea ice. 

Ominously, the MetOp-2 satellite recorded a methane level of 2839 ppb at 469 mb on July 30, 2021 pm, as the image on the right shows.

[ peak methane level of 2839 ppb ]
The image underneath shows large quantities of methane over the East Siberian Arctic Shelf (ESAS) at 469 mb on August 4, 2021 pm. 

On August 4, 2021, there still was some sea ice present in the ESAS. While this remaining sea ice does prevent a lot of sunlight from reaching the water and heating it up, the sea ice also acts as a seal, preventing ocean heat from getting transferred to the atmosphere. The water in the ESAS is very shallow, less than 50 meter in most places, which makes it easier for heat to reach sediments, while it also makes it harder for methane that is rising through the water column to get decomposed by microbes in the water.

[ large quantities of methane over ESAS ]
The image underneath shows that on August 4, 2021 am, at 293 mb, the MetOp-1 satellite recorded a mean global methane level of 1942 ppb. 

At a 1-year Global Warming Potential (GWP) of 200, this translates into 388.2 ppm CO₂e. By comparison, the CO₂ level on August 4, 2021, was 414.89 ppm according to the Keeling Curve measurements at Mauna Loa, Hawaii. A GWP of 200 for methane is appropriate in the light of the danger of a huge burst of methane erupting from the seafloor of the Arctic Ocean, which would, due to the abrupt nature of such an eruption, make its impact felt instantaneously. 

[ mean global methane level of 1941 ppb ]
Methane levels are already very high over the Arctic, so additional methane erupting there will be felt most strongly in the Arctic itself, thus threatening to trigger even further methane releases.

The situation is dire and calls for immediate, comprehensive and effective action as described in the Climate Plan.


Links


• NOAA Billion-Dollar Weather and Climate Disasters: Time Series

• Copernicus - aerosols

• MetOp methane levels

• NSIDC: Arctic Sea Ice News & Analysis - August 18, 2021

• Heatwaves and the danger of the Arctic Ocean heating up 
https://arctic-news.blogspot.com/2021/06/heatwaves-and-the-danger-of-the-arctic-ocean-heating-up.html

• Arctic sea ice disappearing fast

• When will we die?

• Most Important Message Ever


Saturday, July 3, 2021

A Temperature Rise Of More Than 18 Degrees Celsius By 2026?

On July 1, 2021 pm, the MetOp-1 satellite recorded a mean methane level of 1935 ppb at 293 mb.

[ from earlier post ]
This mean methane level translates into 387 ppm CO₂e at a 1-year Global Warming Potential (GWP) of 200. 

This GWP is appropriate in the light of the danger of a huge burst of methane erupting from the seafloor of the Arctic Ocean, which would, due to the abrupt nature of such an eruption, make its impact felt instantaneously.

Carbon dioxide on July 1, 2021, was 418.33 ppm, as illustrated by the NOAA image below.


Together, this CO₂e level of methane and this carbon dioxide level add up to 805.33 ppm CO₂e, which is 394.67 ppm CO₂e away from the 1200 ppm clouds tipping point which on its own could increase the temperature rise by a further 8°C, as discussed in an earlier post.

This 394.67 ppm CO₂e, again at a 1-year GWP of 200, translates into 1973 ppb of methane. In other words, a methane burst of 1973 ppb or about 5 Gt of methane would suffice to trigger the clouds feedback, adding a further 8°C to the temperature rise, as depicted in the image below. 


A 5 Gt seafloor methane burst would double methane in the atmosphere and could instantly raise the CO₂e level to 1200 ppm and trigger the clouds feedback (top right panel of above chart).

[ from earlier post ]
Even without such a huge eruption of methane from the seafloor, there are further pollutants than just carbon dioxide and methane, such as nitrous oxide, nitrogen oxides, CFCs, carbon monoxide, black carbon, brown carbon and water vapor, and they haven't yet been included in the above CO₂e total. The levels of all these pollutants could rise strongly in a matter of years and feedbacks could start kicking in with much greater ferocity, while the resulting extreme weather events would cause sulfate cooling to end, resulting in an 18.43°C temperature rise that could be reached as early as 2026 (left panel of above chart). 

To further illustrate this, the image on the right shows a trend that is based on NOAA 2006-2020 annual global mean methane data and that points at a mean of 3893 ppb getting crossed by the end of 2026, more than twice the 1935 ppb mean methane level of the image at the top.

Such a high mean methane level by 2026 cannot be ruled out, given the rapid recent growth in mean annual methane levels (15.85 ppb in 2020, see inset on image). And, as said, there are further pollutants, in addition to methane, and additional feedbacks to take into account. 

As discussed in an earlier post, humans will likely go extinct with a 3°C rise, while a 5°C rise will likely end most life on Earth. The temperature rise from pre-industrial to 2020 may well be as large as 2.28°C, as the bottom figure in the bar on the left of above chart shows and as discussed in an earlier post.

Will the IPCC get its act together?

Meanwhile, the IPCC plans to release its next report, the Working Group I contribution to the Sixth Assessment Report (AR6), on August 9, 2021, in the lead up to the COP 26 UN Climate Change Conference, from October 31 to November 12, 2021 in Glasgow, UK. Given their track record, the IPCC and politicians may be reluctant to even consider the information in this post, but it clearly is high time for the IPCC to get its act together. 


The IPCC said, in SR15_FAQ, that the "global temperature is currently rising by 0.2°C (±0.1°C) per decade, human-induced warming reached 1°C above pre-industrial levels around 2017 and, if this pace of warming continues, would reach 1.5°C around 2040." 

Sam Carana: "The temperature rise for the most recent decade (2011-2020) is 0.41°C (NASA data) and the rise from pre-industrial may be 2.28°C, so if this pace continued, 3.11°C could be reached by 2040 and humans will likely go extinct with a 3°C rise. Worse, the rise is accelerating and a rise of as much as 18.43°C could occur by 2026."

Potential temperature rise from pre-industrial to 2026

We face the threat of a potential temperature rise from pre-industrial to 2026 of 18.43°C and the eventual disappearance of all life from Earth, as illustrated by the image below. NASA data shows a 1920-2020 temperature rise of 1.29°C. To calculate the rise from pre-industrial, 0.29°C is added for the 3480 BC-1520 rise, 0.2°C for 1520-1750 and 0.3°C for 1750-1920, while 0.1°C is added to reflect higher polar anomalies and 0.1°C for air temperatures, adding up to a rise of 2.28°C from pre-industrial. A temperature rise of a further 16.15°C could happen by 2026, adding up to a total potential temperature rise of 18.43°C from pre-industrial to 2026. Most species will likely go extinct with a 5°C rise, but humans will likely go extinct with a 3°C rise and eventually, all life would disappear from Earth, as discussed in an earlier post.


In the video below, Guy McPherson comments on the IPCC.


EPA could and should act now

In the US, Joe Biden could simply instruct the EPA to enforce tighter standards. The US supreme court ruled on June 26, 2006, that the EPA has the authority to set standards for greenhouse gas emissions. In 2009, the EPA confirmed that greenhouse gas emissions are pollutants that endanger public health and welfare through their impacts on climate change and admitted that the EPA has the responsibility and the duty to regulate greenhouse gas emissions, and it took until August 3, 2015, for the EPA to issue the Clean Power Plan, giving states a number of choices how to reach set targets for CO₂ emissions. In the light of recent scientific findings and in line with the Paris Agreement, adopted on 12 December 2015, it now makes sense for the EPA to strengthen these targets and enforce this without delay.

Conclusion

The situation is clearly dire and calls for more immediate, more comprehensive and more effective action, as described in the Climate Plan.


Links

• Climate Plan
https://arctic-news.blogspot.com/p/climateplan.html

• Could temperatures keep rising?

• Confirm Methane's Importance
https://arctic-news.blogspot.com/2021/03/confirm-methanes-importance.html

• When Will We Die?
https://arctic-news.blogspot.com/2019/06/when-will-we-die.html

• Overshoot or Omnicide?
https://arctic-news.blogspot.com/2021/03/overshoot-or-omnicide.html

• NASA, Goddard Institute for Space Studies (GISS)
https://data.giss.nasa.gov/gistemp

• IPCC:  Frequently Asked Questions, Special Report on Global Warming of 1.5°C
https://www.ipcc.ch/site/assets/uploads/sites/2/2018/12/SR15_FAQ_Low_Res.pdf

• Possible climate transitions from breakup of stratocumulus decks under greenhouse warming - by Tapio Schneider et al.
https://www.nature.com/articles/s41561-019-0310-1

• Most Important Message Ever
https://arctic-news.blogspot.com/2019/07/most-important-message-ever.html

• Heatwaves and the danger of the Arctic Ocean heating up

• Science Update: Continued IPCC Conservatism and Lies - by Guy McPherson


Monday, June 28, 2021

Heatwaves and the danger of the Arctic Ocean heating up

 Heatwaves and Jet Stream Changes

Heatwaves are increasingly hitting higher latitudes, as illustrated by the forecasts below. The background behind this is that the temperature rise caused by people's emissions is also causing changes to the jet streams. 

[ click on images to enlarge ]

These changes to the Jet Stream are increasingly creating conditions for heatwaves to strike at very high latitudes, as also illustrated by the images on the right.

The first image on the right shows that surface temperatures as high as 48°C or 118.3°F are forecast in the State of Washington for June 30, 2021, at 01:00 UTC, at a latitude of 46.25°N. At the same time, even higher temperatures are forecast nearby at 1000 hPa level (temperatures as high as 119.4°C or 48.6°C). 

The next two images on the right show what happened to the jet stream. One image shows instantaneous wind power density at 250 hPa, i.e. at an altitude where the jet stream circumnavigates the globe, on June 26, 2021 at 11:00 UTC. The image features two green circles. The top green circle marks a location where the jet stream is quite forceful and reaches a speed of 273 km/h or 170 mph. The bottom green circle marks the same location where the 48°C is forecast on June 30, 2021. This shows how heat has been able to move north from as early as June 26, 2021.

The next image on the right shows the situation on June 30, 2021, 04:00 UTC, illustrating how such a jet stream pattern can remain in place (blocked) for several days (in this case for more than five days). The green circle again marks the same location where the 48°C is forecast (in the top image on the right).

This illustrates how a more wavy jet stream can enable high temperatures to rise to higher latitudes, while holding a pattern in place for several days, thus pushing up temperatures over time in the area.  

As said, these changes in the jet stream that are enabling hot air to rise up to high latitudes are caused by global warming. Accelerating warming in the Arctic is causing the temperature difference between the North Pole and the Equator to narrow, which in turn is making the jet stream more wavy.

The next image on the right shows that a UV index reading as high as 12 (extreme) is forecast for a location at 51.56°N in Washington for June 28, 2021, illustrating that such an extreme level of UV can occur at high latitudes, due to changes in the jet stream.

Accelerated Warming in the Arctic


As the temperature rise is accelerating due to people's emissions, it is speeding up more in the Arctic than anywhere else on Earth. 

The Arctic is heating up faster than elsewhere, as numerous feedbacks and tipping points are hitting the Arctic, including:

• Albedo loss goes hand in hand with decline of the snow and ice cover. Albedo is a measure of reflectivity of the surface. Albedo is higher as more sunlight is reflected back upward and less energy is getting absorbed at the surface. Albedo decline can occur as snow and ice disappears and the underlying darker soil and rock becomes exposed. Even when the snow and ice cover remains extensive, its reflectivity can decline, due to cracks and holes in the ice, due to formation of melt ponds on top of the ice and due to changes in texture (melting snow and ice reflects less light). Calving of the ice can take place where warmer water can reach it, and such calving can increase as storms strengthen and waves get larger.

• Furthermore, albedo loss can occur as dust, soot and organic compounds that are caused by human activities get deposited on the snow and ice cover, reducing the reflectivity of the surface. Organic compounds and nutrients in meltwater pools can lead to rapid growth of algae, especially at times of high insolation.

• Latent heat loss. As sea ice gets thinner, ever less ocean heat gets consumed in the process of melting the subsurface ice, to the point where - as long as air temperatures are still low enough - there still is a thin layer of ice at the surface that will still consume some heat below the surface, but that at the same time acts as a seal, preventing heat from the Arctic Ocean to enter the atmosphere.

• Wind changes including changes to the Jet Stream can further amplify the temperature rise in the Arctic. As the temperature difference between the North Pole and the Equator narrows, the Jet Stream becomes more wavy, spreading out widely at times. The changes to the jet stream cause more extreme weather, including heatwaves, forest fires, storms, flooding, etc. This can cause more aerosols to get deposited on the snow and ice cover. Stronger wind and storms over the North Atlantic can also speed up the flow of warm water into the Arctic Ocean.

Albedo loss, latent heat loss and changes to wind patterns can dramatically amplify the temperature rise in the Arctic. The temperature of the Arctic Ocean is rising accordingly, while there are a number of developments and events that specifically speed up the temperature rise of the water of the Arctic Ocean, as discussed below.


Arctic Ocean heating up

The temperature of the water of the Arctic Ocean is rising, due to a number of events and developments:
                 [ from the insolation page ]
  • Solstice occurred on June 21, 2021. The Arctic is now receiving huge amounts of sunlight (see image on the right, from the insolation page).

  • Sea surface temperatures and temperatures on land are very high in Siberia, Canada and Alaska. Strong winds can spread warm air over the Arctic Ocean.

  • Arctic sea ice extent is low for the time of year, but at this stage, there still is a lot of sea ice present (compared to September). The sea ice acts as a seal, preventing ocean heat from entering the atmosphere, resulting in more heat remaining in the Arctic Ocean.

[ Lena River, Siberia ]

  • Warm water from rivers is flowing into the Arctic Ocean, carrying further heat into the Arctic Ocean. Above image shows that on June 23, 2021, sea surface temperatures were 22.3°C or 72.2°F at a spot where water from the Lena River flows into the Arctic Ocean. The image on the right shows that at a nearby location the sea surface temperature was 20°C or 36°F higher than 1981-2011. 

  • Warm water from the North Atlantic Ocean and the North Pacific Ocean is flowing into the Arctic Ocean and the amount of ocean heat flowing into the Arctic Ocean is rising each year.

  • As mentioned above, latent heat loss is contributing to the rapid temperature rise in the Arctic. The remaining sea ice acts as a buffer, consuming ocean heat from below. Sea ice is getting thinner each year, so ever less ocean heat can get consumed in the process of melting the sea ice from below.

  • Changes to the jet stream can also cause strong storms to dramatically speed up the amount of heat flowing into the Arctic Ocean, as discussed at the Cold freshwater lid on North Atlantic page.

The danger of the temperature rise of the Arctic Ocean

The danger of the temperature rise of the Arctic Ocean is that it can cause destabilization of hydrates at its seafloor, resulting in eruption of huge amounts of methane from hydrates and from free gas underneath the hydrates.

[ The Buffer has gone, feedback #14 on the Feedbacks page ]

In conclusion, changes to the jet stream could cause a huge temperature rise soon, while a 3°C rise could cause humans to go extinct, which is a daunting prospect. Even so, the right thing to do is to help avoid the worst things from happening, through comprehensive and effective action as described in the Climate Plan.

• Insolation

• Cold freshwater lid on North Atlantic

• Most Important Message Ever
https://arctic-news.blogspot.com/2019/07/most-important-message-ever.html

• Could temperatures keep rising?

• Latent Heat


Thursday, June 3, 2021

Greenhouse gas levels keep rising at accelerating rates

At the Paris Agreement in 2015, politicians pledged to limit the global temperature rise from pre-industrial levels to 1.5°C and promised to stop rises in greenhouse gas emissions as soon as possible and to make rapid reductions in accordance with best available science, to achieve a balance between people's emissions by sources and removals by sinks of greenhouse gases in the second half of this century. 

Yet, greenhouse gas levels keep rising and the rise appears to be accelerating. 

Carbon Dioxide

The annual mean global growth rate of carbon dioxide (CO₂) has been increasing over the years (see above image). The February 2021 global CO₂ level was 2.96 ppm higher than the February 2020 global CO₂ level (image left).
The March 2021 global CO₂ level was 2.89 ppm higher than the March 2020 global CO₂ level (image left), again much higher than the average annual growth rate over the past decade. No discernible signal in the data was caused by restrictions associated with the COVID-19 pandemic.

More recent values are available for Mauna Loa, Hawaii. As the image on the right shows, the monthly average CO₂ level at Mauna Loa was 419.13 ppm for May 2021, while the weekly average was as high as 420.01 ppm (for the week ending at May 1, 2021). 

On April 8, 2021, CO₂ levels at Mauna Loa, Hawaii, reached a level of 421.36 ppm, while several hourly averages recorded in early April were approaching 422 ppm (see earlier post).

According to NOAA, the atmospheric burden of CO₂ is now comparable to where it was during the Pliocene Climatic Optimum, between 4.1 and 4.5 million years ago, when CO₂ was close to, or above 400 ppm. During that time, the average temperature was about 4°C (7°F) higher than in pre-industrial times, and sea level was about 24 m (78 feet) higher than today.

Methane
 
The 2020 global annual methane (CH₄) growth rate of 15.85 ppb was the highest on record. The global CH₄ level in January 2021 was 1893.4 ppb, 20 ppb higher than the January 2020 level. 

The image at the top shows a trend indicating that CH₄ could reach a level of 4000 ppb in 2026, which at a 1-year GWP of 200 translates into 800 ppm CO₂e, so just adding this to the current CO₂ level would cause the Clouds Tipping Point at 1200 CO₂e to be crossed, which in itself could raise global temperatures by 8°C, as described in an earlier post

Nitrous Oxide

The 2020 global annual nitrous oxide (N₂O) growth rate of 1.33 ppb was the highest on record. The global N₂O level in January 2021 was 333.9 ppb, 1.4 ppb higher than the January 2020 level. 

Greenhouse gas levels are accelerating, despite promises by politicians to make dramatic cuts in emissions. As it turns out, politicians have not taken the action they promised they would take. 

Of course, when also adding nitrous oxide, the Clouds Tipping Point can get crossed even earlier.

Elements contributing to temperature rise

Next to rising greenhouse gas levels, there are further elements that can contribute to a huge temperature rise soon. 


As illustrated by above image by Nico Sun, the accumulation of energy going into melting the sea ice is at record high for the time of year. 


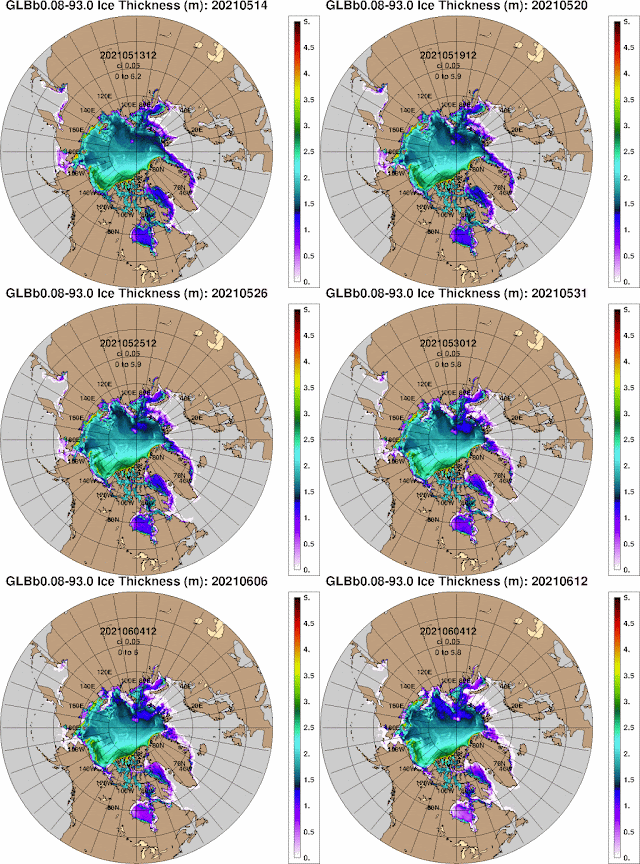
As illustrated by above combination image, the thickness of the sea ice is now substantially less than it used to be. The image compares June 1, 2021 (left), with June 1, 2015 (right). 

The animation on the right shows that sea ice is getting rapidly thinner, indicating that the buffer constituted by the sea ice underneath the surface is almost gone, meaning that further heat entering the Arctic Ocean will strongly heat up the water.

As described in an earlier post, this can destabilizate methane hydrates in sediments at the seafloor of the Arctic Ocean, resulting in eruption of methane from these hydrates and from methane that is located in the form of free gas underneath such hydrates. 

Such methane eruptions will first of all heat up the Arctic, resulting in loss of Arctic sea ice's ability to reflect sunlight back into space (albedo feedback), in disappearing glaciers and in rapidly thawing terrestrial permafrost (and the associated release of greenhouse gases).

The Snowball Effect


Temperatures are rising and they are rising at accelerating pace, especially in the Arctic. A strong El Niño and a distortion in the jet stream could cause the latent heat and methane hydrates tipping points to be crossed soon, causing many feedbacks to kick in with ever greater ferocity, and pushing up the global temperature beyond 3°C, 4°C and 5°C above pre-industrial, like a snowball that keeps growing in size while picking up ever more snow, as it is racing down a very steep slope.

Crossing of tipping points and further events and developments can combine with feedbacks into a snowball effect of rapidly rising temperatures.

Feedbacks include changes to the Jet Stream that result in ever more extreme weather events such as storms and forest fires. Such events can cause huge emissions of greenhouse gases. 

Temperatures can also be expected to rise over the next few years as sulfate cooling decreases. Aerosols can further cause additional warming if more black carbon and brown carbon gets emitted due to more wood getting burned and more forest fires taking place. Black carbon and brown carbon have a net warming effect and can settle on snow and ice and speed up their decline.

Therefore, the 8°C rise as a result of crossing the Clouds Tipping Point would come on top of the warming due to other elements, and the total rise could be as high as 18°C or 32.4°F from preindustrial, as ilustrated by the image on the right, from an earlier post.

Very high sea surface temperature anomalies

Meanwhile, sea surface temperatures on the Northern Hemisphere keep rising. The image below shows that sea surface temperature anomalies off the North American east coast (at the green circle) were as high as as 13.7°C (24.7°F) on June 3, 2021.


More heat is flowing from the tropics along the North American east coast toward the Arctic Ocean, carried by the Gulf Stream, as illustrated by the image on the right. 

In conclusion, there could be a huge temperature rise by 2026. 

At a 3°C rise, humans will likely go extinct, making it from some perspectives futile to speculate about what will happen beyond 2026. 

Even so, the right thing to do is to help avoid the worst things from happening, through comprehensive and effective action as described in the Climate Plan.


• NOAA: Trends in Greenhouse gases
https://gml.noaa.gov/ccgg/trends

• NOAA: Carbon dioxide peaks near 420 parts per million at Mauna Loa observatory

• Overshoot or Omnicide?
• Cryosphere Computing - by Nico Sun
https://cryospherecomputing.tk

• Arctic Ocean invaded by hot, salty water

• Most Important Message Ever
https://arctic-news.blogspot.com/2019/07/most-important-message-ever.html