Showing posts with label feedbacks. Show all posts

Friday, February 3, 2023

Dire situation gets even more dire

Antarctic sea ice extent was 1.788 million km² on February 21, 2023, an all-time low in the NSIDC record.

Antarctic sea ice area was 1,050,708 km² on February 22, 2023, as illustrated by the Nico Sun image below.


This means that a huge amount of heat that was previously reflected back into space by the sea ice is now instead absorbed by the Southern Ocean, in a self-reinforcing feedback loop that results in further sea ice loss, in turn further speeding up the temperature rise and making the weather ever more extreme.


Arctic sea ice extent was 14,271,000 km² on February 19, 2023, the third-lowest extent in the NSIDC record for the time of year, as illustrated by the above image.


Global sea ice extent reached a record low of 15,500,000 km² on February 11, 2023, as illustrated by the above image.

The situation is dire

The dire situation is further illustrated by the image below, showing high sea surface temperature anomalies (from 1981-2011) over the Southern Ocean, the Atlantic ocean and the Arctic Ocean on February 19, 2023. 


Given the dire situation regarding sea ice and sea surface temperatures, Arctic sea ice may fall dramatically later in the year.

Furthermore, emissions, ocean heat and greenhouse gas levels all keep rising. 

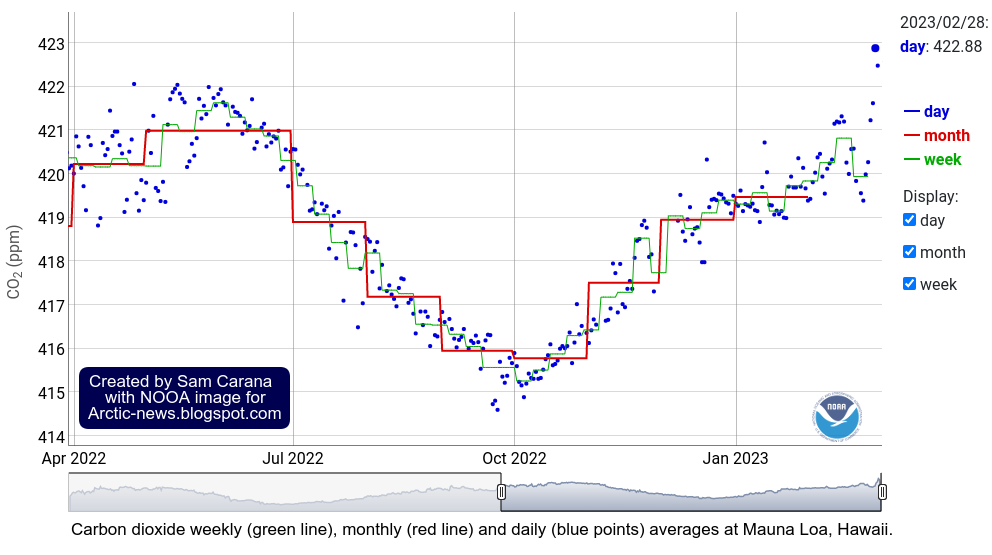
Carbon dioxide (CO₂) at Mauna Loa, Hawaii, reached a record average daily high of 422.88 parts per million (ppm) on February 28, 2023, as illustrated by the above image and the image below. 


It is remarkable for CO₂ levels to already reach record high levels this early in the year, given that CO₂ levels typically reach their annual maximum in May. This spells bad news for developments over the next few months. Keep in mind that carbon dioxide reaches its maximum warming some 10 years after emission, so we haven't been hit by the full wrath of carbon dioxide pollution yet.

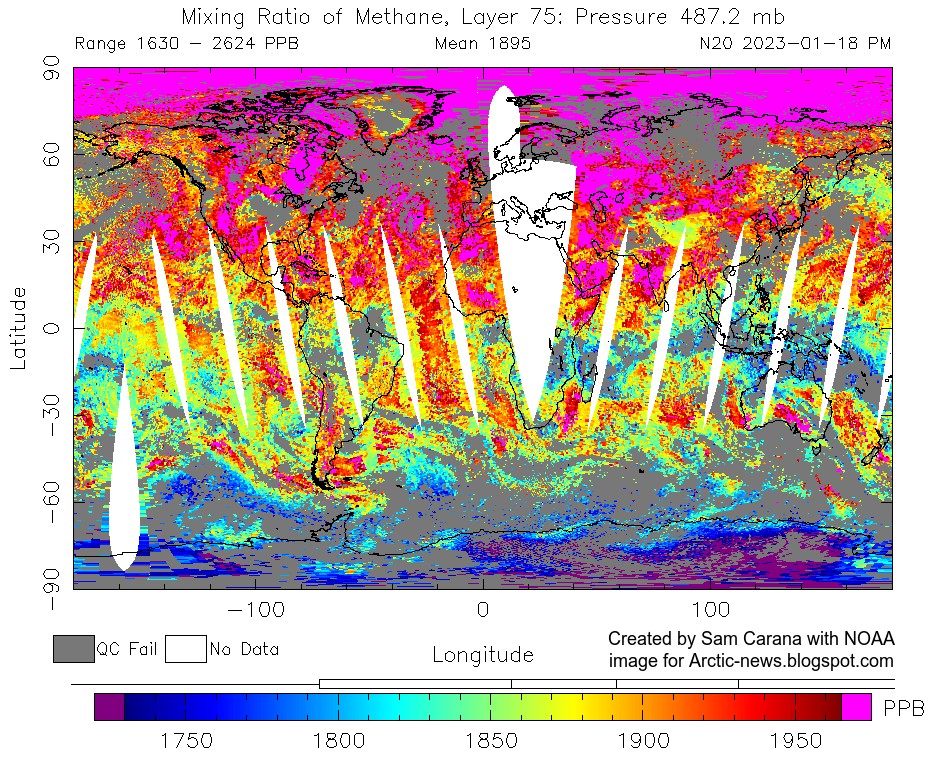
Possibly even worse is the rise in methane. The image below shows NOAA globally averaged marine surface monthly mean methane data from 2016, with methane reaching 1923.57 parts per billion (ppb) in November 2022. A moving average centered over 12 months is added to highlight the acceleration in the rise in methane.


Accordingly, temperatures keep rising. An earlier analysis concludes that we have already exceeded the 2°C threshold set at the Paris Agreement in 2015.

These dire conditions spell bad news regarding the temperature rise to come, the more so since, on top of these dire conditions, there are a number of circumstances, feedbacks and further developments that make the outlook even more dire.

Circumstances that make the situation even more dire

Firstly, as illustrated by the image on the right, adapted from NOAA, we're moving into an El Niño.

It looks like it's going to be a very strong El Niño, given that we've been in a La Niña for such a long time.

Moving from the bottom of a La Niña to the peak of a strong El Niño could make a difference of more than half a degree Celsius, as illustrated by the image below, adapted from NOAA.

[ click on images to enlarge ]

Temperature anomalies can be very high during an El Niño. The February 2016 temperature on land-only was 2.96°C above 1880-1920, and in February 2020, it was 2.79°C higher, as illustrated by the image below, created with screenshots taken on February 15, 2023. Note that 1880-1920 isn't pre-industrial.


Secondly, sunspots look set to reach a very high maximum by July 2025, as illustrated by the next two images on the right, adapted from NOAA.

Observed values for January 2023 are already well above the maximum values that NOAA predicted to be reached in July 2025.

If this trend continues, the rise in sunspots forcing from May 2020 to July 2025 may well make a difference of more than 0.25°C, a recent analysis found.

Thirdly, the 2022 Tonga submarine volcano eruption did add a huge amount of water vapor to the atmosphere.

Since water vapor is a potent greenhouse gas, this is further contributing to speed up the temperature rise.

A 2023 study calculates that the submarine volcano eruption near Tonga in January 2022, as also discussed at facebook, will have a warming effect of 0.12 Watts/m² over the next few years.

The image below, created with NOAA data, shows Annual Northern Hemisphere Land Temperature Anomalies and has two trends added. The blue trend, based on 1850-2022 data, points at 3°C rise by 2032. The pink trend, based on 2012-2022 data, better reflects variables such as El Niño and sunspots, showing that this could trigger a huge rise, with 3°C crossed in 2024. Anomalies are from 1901-2000 (not from pre-industrial).


Feedbacks and developments making things worse

Indeed, a huge temperature rise could be triggered, due to a multitude of feedbacks and further developments that could strongly deteriorate the situation even further.

On top of the water vapor added by the Tonga eruption, there are several feedbacks causing more water vapor to get added to the atmosphere, as discussed at Moistening Atmosphere.

Further feedbacks include additional greenhouse gas releases such as methane from the seafloor of the Arctic Ocean and methane, carbon dioxide and nitrous oxide from rapidly thawing permafrost on land.

The image below shows the Northern Hemisphere Ocean Temperature Anomaly, compared to 1901-2000. The pink trend, based on 1850-2022 data, shows that the Latent Heat Tipping Point (at 1°C) was crossed in 2022, but the red trend, based on 2007-2022 data, better reflects variables such as El Niño and shows both the Latent Heat Tipping Point and the Seafloor Methane Tipping Point (at 1.35°C) getting crossed in 2024. 


Ominously, November 2023 temperature anomalies are forecast to be at the top end of the scale for a large part of the Arctic Ocean, as illustrated by the tropicaltidbits.com image below. 


Some developments could make things even worse and a huge temperature rise could unfold soon. The image below shows a polynomial trend added to NOAA globally averaged marine surface monthly mean methane data from April 2018 to November 2022, pointing at 1200 ppm CO₂e (carbon dioxide equivalent) getting crossed in 2027.

The Clouds Tipping Point, at 1200 ppm CO₂e, could be crossed and this on its own could result in a further rise of 8°C. As illustrated by the above image, this tipping point could be crossed as early as in 2027 due to forcing caused by the rise in methane alone. When further forcing is taken into account, this could happen even earlier than in 2027. 

On top of the February 28, 2023 daily average of 422.88 ppm for CO₂, methane can add 384.71 ppm CO₂e when using a 1-year GWP of 200 for NOAA's 1923.57 ppb November 2022 methane mean.

While methane at higher altitude can reach even higher levels than NOAA's marine surface data, adding NOAA's November 2022 mean to 422.88 ppm CO₂ would leave just 392.41 ppm CO₂e for further forcing, before the Clouds Tipping Point would get crossed, as the image on the right illustrates.

[ see the Extinction page ]
Further forcing comes from nitrous oxide and other greenhouse gases, while rises in other gases and further changes such as caused by sea ice loss and changes in aerosols can also speed up the temperature rise.

Changes in aerosols are discussed in earlier posts such as this post and this post. The upcoming temperature rise on land on the Northern Hemisphere could be so strong that much traffic, transport and industrial activity will grind to a halt, resulting in a reduction in cooling aerosols that are now masking the full wrath of global heating. These are mainly sulfates, but burning of fossil fuel and biomass also emits iron that helps photosynthesis of phytoplankton in oceans, as a 2022 study points out. 

Without these emissions, the temperature is projected to rise strongly, while there could be an additional temperature rise due to an increase in warming aerosols and gases as a result of more biomass and waste burning and forest fires.

The image on the right, from the extinction page, includes a potential rise of 1.9°C by 2026 as the sulfate cooling effect falls away and an additional rise of 0.6°C due to an increase in warming aerosols by 2026, as discussed in this post and earlier posts.

The image on the right indicates that the rise from pre-industrial to 2020 could be as much as 2.29°C. Earth's energy imbalance has grown since 2020. Therefore, the rise up to now may be higher. 

Climate Tipping Points and further Events and Developments

The temperature could also be pushed up further due to reductions in the carbon sink on land. An earlier post mentions a study that found that the Amazon rainforest is no longer a sink, but has become a source, contributing to warming the planet instead; another study found that soil bacteria release CO₂ that was previously thought to remain trapped by iron; another study found that forest soil carbon does not increase with higher CO₂ levels; another study found that forests' long-term capacity to store carbon is dropping in regions with extreme annual fires; another earlier post discussed the Terrestrial Biosphere Temperature Tipping Point, coined in a study finding that at higher temperatures, respiration rates continue to rise in contrast to sharply declining rates of photosynthesis, which under business-as-usual emissions would nearly halve the land sink strength by as early as 2040.

This earlier post also discusses how CO₂ and heat taken up by oceans can be reduced. A 2021 study on oceans finds that, with increased stratification, heat from climate warming less effectively penetrates into the deep ocean, which contributes to further surface warming, while it also reduces the capability of the ocean to store carbon, exacerbating global surface warming. A 2022 study finds that ocean uptake of CO₂ from the atmosphere decreases as the Meridional Overturning Circulation slows down. An earlier analysis warns about growth of a layer of fresh water at the surface of the North Atlantic resulting in more ocean heat reaching the Arctic Ocean and the atmosphere over the Arctic, while a 2023 study finds that growth of a layer of fresh water decreases its alkalinity and thus its ability to take up CO₂, a feedback referred to as the Ocean Surface Tipping Point.

[ from Blue Ocean Event 2022? - click on images to enlarge ]

The above image depicts only one sequence of events, or one scenario out of many. Things may eventuate in different orders and occur simultaneously, i.e. instead of one domino tipping over the next one sequentially, many events may occur simultaneously and reinforce each other. Further events and developments could be added to the list, such as ocean stratification and stronger storms that can push large amounts of warm salty water into the Arctic Ocean.

While loss of Arctic sea ice and loss of Permafrost in Siberia and North America are often regarded as tipping points, Antarctic sea ice loss, and loss of the snow and ice cover on Greenland, on Antarctica and on mountaintops such as the Tibetan Plateau could also be seen as tipping points. Another five tipping points are: 
- The Latent Heat Tipping Point
- The Seafloor Methane Tipping Point

Extinction

Altogether, the rise from pre-industrial to 2026 could be more than 18.44°C, while humans are likely to go extinct with a rise of 3°C, as illustrated by the image below, from an analysis discussed in an earlier post.


This should act as a warning that near-term human extinction could occur sooner than most may think. Indeed, when asked what could cause humans to go extinct, many may mention:
  1. asteroid strikes
  2. rampant pestilence, diseases, epidemics and pandemics
  3. war, murder and violence
  4. ecosystems and vegetation collapse, famine
  5. dehydration
  6. plastic pollution, spread of poisonous and toxic substances
  7. nuclear accidents, nuclear war or waste leakage
  8. outbreaks of antibiotic-resistant bacteria
  9. emerging new or re-emerging ancient microbes
10. bio-weapons and biological experiments gone out of hand
11. infertility, genetic degeneration, loss of genetic diversity
12. madness, cults, depression and suicide
13. polar shifts, earthquakes, landslides and tsunamis
14. Artificial Intelligence gone rogue
15. hostile aliens breeding predatory animals

More recently, climate change threats are mentioned such as:
16. destructive storms, flooding, fires and more extreme weather
17. hydrogen sulfide gas released from oceans
18. depletion of the ozone layer
19. co-extinctions, i.e. extinction of species that humans depend on, resulting in our own demise.

There may be more threats, but I think the biggest threat is:
20. temperature rise
In the video below, Edge of Extinction: Destination Destruction, Guy McPherson gives his view on our predicament.


Conclusion

The dire situation we're in looks set to get even more dire, calling for comprehensive and effective action, as described in the Climate Plan and Transforming Society.


Links

• NSIDC - National Snow and Ice Data Center
https://www.nsidc.org

• NSIDC - Chartic interactive sea ice graph
https://nsidc.org/arcticseaicenews/charctic-interactive-sea-ice-graph

• Cryosphere Computing - by Nico Sun
https://cryospherecomputing.com

• Nullschool
https://earth.nullschool.net

• Climate Reanalyzer - sea ice based on NSIDC index V3
https://climatereanalyzer.org/clim/seaice

• NOAA - greenhouse gases - trends

• NOAA - Climate Prediction Center - ENSO: Recent Evolution, Current Status and Predictions
https://www.cpc.ncep.noaa.gov/products/analysis_monitoring/lanina/enso_evolution-status-fcsts-web.pdf

• NOAA - Monthly temperature anomalies versus El Niño
https://www.ncei.noaa.gov/access/monitoring/monthly-report/global/202301/supplemental/page-4

• NOAA - Solar cycle progression

• NASA gistemp Monthly Mean Global Surface Temperature - Land Only

• NOAA - Annual Northern Hemisphere Land Temperature Anomalies 

• Tonga eruption increases chance of temporary surface temperature anomaly above 1.5 °C - by Stuart Jenkins et al. (2023)
https://www.nature.com/articles/s41558-022-01568-2


• Moistening Atmosphere
• Albedo, latent heat, insolation and more

• Latent Heat

• Blue Ocean Event

• Tropicaltidbits.com

• Methane keeps rising

• A huge temperature rise threatens to unfold soon

• The Clouds Feedback and the Clouds Tipping Point
https://arctic-news.blogspot.com/p/clouds-feedback.html

• Human Extinction by 2025?

• 2020: Hottest Year On Record

• The Importance of Methane in Climate Change

• The underappreciated role of anthropogenic sources in atmospheric soluble iron flux to the Southern Ocean - by Mingxu Liu et al. (2022)
https://www.nature.com/articles/s41612-022-00250-w

• How close are we to the temperature tipping point of the terrestrial biosphere? - by Katharyn Duffy et al. (2021)

• Overshoot or Omnicide? 

• Upper Ocean Temperatures Hit Record High in 2020 - by Lijing Cheng et al. (2021)

• Reduced CO₂ uptake and growing nutrient sequestration from slowing overturning circulation - by Yi Liu et al. (2022)
https://www.nature.com/articles/s41558-022-01555-7

• Cold freshwater lid on North Atlantic
• Long-Term Slowdown of Ocean Carbon Uptake by Alkalinity Dynamics - by Megumi Chikamoto et al. (2023) 
• Ocean Surface Tipping Point Could Accelerate Climate Change

• When Will We Die?

• Edge of Extinction: Destination Destruction - video by Guy McPherson


Tuesday, January 3, 2023

A huge temperature rise threatens to unfold soon

A huge temperature rise threatens to unfold, as the already dire situation threatens to turn catastrophic due to the combined impact of a number of developments and feedbacks. 

The image below uses ERA5 data, with two trends added. The blue trend, based on 1940-2022 data, points at 3°C rise by 2044. The purple trend, based on 2008-2022 data, better reflects variables such as El Niño and sunspots, and shows that this could trigger a rise of as much as 3°C by 2025, as further discussed below. Note that anomalies are from 1850-1900, which isn't pre-industrial.


The upcoming El Niño

Temperatures are currently suppressed as we're in the depth of a persistent La Niña event. It is rare for a La Niña event to last as long as the current one does, as illustrated by the NASA image below and discussed in this NASA post. The blue line added in the image highlights an increase in peak ONI (strong El Niños) over the years. 


The above image was created using data up to September 2022. La Niña has since continued, as illustrated by the NOAA image on the right. NOAA adds that the dashed black line indicates that La Niña is expected to transition to ENSO-neutral during January-March 2023.

Chances are that we'll move into the next El Niño in the course of 2023. Moving from the bottom of a La Niña to the peak of a strong El Niño could make a difference of more than half a degree Celsius, as illustrated by the image below.

[ image adapted from NOAA ]
Joint impact of El Niño, sunspots and the volcano eruption near Tonga 

[ click on image to enlarge ]
An analysis in an earlier post warns that the rise in sunspots from May 2020 to July 2025 could make quite a difference, as the upcoming El Niño looks set to coincide with a high number of sunspots.

The current cycle of sunspots is forecast to reach a maximum in July 2025. Recent observations are higher than expected, as illustrated by the images on the right, adapted from NOAA, confirming a study mentioned in the earlier post that warns that the peak of this cycle could rival the top few since records began, which would further increase the difference.

Observed values for December 2022 are already very close to or above the maximum values that NOAA predicts will be reached in July 2025. If this trend continues, the rise in sunspots forcing from May 2020 to July 2025 may well make a difference of more than 0.25°C, a recent analysis found. 

A 2023 study calculates that the submarine volcano eruption near Tonga in January 2022, as also discussed at facebook, will have a warming effect of 0.12 Watts/m² over the next few years.

The joint impact of a strong El Niño, high sunspots and the volcano eruption near Tonga could make a difference of more than 0.87°C. This rise could trigger further developments and feedbacks that altogether could cause a temperature rise from pre-industrial of as much as 18.44°C by 2026, as illustrated by the image at the top and as discussed below.

As illustrated by the image below,  temperature anomalies on land can be very high, especially during El Niño events. In February 2016, during a strong El Niño, the land-only monthly anomaly from 1880-1920 was 2.95°C. Note that anomalies are from 1880-1920, which isn't pre-industrial.


Further developments and feedbacks 

A combination of further developments and feedbacks could cause a huge temperature rise. An example of this is the decline of the cryosphere, i.e. the global snow and ice cover.

Antarctic sea ice extent is currently at a record low for the time of year (see image on the right, adapted from NSIDC). 

Antarctic sea ice extent reached a record low on February 25, 2022, and Antarctic sea ice extent looks set to get even lower this year. The dangerous situation in Antarctica is discussed in more detail in a recent post

The currently very rapid decline in sea ice concentration around Antarctica is also illustrated by the animation of Climate Reanalyzer images on the right, showing Antarctic sea ice on November 16, November 29, December 15, 2022 and January 4, 2023.

Studies in Alaska and Greenland have found that submarine and ambient melting is substantially higher than previously thought.

Global sea ice extent is also at a record low for the time of year, as illustrated by the image below that shows that global sea ice extent was 16.67 million km² on January 5, 2023.


[ click on images to enlarge ]
As illustrated by the image on the right, adapted from NSIDC, Arctic sea ice extent was second lowest for the time of year on January 6, 2023.

Loss of sea ice results in loss of albedo and loss of the latent heat buffer that - when present - consumes ocean heat as the sea ice melts. These combined losses could result in a large additional temperature rise, while there are further contributors to the temperature rise, such as thawing of terrestrial permafrost and associated changes such as deformation of the Jet Stream, additional ocean heat moving into the Arctic from the Atlantic Ocean and the Pacific Ocean, and methane eruptions from the seafloor of the Arctic Ocean.

A 2019 analysis concludes that the latent heat tipping point gets crossed when the sea surface temperature anomaly on the Northern Hemisphere gets higher than 1°C above 20th century's temperature and when there is little or no thick sea ice left. 

The latent heat tipping point in the Arctic was crossed in 2020, while ocean heat has kept rising since, despite La Niña conditions, as illustrated by the images above and below. 


Temperature anomalies were high over the Arctic Ocean in December 2022, as illustrated by the image below. 


Ominously, methane levels are very high over the Arctic, as illustrated by the Copernicus image below and as discussed in section 16 of the methane page and at the Climate Alert group


The image below shows methane recorded by the N20 satellite on January 18, 2023, pm at 487.2 mb reaching a peak of 2624 ppb. 


The animation below is made with images recorded by the Metop-B satellite on Jan.6, 2023 PM, showing methane at the highest end of the scale (magenta color) first (at low altitude) becoming visible predominantly over oceans and at higher latitudes North, and then gradually becoming also visible more spread out over the globe at higher altitude, while reaching its highest mean (of 1925 ppb) and peak (of 2708 ppb) at 399 mb. 


This indicates that methane is rising up from the Arctic Ocean, as also discussed at the methane page and at this post at facebook. 

The image below is from tropicaltidbits.com and shows a forecast for September 2023 of the 2-meter temperature anomaly in degrees Celsius and based on 1984-2009 model climatology. The anomalies are forecast to be very high for the Arctic Ocean, as well as for the Southern Ocean around Antarctica, which spells bad news for sea ice at both hemispheres.


Similarly, the image below shows a forecast for October 2023. 


There are many further developments and feedbacks that could additionally speed up the temperature rise, such as rising greenhouse gases (including water vapor), falling away of the aerosol masking effect, more biomass being burned for energy and an increase in forest and waste fires, as also discussed at the Aerosols page

As an earlier post mentions, the upcoming temperature rise on land on the Northern Hemisphere could be so high that it will cause much traffic, transport and industrial activity to grind to a halt, resulting in a reduction in aerosols that are currently masking the full wrath of global warming.

The image below shows dust as high as 9.1887 τ, i.e. light at 550 nm as a measurement of aerosol optical thickness due to dust aerosols, on January 23, 2023 01:00 UTC (at the green circle).


[ see the Extinction page ]
2023 study concludes that the amount of atmospheric desert dust has increased globally by about 55% since the mid-1800s, resulting in a net masking effect of −0.2 ± 0.5 W m⁻² for dust aerosols alone, more than climate models previously thought.

As discussed in an earlier post, the IPCC in AR6 estimates the aerosol ERF to be −1.3 W m⁻², adding that there has been an increase in the estimated magnitude of the total aerosol ERF relative to AR5. In AR6, the IPCC estimate for liquid water path (LWP, i.e., the vertically integrated cloud water) adjustment is 0.2 W m⁻², but a recent analysis found a forcing from LWP adjustment of −0.76 W m⁻², which would mean that the IPCC estimate of −1.3 W m⁻² should be changed to -2.26 W m⁻². When using a sensitivity of 1°C per W m⁻², this translates into an impact of -2.26°C and that doesn't even include the above-mentioned extra impact of dust. Furthermore, the IPCC's total for aerosols includes a net positive impact for warming aerosols such as black carbon, so the impact of cooling aerosols alone (without warming aerosols) will be even more negative.

The image on the right, from the extinction page, includes a potential rise of 1.9°C by 2026 as the sulfate cooling effect falls away and of 0.6°C due to an increase in warming aerosols by 2026.

In the video below, Guy McPherson discusses our predicament.


Final conclusions and reflections

It's important to avoid using terminology that may cause confusion. The image below shows some terms that may cause confusion (left), and terms that could be considered to be used instead (right).


As an example, it's better to avoid terms such as 'overshoot' and target', as illustrated by the image below.  

It's important to look at the bigger picture and recognize that these developments and feedbacks could jointly cause a temperature rise (from pre-industrial) of as much as 18.44°C by 2026, as discussed at the Extinction page. Also note that humans are likely to go extinct with a rise of 3°C, as illustrated by the image below, from an analysis discussed in an earlier post and underpinned by this post.


Earlier versions of the text in the image below were posted here and here


The situation is dire and threatens to turn catastrophic soon. The right thing to do now is to help avoid or delay the worst from happening, through action as described in the Climate Plan.


Links

• Copernicus temperature

• NOAA National Centers for Environmental Information, State of the Climate: Monthly Global Climate Report for October 2022, retrieved November 16, 2022
https://www.ncei.noaa.gov/access/monitoring/monthly-report/global/2022010/supplemental/page-4

• Tonga volcano eruption raises ‘imminent’ risk of temporary 1.5C breach https://www.carbonbrief.org/tonga-volcano-eruption-raises-imminent-risk-of-temporary-1-5c-breach

• Tonga eruption increases chance of temporary surface temperature anomaly above 1.5 °C - by Stuart Jenkins et al. 
https://www.nature.com/articles/s41558-022-01568-2

• NSIDC - National Snow and Ice Data Center - Charctic Interactive Sea Ice Graph
https://nsidc.org/arcticseaicenews/charctic-interactive-sea-ice-graph

• Climate Reanalyzer
https://climatereanalyzer.org/wx/todays-weather/?var_id=seaice-snowc&ortho=7&wt=1

• Meltwater Intrusions Reveal Mechanisms for Rapid Submarine Melt at a Tidewater Glacier - by Rebecca Jackson et al. (2019)
https://agupubs.onlinelibrary.wiley.com/doi/10.1029/2019GL085335

• Greenland’s Glaciers Might Be Melting 100 Times As Fast As Previously Thought (2022)
https://news.utexas.edu/2022/12/15/greenlands-glaciers-might-be-melting-100-times-as-fast-as-previously-thought

• An Improved and Observationally-Constrained Melt Rate Parameterization for Vertical Ice Fronts of Marine Terminating Glaciers - by Kirstin Schulz et al. (2022)
https://agupubs.onlinelibrary.wiley.com/doi/full/10.1029/2022GL100654

• National Institute of Polar Research, Japan
https://ads.nipr.ac.jp/vishop/#/extent

• NASA - GISS Surface Temperature Analysis (v4) - Global Maps

• NOAA - Climate at a Glance Global Time Series

• Critical Tipping Point Crossed In July 2019
• Another Year of Record Heat for the Oceans - by Lijing Cheng et al. 

• Copernicus - methane

• NOAA - methane MetOp-B satellite

• Methane - section 16. Methane rising from Arctic Ocean seafloor

• Tropicaltidbits.com
https://www.tropicaltidbits.com

• The upcoming El Nino and further events and developments

• Jet Stream

• Cold freshwater lid on North Atlantic

• Pre-industrial
https://arctic-news.blogspot.com/p/pre-industrial.html

• Invisible ship tracks show large cloud sensitivity to aerosol - by Peter Manhausen et al.
https://www.nature.com/articles/s41586-022-05122-0

• Methane keeps rising
https://arctic-news.blogspot.com/2022/10/methane-keeps-rising.html

• Global warming in the pipeline - by James Hansen et al. 
https://export.arxiv.org/ftp/arxiv/papers/2212/2212.04474.pdf

• Latent Heat
https://arctic-news.blogspot.com/p/latent-heat.html

• Extinction
https://arctic-news.blogspot.com/p/extinction.html

• When will we die?
https://arctic-news.blogspot.com/2019/06/when-will-we-die.html

• When will humans go extinct?


Saturday, July 23, 2022

Arctic sea ice July 2022

Blue Ocean Event

[ from Blue Ocean Event ]
A Blue Ocean Event occurs when virtually all sea ice disappears and the surface color changes from white (sea ice) to blue (ocean). According to many, a Blue Ocean Event starts once Arctic sea ice extent falls below 1 million km².

The image on the right shows a trend pointing at zero Arctic sea ice volume by September 2027.

Note that the volume data in the image are averages for the month September ⁠— the minimum for each year is even lower. Furthermore, since zero volume implies zero extent, this indicates that a Blue Ocean Event (extent below 1 million km²) could happen well before 2027.

Sea ice extent

The image below, adapted from NSIDC, shows the extent of Arctic sea ice on July 26, 2022. 
[ click on images to enlarge ]

The extent of Arctic sea ice was among the lowest on record for the time of year on July 26, 2022. Furthermore, Antarctic sea ice extent is currently at a record low for the time of year, as illustrated by the image below, adapted from Vishop and showing the situation up to July 27, 2022. 


As a result, global extent of sea ice is close to record low for the time of year, as illustrated by the image below, adapted from Vishop and showing the situation up to July 27, 2022. 


Both Vishop and NSIDC use 15% concentration as the threshold for including an area in calculations of sea ice extent. This makes it important to look at the concentration of the sea ice. 

Sea ice concentration

The image below, adapted from University of Bremen, shows Arctic sea ice concentration on July 22, 2022, with concentration in many areas close to the North Pole down to 0%. 


The image below, adapted from NSIDC, shows Arctic sea ice concentration on July 26, 2022, with very low concentration of sea ice visible close to the North Pole. 


Sea ice thickness

The Naval Research Laboratory one-month animation below shows Arctic sea ice thickness up to July 25, 2022, with 8 days of forecasts added. 


The combination image below shows the fall in Arctic sea ice thickness from June 8 through August 6, 2022.

[ click on images to enlarge ]
The above combination image shows that most sea ice on June 8 (left) was forecast to be over 2 meters thick, that most sea ice on July 8 (center) was forecast to be over 1 meter thick, and that most sea was forecast to be under 1 meter thick on August 6, 2022 (right).

While the fall in extent over this period wasn't as dramatic, due to the suppression of air temperatures by the current La Niña, note that the green and yellow colors where the sea ice on June 8 was more than 2.5 meters thick, north of Greenland and north of the Canadian Arctic Archipelago, have virtually disappeared in the August 6 forecast.

The above maps show a dramatic fall in sea ice thickness over a large area. This fall in thickness is mostly due to warm water from the Atlantic Ocean that is melting the sea ice hanging underneath the surface. This is where the sea ice constitutes the latent heat buffer, consuming incoming heat in the process of melting.

The above Naval Research Laboratory maps may be conservative. The NASA Worldview and University of Bremen images below indicate that Arctic sea ice may be even thinner than that, especially north of the North Pole. 

The NASA Worldview combination image below shows the sea ice north of the North Pole on July 22, 2022 (left), and on July 23, 2022 (right), indicating that at many places there is no sea ice left at all. Note that the view in many places is obscured due to clouds. 


The University of Bremen combination image below shows the difference in sea ice thickness between June 1, 2022, June 30, 2022, and July 22, 2022. The images at the center and on the right show large areas where sea ice is less than 20 cm thick, indicating that the latent heat buffer had already disappeared in June 2022,  as also discussed further below. 

[ click on images to enlarge ]
The NASA Worldview combination image below shows the sea ice north of Greenland on July 19, 2022 (top), and on July 22, 2022 (bottom), indicating that even at places where the sea ice once was the thickest, it can melt away rapidly. The mechanism behind this is that, as thick ice breaks off and fragments, it additionally gets heated up from the sides, and this further accelerates the melting as the sea ice breaks up further, into ever smaller pieces.


The image below was created with a screenshot of a July 26, 2022, NASA Worldview satellite image, with the Earth at Night layer activated and brightness and contrast enhanced, which enables a closer look to be taken through the clouds. The image shows very little sea ice near the North Pole. 


The image below, a screenshot of a July 26, 2022, NASA Worldview satellite image, further shows that there is little sea ice close to the North Pole. 


Conditions behind the danger

One reason why sea ice has fallen so much in thickness so close to the North Pole is that around the time of the June Solstice (June 22, 2022) the North Pole receives more insolation than anywhere else on Earth.

Around this time of year, the sunlight has less distance to travel through the thinner atmosphere over the Arctic, so less sunlight gets absorbed or scattered before reaching the surface. In addition, the high angle of the Sun produces long days and sunlight is concentrated over a smaller area. Above the Arctic Circle, the Sun does not set at this time of year, so solar radiation continues all day and night.


How much sunlight does reach the surface further depends on weather conditions such as clouds and how much heat gets pushed by the wind toward the North Pole. As temperatures have risen over the years, the Jet Stream has become more deformed, increasing the chance that heatwaves over land extend over the Arctic Ocean. Deformation of the Jet Stream can also lead to increasingly strong winds speeding up ocean currents that can abruptly push huge amounts of ocean heat into the Arctic ocean, as further discussed below. For more background, also see the feedbacks page. 

Ocean heat

On July 19, 2022, the sea surface was as warm as 1.8°C or 35.2°F north of Greenland, as the nullschool.net image below shows. 


The above image also shows how cold water (blue) flows down to the east of Greenland, while warm water (green) flows off the west coast of Norway toward to Arctic Ocean, diving under the sea ice north of Svalbard and reaching areas north of Greenland where sea surface temperatures rise above freezing point. 

Of the extra heat from Earth's energy imbalance, about 93% ends up in the ocean as increasing ocean heat content (see image below), 3% goes into melting ice, 4% goes into raising temperatures of land and melting permafrost, and less than 1% remains in the atmosphere, as discussed in an earlier post.

[ from earlier post ]

Sea ice has disappeared in the Bering Strait, in part due to warm water from rivers in Alaska, as illustrated by the NOAA image below, which shows sea surface temperatures as high as 18.6°C or 65.48°F.


On July 19, 2022, the sea surface temperature anomaly from 1981-2011 in the Arctic Ocean was as high as 14.0°C or 25.2°F (at green circle), as illustrated by the screenshot below of a nullschool.net image (with text added). In 1981-2011, the sea surface temperature at this spot (at the green circle in the Kara Sea) at this time of year was around freezing point.


The above image also shows a distorted Jet Stream (at 250 hPa) moving over the Arctic ocean, instead of circumventing the Arctic and thus keeping heat out of the Arctic and keeping cold inside the Arctic, as it used to be.  


The above NOAA image illustrates how the Gulf Stream is pushing warm water toward the Arctic, with sea surface temperatures in the North Atlantic reaching as high as 32.6°C or 90.68°F on July 23, 2022.

Latent heat

Latent heat is heat that is (less and less) going into melting the sea ice. The reason this heat is called latent (hidden) heat, is that it doesn't raise the temperature of the water, but instead gets consumed in the process of melting the ice. Latent heat is energy associated with a phase change, such as the energy consumed when solid ice turns into water (i.e. melting). During a phase change, the temperature remains constant. Sea ice acts as a buffer that absorbs heat, while keeping the temperature at zero degrees Celsius. As long as there is sea ice in the water, this sea ice will keep absorbing heat, so the temperature doesn't rise at the sea surface. The amount of energy absorbed by melting ice is as much as it takes to heat an equivalent mass of water from zero to 80°C.


Once most of the sea ice that was hanging underneath the surface is gone, further heat will still keep moving underneath the sea ice from the Atlantic Ocean and - to a lesser extent - from the Pacific Ocean into the Arctic Ocean. Without the latent heat buffer, this heat must go elsewhere, i.e. it will typically raise the temperature of the water. The atmosphere will also warm up faster. More evaporation will occur once the sea ice is gone, further warming up the atmosphere.

A 2019 analysis concludes that the latent heat tipping point gets crossed when the sea surface temperature anomaly on the Northern Hemisphere gets higher than 1°C above 20th century's temperature and when there is little or no thick sea ice left. As the image below indicates, the temperature anomaly of 1°C above the 20th century average looks set to be crossed in the course of the year 2021.
As the Latent Heat Tipping Point gets crossed, there may still be a thin layer of ice at the surface, at least as long as air temperatures are low enough to keep it frozen and as long as strong winds haven't pushed the sea ice out of the Arctic Ocean. This thin layer of ice will still consume some ocean heat below the surface, but at the same time it acts as a seal, preventing heat from the Arctic Ocean to enter the atmosphere. Even if a lot of sea ice remains, the situation is dangerous, if not even more dangerous. The continuing La Niña could cause a lot of thin sea ice to remain at the surface of the Arctic Ocean this year. The more sea ice remains, the less ocean heat can be transferred from the Arctic Ocean to the atmosphere over the Arctic Ocean, which means that more heat remains in the Arctic Ocean.

One huge danger is that, as the buffer disappears that until now has consumed huge amounts of ocean heat, more heat will reach methane hydrates at the seafloor of the Arctic Ocean, causing them to get destabilized and resulting in releases of methane from these hydrates and from free gas underneath that was previously sealed by the hydrates.

As the latent heat buffer of the sea ice underneath the surface disappears, more of this heat could then reach sediments at the seafloor of the Arctic Ocean, threatening eruptions to occur of seafloor methane (from hydrates and from free gas underneath the hydrates). The methane could similarly push up temperatures dramatically over the Arctic, and globally over the next few years.

[ feedback #14: Latent Heat ]

The above 2014 image, from the feedbacks page, shows three of the numerous feedbacks that are accelerating warming in the Arctic. Feedback #1 is the albedo feedback. Feedback #14 refers to the loss of the Latent Heat Buffer and warming of the Arctic Ocean. Feedback #2 refers to methane releases.

Heatwaves look set to continue on the Northern Hemisphere, extending heat over the Arctic Ocean and thus affecting Arctic sea ice from above, while warm water from rivers will cause more melting at the surface, and while rising ocean heat will continue to cause more melting of the ice underneath the surface. If this continues, we can expect a new record low for sea ice in September 2022 and the joint loss of the latent heat buffer and the loss of albedo could push up temperatures dramatically over the Arctic, while the additional methane could similarly push up temperatures dramatically over the Arctic, and globally over the next few years.

[ The Buffer has gone, feedback #14 on the Feedbacks page ]
As discussed at the albedo page and the feedbacks page, albedo change, loss of the latent heat buffer and changes to the Jet Stream are important feedbacks. 


The above image, adapted from an ECMWF.int forecast for July 29, 2022, 12 UTC, run at that time, shows virtually no snow and ice cover over land except Greenland. The image also shows the difference such cover or the lack thereof makes in albedo. 

[ click on images to enlarge ]
The above image, adapted from NOAA Coral Bleaching Heat Stress Monitoring, shows expected coral bleaching heat stress for August to November 2022. The image on the right shows that coral bleaching alert level 2 was reached in the Barents Sea (green circle) on July 29, 2022, while a distorted Jet Stream is pushing warm, salty water from the Atlantic Ocean into the Arctic Ocean. 

2022 study of the Blob, a warm water area in the North Pacific that began in late 2013, concludes that the unusually warm waters were transported northward from further south. The researchers found that abnormally warm temperatures extended 1,000 meters (3,280 feet) below the surface.


The above image shows the Blob on July 24, 2022, with sea surface temperature anomalies as high as 10.5°C or 18.8°F on July 24, 2022. The North Pacific Current is visible, extending eastward from the coast of Japan.

Arctic-news has long (e.g. in this 2017 post) warned that changes to the Jet Stream can strengthen storms that can in turn cause a large amount of warm, salty water to abruptly move north and enter the Arctic Ocean from the Atlantic Ocean and trigger destabilization of methane hydrates at the seafloor of the Arctic Ocean, resulting in eruption of huge amounts of methane that could drive humans into extinction in a matter of years. 


Conclusion

In conclusion, temperatures could rise strongly in the Arctic soon, due to sea ice loss in combination with feedbacks and an upcoming El Niño coinciding with a peak in sunspots, with the potential to drive humans extinct as early as in 2025, while temperatures would continue to skyrocket in 2026, making it in many respects rather futile to speculate about what will happen beyond 2026. At the same time, the right thing to do now is to help avoid the worst things from happening, through comprehensive and effective action as described in the Climate Plan.


Links

• Blue Ocean Event
https://arctic-news.blogspot.com/p/blue-ocean-event.html

• National Snow and Ice Data Center (NSIDC)
https://nsidc.org

• Visualization Service of Horizontal scale Observations at Polar region (Vishop) 
https://ads.nipr.ac.jp/vishop/#/extent

• Naval Research Laboratory
https://www7320.nrlssc.navy.mil/GLBhycomcice1-12/arctic.html

• University of Bremen
https://seaice.uni-bremen.de/databrowser

• NASA Worldview satellite
https://worldview.earthdata.nasa.gov

• NOAA - sea surface temperature

• Human Extinction by 2025?