Showing posts with label feedback. Show all posts

Tuesday, October 8, 2013

Abrupt Climate Change

What is Abrupt Climate Change?

Abrupt climate change is defined by the IPCC as a large-scale change in the climate system that takes place over a few decades or less, persists (or is anticipated to persist) for at least a few decades, and causes substantial disruptions in human and natural systems.

Examples of components susceptible to such abrupt change are clathrate methane release, tropical and boreal forest dieback, disappearance of summer sea ice in the Arctic Ocean, long-term drought and monsoonal circulation.

Deposits of methane clathrates below the sea floor are susceptible to destabilization via ocean warming.

Anthropogenic warming will very likely lead to enhanced methane emissions from both terrestrial and oceanic clathrates.

Above extracted from:
- Intergovenmental Panel on Climate Change (IPCC), AR5 Workgroup 1, Technical Summary

New Finding Shows Climate Change Can Happen in a Geological Instant

The Paleocene/Eocene thermal maximum (PETM) is a climate shift that occurred 55 million years ago.

James Wright, Rutgers University Research News -
Morgan Schaller, James Wright, and the core sample
that helped them understand what happened
– and how fast it happened – 55 million years ago.
In a new paper in the Proceedings of the National Academy of Sciences, Morgan Schaller and James Wright present their finding that climate change can and did happen abruptly, or in geological terms, instantaneously.

Following a doubling in carbon dioxide levels, the surface of the ocean turned acidic over a period of weeks or months and global temperatures rose by 5 degrees centigrade – all in the space of about 13 years.

“We’ve shown unequivocally what happens when CO2 increases dramatically – as it is now, and as it did 55 million years ago,” James Wright said.

The film below goes into more detail regarding the current situation.

New Film: Last Hours

The film “Last Hours” describes a science-based climate scenario where a tipping point to runaway climate change is triggered by massive releases of frozen methane. Methane, a powerful greenhouse gas, has already started to percolate into the open seas and atmosphere from methane hydrate deposits beneath melting arctic ice, from the warming northern-hemisphere tundra, and from worldwide continental-shelf undersea methane pools.

“Last Hours” is narrated by Thom Hartmann and directed by Leila Conners. Executive Producers are George DiCaprio and Earl Katz.


For more, also watch some of Thom Hartmann’s interviews.

High Methane Levels persist over Arctic Ocean

High methane levels are prominent over the Arctic Ocean, as illustrated by the image below, covering a period from October 3, 2013, 10:54 am to October 7, 2013, 11:53 pm. The fact that methane has not been present elsewhere in such high concentrations over this period indicates that the methane wasn't carried there by the wind from elsewhere. Also, methane typically appears to move along the same latitude, due to the Coriolis effect.


The image indicates a link between seismic activity and destabilization of methane that is held in sediments under the Arctic Ocean. Methane does show up prominently along the fault line that crosses the Arctic Ocean and extends into Siberia over the Laptev Sea.

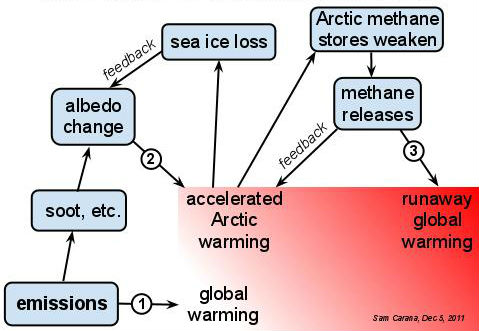
The Diagram that IPCC failed to include in AR5

The diagram below shows global warming evolving into accelerated warming in the Arctic. Feedbacks such as albedo changes and methane release speed up this process, triggering abrupt climate change and finally extinction.

The Diagram the IPCC failed to include in AR5

This threatening situation calls for an Effective and Comprehensive Climate Plan, such as depicted by the green lines of action in the image below and as further described at the ClimatePlan blog. For more background, see related posts further below.


Related posts

- Just do NOT tell them the monster exists
http://arctic-news.blogspot.com/2013/10/just-do-not-tell-them-the-monster-exists.html

- Methane Release caused by Earthquakes
http://arctic-news.blogspot.com/2013/09/methane-release-caused-by-earthquakes.html

- Climate Plan
http://climateplan.blogspot.com


Friday, August 16, 2013

Four Hiroshima bombs a second: how we imagine climate change

Hiroshima bomb - from: Wikipedia image
Where does the excess heat go that is trapped in our atmosphere by greenhouse gases every day?

The title of this post is a hat-tip to David Holmes, Monash University, Australia, who recently published an article with that title at The Conversation, discussing that the daily excess heat absorbed by Earth equals the heat released by well over four Hiroshima bombs every seconds.

It's actually well over four Hiroshima bombs every second, given that there are 86,400 seconds in a day and based on James Hansen calculations (at a Feb 29, 2013, TED presentation) that the current imbalance of 0.6 watts/square meter (which does not include the energy already used to cause the current warming of 0.8°C) was equivalent to exploding 400,000 Hiroshima atomic bombs every day, 365 days per year.

As illustrated by the graph below, most of this excess heat is absorbed by oceans and ice. Some of the heat is consumed by the process of melting ice into water, but most heat ends up warming up the oceans.
Graph by Sceptical Science
An earlier post (September 2012, added underneath) described the study by Nuccitelli et al. that measures heat going into the oceans in Joules and, as discussed above, measuring excess heat in terms of heat released by nuclear bombs might give more meaning to what is going on.

Where does the extra heat go? 

Global warming is causing Earth to heat up. As shown on the image below, by Nuccitelli et al., most heat goes into the oceans. A substantial amount of heat also goes into the melting of ice.


Warming of water in the Arctic Ocean

Global warming is heating up the oceans big time. As the image below shows, the global ocean heat content has been rising for many years.


White arrows mark ice drift directions. Red arrows mark 
the transport path of warm Atlantic water entering the 
Arctic where it submerges under the cold, ice-covered 
surface layer. Robert Spielhagen (IFM-GEOMAR, Kiel)
The Arctic is affected in particular by the Thermohaline Circulation.

Water flowing into the Arctic Ocean from the Atlantic Ocean is about 2°C warmer today than it has been for at least 2,000 years, according to a study published in Science. The current of warm water lies 50 metres below the surface, and can reach 6°C in summer — warm compared to Arctic surface waters, which can be -2°C.

At the same time, cold water and sea ice are driven out of the Arctic Ocean, along the edges of Greenland. The net result is a marked increase in the temperature of the water in the Arctic Ocean, especially the top layer of the water which causes the sea ice to melt.

The Arctic radiates comparatively less heat into space

Furthermore, cold layers of air close to the surface of the Arctic Ocean make it difficult for infrared radiation to go out to space, according to a study published in Science. These layers do warm up, but warming of these layers is directed downwards, thus amplifying warming in the Arctic.

Surface air temperatures in the Arctic are rising rapidly

Anomalies for surface air temperatures are higher in the Arctic than anywhere else on Earth. The increase in temperature anomalies appears to be an exponential rise. This is caused not only by the above-described points, but also by feedback effects as further described below.

How much will temperatures rise?
In the above graph, rising temperatures are compared to the global average for the period 1951-1980, which is typically used as a base period by NASA in temperature change analysis. The background behind this is that the U.S. National Weather Service uses a three-decade period to define "normal" or average temperature. The NASA Goddard Institude for Space Studies (GISS) analysis of temperature anomalies began around 1980, so the most recent 30 years at the time was 1951-1980.

The study 'Climate Impact of Increasing Atmospheric Carbon Dioxide', by NASA scientists led by James Hansen, describes those early efforts and was published in Science back in 1981. The image below is from the paper, showing that much of the extra heat trapped by carbon dioxide released by people in the atmosphere ends up in oceans.


The paper discusses how many years it can take for oceans to warm up, and the role of feedbacks in that process. The paper notes that a surface albedo change over land areas of 5% (equivalent to a 1.5% global change), would affect global temperature by 1.3°C, adding that paleclimatic evidence suggests that surface warming at high latitudes will be two to five times the global mean warming, due to snow/ice albedo feedback and greater atmospheric stability, which magnifies the warming of near-surface layers.

Feedbacks further accelerate warming in the Arctic

Feedbacks are described in more detail in posts such as Diagram of Doom (image below) and Changes to Polar Vortex affect mile-deep ocean circulation patterns.

Diagram of Doom
One such feedback is albedo change — retreat of Arctic sea ice results in less sunlight being reflected back into space, as further discussed in Albedo Change in the Arctic. Loss of Arctic sea ice is effectively doubling mankind's contribution to global warming. Increased absorption of the sun's rays is the equivalent of about 20 years of additional CO2 being added by man, Professor Peter Wadhams said in a BBC article.

One of the most threatening feedbacks is release of methane that are held in the currently frozen seabed. As the seabed warms up, it starts to release methane in what can be rather abrupt ways. Due to methane's high global warming potential and low levels of hydroxyl in the Arctic, this threatens to further accelerate local warming and trigger further methane releases, in a vicious spiral of runaway global warming.

from: Methane Hydrates

This situation calls for comprehensive and effective action as discussed at the climateplan blog.

Related

- Accelerated Warming in the Arctic 

- Arctic Ocean is turning red

- How much will temperatures rise?

- Methane Hydrates

Sunday, August 4, 2013

Methane as high as 2349 ppb


Earth is undergoing one of the largest climate changes in the past 65 million years, Stanford climate scientists Noah Diffenbaugh and Chris Field report, and it's on pace to occur at a rate 10 times faster than any change in that period.

“We know from past changes that ecosystems have responded to a few degrees of global temperature change over thousands of years,” said Diffenbaugh. “But the unprecedented trajectory that we're on now is forcing that change to occur over decades.”

Some of the strongest evidence for how the global climate system responds to high levels of carbon dioxide comes from paleoclimate studies. Fifty-five million years ago, carbon dioxide in the atmosphere was elevated to a level comparable to today. The Arctic Ocean did not have ice in the summer, and nearby land was warm enough to support alligators and palm trees. But apart from the rate of change, Diffenbaugh adds, another key difference is that “today there are multiple human stressors that were not present 55 million years ago, such as urbanization and air and water pollution.”

By the end of the century, should the current emissions of greenhouse gases remain unchecked, temperatures over the northern hemisphere will tip 5-6 degrees C warmer than today's averages. In this case, the hottest summer of the last 20 years becomes the new annual norm.

The situation looks to be even more dire than that, argues Sam Carana. In addition to carbon dioxide, there are further pollutants driving global warming. Moreover, as pictured below, feedbacks can dramatically accelerate the rise in temperature locally, particularly in the Arctic.

Image 21. For more details on feedbacks, see extended version of this image and discussion at

The level of methane in the atmosphere has already been rising even faster than the level of carbon dioxide, as illustrated by the image below. Moreover, there's the threat that large additional amounts of methane will suddenly be released, in particular from the Arctic seabed.


In August 2013, methane were recorded as high as 2349 ppb, as illustrated by the graph on below (added later, editor), showing that in early August, the world's mean methane level suddenly increased with at least 10 ppb compared to mean levels over the past few months.


To get an idea just how much methane has entered the atmosphere, have a look at the image below, covering several days from the start of August 2013.

[ click on image to enlarge ]


This is further illustrated by the two images below. The image directly below shows where the highest methane levels (i.e. over 1950 ppb, in yellow) were recorded on August 2, 2013.

[ click on image to enlarge ]
The image below shows the presence of methane on August 2, 2013, for a number of ranges, including at levels over 1950 ppb (this time in red).

[ click on image to enlarge ]
The methane threat is further described in the post Methane hydrates, which also features the image below.


Methane as high as 2303 ppb

This post has been updated as Methane as high as 2349 ppb.

Friday, December 28, 2012

Albedo changes in the Arctic

How global warming and feedbacks are causing huge albedo changes in the Arctic.

Snow cover decline

Decline of the snow cover on land in the northern hemisphere is accelerating, as illustrated by the image below and the image underneath on the right. (1)


Image credit: Rutgers University
Fresh snow can have an albedo as high as 0.85, meaning that up to 85% of the sunlight falling on snow can get reflected back into space. As the snow melts, its structure changes making it less reflective, i.e. its albedo will go down, to as low as 40%. (2)

As a result, more sunlight gets absorbed, accelerating the melting process. Eventually, where snow melts away, spots of bare soil become exposed, and dark wet soil has a very low albedo, reflecting only between 5% and 15% of the sunlight. Thus, even more sunlight gets absorbed and the soil's temperature increases, causing more of the remaining snow to melt. (2)

Changes in vegetation can further accelerate this process. Russia's boreal forest - the largest continuous expanse of forest in the world - has seen a transformation in recent years from larch to conifer trees. Larch trees drop their needles in the fall, allowing the vast, snow-covered ground in winter to reflect sunlight and heat back into space and helping to keep temperatures in the region very cold. But conifers such as spruce and fir retain their needles, which absorb sunlight and increase the forest's ground-level heat retention. (3)

Albedo, from Wikipedia
A conversion from larch to evergreen stands in low-diversity regions of southern Siberia would generate a local positive radiative forcing of 5.1±2.6 W m−2. This radiative heating would reinforce the warming projected to occur in the area under climate change. (4)

Tundra in the Arctic used to be covered by a white blanket of snow most of the year. However, as the landscape is warming up, more trees and shrubs appear. Scientists who studied part of the Eurasian Arctic, found that willow and alder shrubs, once stunted by harsh weather, have been growing upward to the height of trees in recent decades. They now rise above the snowfall, presenting a dark, light-absorbing surface. This increased absorption of the Sun's radiation, combined with microclimates created by forested areas, adds to global warming, making an already-warming climate warm even more rapidly. (5 & 6)

Furthermore, encroachment of trees onto Arctic tundra caused by the warming may cause large release of carbon to the atmosphere, concludes a recent study. This is because tundra soil contains a lot of stored organic matter, due to slow decomposition, but the trees stimulate the decomposition of this material. (7)


Sea ice decline

In the Arctic, sea ice volume has fallen dramatically over the years, as illustrated by the image on the right. The trend points at 2014 as the year when Arctic sea ice will first reach zero volume for some time during that year. (8)

The Arctic Ocean looks set to be ice-free for a period of at least three months in 2015 (August, September and October), and for a period of at least 6 months from the year 2020 (June through to November). (9)

Decline of the Arctic sea ice is accelerating, due to numerous feedbacks. As the Arctic atmosphere warms up, any snow cover on top of the ice will melt away ever quickly, decreasing the surface albedo and thus reinforcing the warm-up. As melt ponds appear on top of the ice, the albedo will drop even further.

Sam Carana's Diagram of Doom pictures ten feedbacks that jointly work to accelerate sea ice decline. (10)

The image below shows the three areas where albedo change will be felt most in the Arctic, i.e. sea ice loss, decline of albedo in Greenland and more early and extensive retreat of snow and ice cover in other areas in the Arctic. (8)

Big changes in the Arctic within years, by Sam Carana


References

1. Northern Hemisphere Snow Cover Anomalies 1967-2012 June, Rutgers University
climate.rutgers.edu/snowcover/chart_anom.php?ui_set=1&ui_region=nhland&ui_month=6

2. Albedo, Albedo Change blog
albedochange.blogspot.com/2009/02/albedo-change.html

3. Shift in Northern Forests Could Increase Global Warming, Scientific American, March 28, 2011
scientificamerican.com/article.cfm?id=shift-northern-forests-increase-global-warming

4. Sensitivity of Siberian larch forests to climate change, Shuman et al., April 5, 2011, Wiley.com
onlinelibrary.wiley.com/doi/10.1111/j.1365-2486.2011.02417.x/abstract

5. Warming turns tundra to forest
ox.ac.uk/media/news_stories/2012/120604.html

6. Eurasian Arctic greening reveals teleconnections and the potential for structurally novel ecosystems, Macias-Fauria et al., 2012
nature.com/nclimate/journal/v2/n8/full/nclimate1558.html

7. Expansion of forests in the European Arctic could result in the release of carbon dioxide, University of Exeter news, June 18, 2012
exeter.ac.uk/news/featurednews/title_214902_en.html

8. Big changes in the Arctic within years, Sam Carana, October 26, 2012, Arctic-News blog
arctic-news.blogspot.com/2012/10/big-changes-in-arctic-within-years.html

9. Getting the Picture, Sam Carana, August 2012, Arctic-News blog
arctic-news.blogspot.com/2012/08/getting-the-picture.html

10. Diagram of Doom, Sam Carana, August 2012, Arctic-News blog
arctic-news.blogspot.com/2012/08/diagram-of-doom.html


Further reading

- Albedo change in the Arctic
arctic-news.blogspot.com/2012/07/albedo-change-in-arctic.html

- Greenland is melting at incredible rate
arctic-news.blogspot.com/2012/07/greenland-is-melting-at-incredible-rate.html

- Albedo change in the Arctic threatens to cause runaway global warming
arctic-news.blogspot.com/2012/10/albedo-change-in-the-arctic-threatens-to-cause-runaway-global-warming.html

Thursday, December 20, 2012

Polar jet stream appears hugely deformed


World climate zones used to be kept well apart by jet streams. On the northern hemisphere, the polar jet stream was working hard to separate the Tundra and Boreal climate zones' colder air in the north from the Temperate climate and the Subtropical climate zones' warmer air in the south.

NOAA image
The greater the difference in temperature between north and south, the faster the jet streams spin around the globe, the polar jet stream at about 60°N and the subtropical jet stream at about 30°N, as illustrated on above image. 

NOAA image
The polar jet stream used to move at speeds of up to 140 miles per hour, while following a relatively straight track that was meandering only slightly, i.e. with waves that go up and down only a little bit.

Accordingly, the Northern Temperate Zone used to experience only mild differences between summer and winter weather, rather than the extreme hot or cold temperatures that we've experienced recently.

Accelerated warming in the Arctic is decreasing the difference in temperature between the Arctic and the Northern Temperate Zone. This is causing the polar jet to slow down and become more wavy, i.e. with larger loops, as illustrated by the NASA image further below.
Polar jet stream (blue) & subtropical
jet stream (red) - NOAA image

                   Diagram of Doom, Sam Carana
This is a feedback of accelerated warming in the Arctic that reinforces itself. As the jet stream slows down and its waves become more elongated, cold air can leave the Arctic more easily and come down deep into the Northern Temperate Zone. Conversily, more warm air can at the same time move north into the Arctic.

The 'open doors' feedback further decreases the difference in temperature between the Arctic and the Northern Temperate Zone, in turn further slowing down the jet stream and making it more wavy, and thus further accelerating warming in the Arctic.

The polar jet stream can travel at speeds greater than 100 mph. Here, the fastest winds are colored red; slower winds are blue. View animated version here. Credit: NASA/Goddard Space Flight Center
How does this affect temperatures? If we look at the average surface temperature anomalies for the month November 2012, we see huge differences in temperatures. Areas in the East Siberian Sea and in east Siberia registered average surface temperature anomalies for November 2012 of about 10 degrees Celsius, compared with 1951-1980. At the same time, areas in Alaska and Canada have been experiencing anomalies of about -10 degrees Celsius.


This suggests a hugely deformed polar jet stream, as indicated by the contour lines on above image on the right. This is very worrying, as this is only one out of many feedbacks that come with accelerated warming in the Arctic. There are at least ten such feedbacks, as depicted in the diagram below, from the earlier post Diagram of Doom.

       Diagram of Doom, Sam Carana
One of the most frightening feedbacks is the albedo loss in the Arctic. The speed at which changes are taking place can be illustrated with the image below, from the earlier post Big changes in the Arctic within years.


The urgency to act is perhaps best expressed by means of the two images below, which can constitute a fitting end-of-year message if you like to share them further. The image below highlights that Arctic sea ice minimum volume in 2012 was only 19.3% what it was in 1979. The background image, prepared by Wipneus, shows an exponential trend projecting a 2013 minimum of only 2000 cubic km of sea ice, with a margin of error that allows Arctic sea ice to disappear altogether next year, i.e. nine months from now.

Finally, the image below highlights that, in 2012, Arctic sea ice area fell by 83.7% in just 168 days, again illustrating how fast things can eventuate. 


For more quotes, see the page at http://arcticmethane.blogspot.com/p/quotes.html

Earlier posts:
Opening the Doorways to Doom

Friday, October 26, 2012

Hurricane Sandy moving inland

Hurricane Sandy is moving inland and its impact is forecast to be felt as far away as in Toronto and Ottawa.

Coastal Watches/Warnings and 5-Day Track Forecast Cone
Hurricane SANDY Advisory #019       11:00 PM EDT Fri October 26, 2012
from:  National Hurricane Center (check link for updates!)


Paul Beckwith,
B.Eng, M.Sc. (Physics),
Ph.D. student (Climatology)
and Part-time Professor,
University of Ottawa
 
This prompted Paul Beckwith to make the following comments:

All storms veer to the right in the northern hemisphere due to the spinning of the earth (1 revolution per day). Except when there is a tilted high pressure region northward and it has to go left and there is a massive low pressure region left that sucks it there as well. 

Why the high pressure ridge and massive low pressure? Because the jet stream is wavier and slower, a situation that is happening more and more often, because of massive sea ice decline this summer. Which is due to Arctic amplification feedbacks. Which in turn is due to rising greenhouse gases. Which is due to humans.

The situation is further illustrated by the image below, from ClimateCentral.

An atmospheric "blocking pattern" will push Sandy north, then northwestward, into the Mid-Atlantic or Northeast. Click to enlarge the image.     Credit: Remik Ziemlinski, Climate Central.
In an earlier post, Paul Beckwith described that a very rare cyclone churned up the entire Arctic region for over a week in early August 2012, destroying 20% of the ice area by breaking it into tiny chunks, melting it, or spitting it into the Atlantic. Cold fresh surface water from melted sea ice mixed with warm salty water from a 500 metre depth! Totally unexpected. A few more cyclones with similar intensity could have eliminated the entire remaining ice cover. Thankfully that didn't happen. What did happen was Hurricane Leslie tracked northward and passed over Iceland as a large storm. It barely missed the Arctic this time. Had the storm tracked 500 to 600 kilometres westward, Leslie would have churned up the west coast of Greenland and penetrated directly into the Arctic Ocean basin.

We dodged a bullet, at least this year. This luck will surely run out. What can we do about this? How about getting our politicians to listen to climatologists, for starters.

Below, rainfall forecast from the Hydrometereological Prediction Center of the National Weather Service - check the link for updates! 


Related

- Vanishing Arctic sea ice is rapidly changing global climatearctic-news.blogspot.com/2012/09/vanishing-arctic-sea-ice-is-rapidly-changing-global-climate.html

- Storm enters Arctic region

- Huge cyclone batters Arctic sea ice
arctic-news.blogspot.com/2012/08/huge-cyclone-batters-arctic-sea-ice.html

Saturday, September 29, 2012

Accelerated Warming in the Arctic

Why is warming in the Arctic accelerating and where will this lead to?

Where does the extra heat go? 

Global warming is causing Earth to heat up. As shown on the image below, by Nuccitelli et al., most heat goes into the oceans.


Warming of water in the Arctic Ocean

White arrows mark ice drift directions. Red arrows mark
the transport path of warm Atlantic water entering the
Arctic where it submerges under the cold, ice-covered
surface layer.  Robert Spielhagen (IFM-GEOMAR, Kiel)
Global warming is heating up the oceans big time. As above image shows, the global ocean heat content has been rising for many years.

The Arctic is affected in particular by the Thermohaline Circulation.

Water flowing into the Arctic Ocean from the Atlantic Ocean is about 2°C warmer today than it has been for at least 2,000 years, according to a study published in Science. The current of warm water lies 50 metres below the surface, and can reach 6°C in summer — warm compared to Arctic surface waters, which can be -2°C.

At the same time, cold water and sea ice are driven out of the Arctic Ocean, along the edges of Greenland. The net result is a marked increase in the temperature of the water in the Arctic Ocean, especially the top layer of the water which causes the sea ice to melt.


The Arctic radiates comparatively less heat into space 

Cold layers of air close to the surface make it difficult for infrared radiation to go out to space, according to a study published in Science. These layers do warm up, but warming of these layers is directed downwards, thus amplifying warming in the Arctic.


Surface air temperatures in the Arctic are rising rapidly

Anomalies for surface air temperatures are higher in the Arctic than anywhere else on Earth. This is illustrated by the interactive images and text in the box at the bottom of this post.

The increase in temperature anomalies appears to be an exponential rise. This is caused not only by the above-described impacts of cold air close to the surface, but also by feedback effects as further described below.


Feedbacks further accelerate warming in the Arctic

Feedbacks are described in more detail in posts such as Diagram of Doom (image below) and Changes to Polar Vortex affect mile-deep ocean circulation patterns.


One such feedback is albedo change — retreat of Arctic sea ice results in less sunlight being reflected back into space, as further discussed in Albedo Change in the Arctic. Loss of Arctic sea ice is effectively doubling mankind's contribution to global warming. Increased absorption of the sun's rays is the equivalent of about 20 years of additional CO2 being added by man, Professor Peter Wadhams said in a recent BBC article.

One of the most threatening feedbacks is release of methane that are held in the currently frozen seabed. As the seabed warms up, it starts to release methane in what can be rather abrupt ways. Due to methane's high global warming potential, this can further accelerate local warming, triggering further methane releases, in a vicious circle that threatens to spiral into runaway global warming.

Tuesday, August 28, 2012

Diagram of Doom


Above diagram was part of a poster displayed at the 2011 AGU meeting in San Francisco by the Arctic Methane Emergency Group (AMEG). It was accompanied by the following text: In the Arctic, three problems are compounding one another: emissions causing global warming, sea ice loss causing accelerated warming, and methane releases further accelerating Arctic warming, with the danger of triggering runaway global warming.

The diagram pictures three kinds of warming and their main causes:
  1. Emissions by people causing global warming, with temperatures rising around the globe, including the Arctic.
  2. Soot, dust and volatile organic compounds settling down on snow and ice, causing albedo change. More heat is absorbed, rather than reflected as was previously the case. This causes accelerated warming in the Arctic.
  3. Accelerated warming in the Arctic threatening to weaken methane stores in the Arctic with the danger that methane releases will trigger runaway global warming.

The diagram also pictures two feedback effects that make things even worse:
  • Albedo feedback: Accelerated warming in the Arctic speeds up sea ice loss, further accelerating albedo change.
  • Methane feedback: Methane releases in the Arctic further add to the acceleration of warming in the Arctic, further contributing to weaken Arctic methane stores and increasing the danger that methane releases will trigger runaway global warming.

Albedo change in the Arctic comprises a number of elements, as depicted in the image below, from the 2004 report Impacts of a Warming Arctic - Arctic Climate Impact Assessmentby the International Arctic Science Committee.  


As described in various posts at this blog over time, there are further points that should be taken into account. Regarding sea ice loss, it's clear that where sea ice retreats, more open water appears, with the result that less sunlight is reflected back into space. Accelerated warming will also affect the integrity of the remaining sea ice, as well as of the snow and ice cover on land, including glaciers. This further adds to the albedo effect, causing less sunlight to be reflected back into space. Similarly, further feedbacks could be added or described in more detail.

Accordingly, ten feedbacks can be identified, and described as follows:
  1. Albedo feedback: Accelerated warming in the Arctic speeds up the decline of ice and snow cover, further accelerating albedo change. 
  2. Methane feedback: Methane releases in the Arctic further add to the acceleration of warming in the Arctic, further contributing to weaken Arctic methane stores and increasing the danger that methane releases will trigger runaway global warming. 
  3. Currents feedback: Sea ice loss can cause vertical sea currents to weaken, reducing the cooling effect they had on the seabed. This can thus further cause sediments to warm up that can contain huge amounts of methane in the form of free gas and hydrates. 
  4. Storms feedback: Increased frequency and intensity of storms can cause substantially more vertical mixing of the sea water column, causing more warming of the seabed, thus further contributing to the warming of sediments, as above. 
  5. Storms feedback: Accelerated warming in the Arctic can result in more storms, causing mixing of cold Arctic air with warmer air from outside the Arctic. The net result is a warmer Arctic. 
  6. Storms feedback: More open waters can result in more storms that can push the ice across the Arctic Ocean, and possibly all the way out of the Arctic Ocean. 
  7. Storms feedback: Storms also cause more waves that break up the sea ice. Smaller pieces of ice melt quicker than large pieces. A large flat and solid layer of ice is also less susceptible to wind than many lighter and smaller pieces of ice that will stand out above the water and capture the wind like the sails of yachts. 
  8. Storms feedback: Storms cause waters to become more wavy. Calm waters can reflect much sunlight back into space, acting as a mirror, especially when the sun shines under a low angle. Wavy waters, on the other hand, absorb more sunlight. 
  9. Fires feedback: More extreme weather comes with heatwaves and storms. Thus, this is in part another storms feedback. The combination of storms and fires can be deadly. Heatwaves can spark fires that, when fueled up by storms, turn into firestorms affecting huge areas and causing huge amounts of emissions. Storms can whip up particles that when deposited on ice, snow or the bare soil, can cause more sunlight to be absorbed. 
  10. Open doors feedback: Accelerated warming in the Arctic causes the polar vortex and jet stream to weaken, causing more extreme weather and making it easier for warm air to enter the Arctic.

These ten feedback are depicted in the diagram below.