Showing posts with label IPCC. Show all posts

Thursday, August 26, 2021

Is the IPCC creating false perceptions, again?

IPCC AR6 Report

The Working Group I contribution to the Sixth Assessment Report (WG1 AR6) of the Intergovernmental Panel on Climate Change (IPCC) raises the question: Is the IPCC seeking to downplay the dire situation that we are in, again? 


Downplaying the temperature rise from pre-industrial

One of the first issues that comes up is the baseline. The IPCC uses 1850–1900 as a baseline, like it did before (in SR1.5). This is one out of many instances where the IPCC creates a perception that it would take many years before the 1.5°C threshold would be crossed. This 1850–1900 isn't pre-industrial. The Paris Agreement calls for pre-industrial as a base. 

The IPCC image on the right shows a 1.09°C rise from 1850–1900. This isn't the rise to the year 2020, but it is the rise to the period from 2011 to 2020. 

Instead, when taking the 2020 temperature rise and going back one century, NASA data show a 1.29°C rise from 1920, and this is a conservative figure, as 0.1°C can be added to translate NASA's sea surface temperatures into ocean air temperatures and another 0.1°C can be added for higher polar anomalies, which brings the temperature rise up to almost 1.5°C and this isn't the full rise from pre-industrial by a long shot.


Furthermore, the IPCC uses seasonally-biased data to "reconstruct" the temperature rise that took place prior to its baseline, making it look as if there was no rise before its baseline.

Instead, the rise from pre-industrial to 1920 could be as much as 0.3°C (1750 to 1920) + 0.2°C (1520 to 1750) + 0.29°C (3480 BC to 1520).

Adding up the rises for all these elements gives a total rise from pre-industrial to 2020 that could be as high as 1.29°C + 0.1°C + 0.1°C + 0.3°C + 0.2°C + 0.29°C = 2.28°C, as highlighted by above images and as further discussed at the pre-industrial page

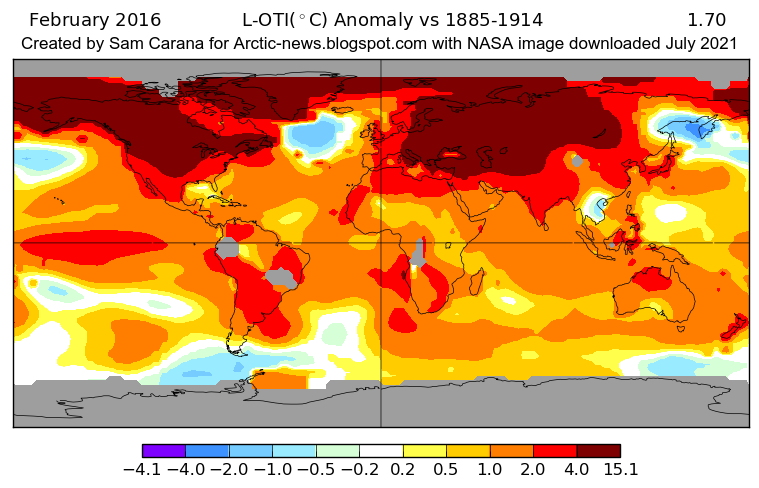
In February 2016, the temperature
was 1.70°C higher than in 1900
(i.e. 1885-1914, the 30-year period
centered around the start of 1900)
Ignoring peak peril by averaging over long periods

The map on the right shows that the average global temperature was 1.70°C higher in February 2016 than around 1900 (i.e. 1885-1914). The map also shows local anomalies as high as 15.1°C and even higher peaks were reached on specific days. 

This raises questions as to how the thresholds set at the Paris Agreement should be measured, i.e. is a threshold deemed to be crossed when the anomaly from pre-industrial crosses the threshold for a month, or for a year, or for a decade? Wouldn't a long period effectively grant polluters a long grace period to keep polluting? 

When in doubt, wouldn't downplaying the danger violate the precautionary principle?  

When building a bridge, an engineer will calculate how much load it can handle by first looking at how many heavy trucks will be using the bridge at times of PEAK traffic, rather than to average the weight of all vehicles on the bridge over a 30-year period. Caption and image by Sam Carana from earlier post.

Downplaying the near-term temperature rise

The Paris Agreement calls for politicians to limit the temperature rise to well below 2°C from pre-industrial, while calling upon the IPCC to describe pathways to achieve this. 

Instead of pointing at the policies that can best be  adopted, the IPCC uses Shared Socioeconomic Pathways (SSPs), and the only two scenarios for which the rise remains well below 2°C are SSP1-1.9 and SSP1-2.6 (images right).

The position of methane is of vital importance in these scenarios. As a requirement for both the SSP1-1.9 and SSP1-2.6 scenarios, methane emissions would need to have fallen since the year 2015. Even for SSP2-4.5, for which 2°C does get crossed, methane emissions would need to fall.

So, have methane levels fallen since 2015?

The image on the right shows NOAA globally averaged marine surface monthly means up to the most recent one which is April 2021. The NOAA annual mean methane data are:
in 2015: 1834 ppb
in 2016: 1843 ppb
in 2017: 1850 ppb
in 2018: 1857 ppb
in 2019: 1866 ppb (most recent IPCC level)
in 2020: 1879 ppb

Note also that above NOAA data are for global mean marine surface readings. At higher altitudes, even higher levels show up. The combination image below illustrates this, showing that the MetOp-1 satellite recorded a mean global methane level of 1956 ppb at 293 mb on September 2, 2021, am (panel left). The image in the right panel shows that the same satellite recorded much lower mean global methane levels, i.e. of 1894 ppb, closer to sea level, i.e. at 586 mb, on September 5, 2021, pm, while peak methane levels were as high as 2738 ppb and much methane was showing up over the Arctic Ocean. 


Ominously, methane reached very high peak levels recently. The Metop-2 satellite recorded a peak methane level of 3422 ppb at 469 mb on October 3, 2021, pm.

The image on the right shows high recent monthly average methane levels recorded at Barrow, Alaska. While this may not be representative for global methane levels, it does constitute a frightening warning of what may eventuate.

Stronger methane releases from subsea permafrost can be expected, says a paper by Natalia Shakhova et al. A 1000-fold methane increase could occur, resulting in a rise of as much as 6°C within 80 years, with more to follow after that, according to a paper by Atsushi Obata et al.

Seafloor methane releases could be triggered by strong winds causing an influx of warm, salty water into the Arctic ocean (see this earlier post and this page). Since little hydroxyl is present in the atmosphere over the Arctic, it is much harder for this methane to get broken down.

Even relatively small methane releases could cause tremendous heating, if they reach the stratosphere. Methane rises from the Arctic Ocean concentrated in plumes, pushing away the aerosols and gases that slow down the rise of methane elsewhere, which enables methane erupting from the Arctic Ocean to rise straight up fast and reach the stratosphere. IPCC AR6 gives methane a lifetime of 11.8 years. IPCC TAR gave stratospheric methane a lifetime of 120 years, adding that less than 7% of methane did reach the stratosphere at the time. 


The MetOp-1 satellite recorded a mean global methane level of 1956 ppb on September 11, 2021 am, at 293 mb. This corresponds with an altitude of some 9 km, which is where the Stratosphere starts at the North Pole. The conversion table shows that the Tropopause, which separates the Troposphere from the Stratosphere, is lower over the North Pole (at about 9 km altitude) than over the Equator (17 km altitude). 

[ click on images to enlarge ]
Mind you, the IPCC report does include some frightening images, such as one with a temperature rise of up to 17.5°C by 2300 (Figure 4.40), and one with CO₂ levels approaching 1200 ppm around 2100, corresponding with a temperature rise of up to 8°C (Figure 4.3).

What the IPCC doesn't mention is that at 1200 ppm CO₂e the clouds tipping point would get crossed that results in an additional 8°C temperature rise. With a high rise in methane levels and the GWP for methane calculated over a short horizon, such a huge temperature rise could eventuate within a few years time.

[ from earlier post ]
The IPCC downplays the methane threat by simply excluding the potential for a high rise in methane levels, while using a 100-year GWP for methane and while also waving away the potential for strong methane releases from oceans to the atmosphere.

For a really high methane emissions scenario, the image on the right shows a trend that is based on NOAA 2006-2020 annual global mean marine surface methane data and that points at a mean of 3893 ppb getting crossed by the end of 2026, a level less than twice as high as the recent 1956 ppb mean methane level.

Such a high mean methane level by 2026 cannot be ruled out, given the rapid recent growth in mean annual methane levels and with double-digit growth sustained beyond 2020 to date. It is deceptive to assume that methane levels have fallen and will continue to fall, the more so since the IPCC doesn't point at the most effective policies to achieve reductions in methane emissions.

By how much would such a doubling of the methane level raise the total carbon dioxide equivalent (CO₂e) level for greenhouse gases? A methane level of 3893 ppb would translate into 583.95 ppm CO₂e (at a GWP for methane of 150 for a 9-year horizon) or 778.6 ppm CO₂e (at a GWP for methane of 200 for a 5-year horizon). 

The image on the right shows trends based on IPCC AR6 GWP values pointing at a GWP for methane of 150 for a 9-year horizon and pointing at an even higher GWP for a shorter horizon. A short horizon is quite appropriate given that the above trend points at the possibility of such a high level for methane getting reached by 2026. 

Even with less methane, when using a short horizon for the GWP of methane and adding the impact of further greenhouse gases (carbon dioxide, nitrous oxide, water vapor, etc.), the 1200 ppm CO₂e clouds tipping point could get crossed by 2026. 

As said, the IPCC AR6 uses SSPs to depict rises or falls for emissions. For methane, emissions would need to have fallen since 2015 for both the SSP1-1.9 and SSP1-2.6 scenarios. The same goes for nitrous oxide, as the top panel of the image on the right indicates (see also this version).

Instead, however, as the image in the bottom panel indicates, recent nitrous oxide concentrations appear to follow a polynomial (blue) trend, rather than a linear (green) trend. In other words, growth in nitrous oxide releases is also accelerating.

Without implementation of effective policies, emissions cannot be expected to fall. Moreover, emission reductions alone will be insufficient to avoid a possibly sharp rise in temperature over the next few years. Sadly, the IPCC fails to outline pathways to improve the situation. 

Given that humans will likely go extinct with a 3°C rise, and a 5°C rise will likely end most life on Earth, the IPCC could have given a little more warning that a huge temperature rise may happen over the next few years.

Natural variability acts as a catalyst in this case. Within a few years time, sunspots will be reaching the peak of their cycle, and they are looking stronger than forecast.

An upcoming El Niño could raise surface temperatures significantly. The image below indicates that the difference between the top of El Niño and the bottom of La Niña could be more than half a degree Celsius. 


The image on the right indicates that the current La Niña is forecast to end early 2022. As temperatures keep rising, ever more frequent strong El Niño events are likely to occur, as confirmed by a recent study. Authors also confirm concerns that this IPCC report has downplayed the threat that a super El Nino event could occur soon.

Another large contribution to the upcoming temperature rise is the falling away of the cooling provided by sulphur that is currently co-emitted by industries such as coal-fired power plants, shipping and smelters. 

As cleaner alternatives become more economic, and as calls for cleaner air become stronger, this could result in a strong temperature rise soon, as discussed at the aerosols page

As illustrated by the bar on the right, there are many further elements that could dramatically push up the temperature soon. Altogether, the rise from pre-industrial could increase to more than 18°C by 2026

Decline of Arctic snow and ice can result in huge albedo losses, loss of latent heat buffer, jet stream changes, more and more extreme weather events, and more. Slowing down of the Atlantic meridional overturning circulation (AMOC) and increasing ocean stratification can result in less heat getting transferred from the atmosphere to the depths of the ocean, as also described at this page.

One of the largest threats is seafloor methane and despite repeated warning from some of the best experts in the field, the IPCC simply waves away this threat. This and other elements in the bar have been discussed in detail in many earlier posts such as this one and on the extinction page

Given these huge threats, how could the IPCC give the impression that there was a “carbon budget” to divide? The IPCC downplays the size, speed and ferocity of the temperature rise in many ways. What motivates the IPCC do this? One reason could be that the IPCC seeks to create the perception that there was such a “carbon budget” left to be divided among polluters, so they could comfortably keep adding further pollution for another decade or more. 

Sam Carana, restating a 2013 quote:
[ from the Quotes page ]

“There is no carbon budget to divide between polluters, instead there is just a huge debt of CO₂ to be removed from the atmosphere and the oceans. Comprehensive and effective action must be taken to combat run-away warming.”

It should have been obvious by now that there is no “carbon budget”. Instead, there's only a huge and very dangerous carbon debt. There is no room for trade-offs or offsets, and terms such as negative emissions are simply inappropriate. All efforts should be made to cut emissions, including ending current subsidies for fossil fuel and livestock, while carbon could and should additionally be removed from the atmosphere and oceans. And even then, it's questionable whether any species, let alone humans, will be able to survive the coming decade, so additional action will need to be taken as well. 

[ see the extinction page ]

Excluding the most appropriate policy tools, while instead advocating polluting pathways  

The IPCC creates a perception that pollution could continue for decades to come, by downplaying the temperature rise and by downplaying the threat of a huge rise within years, while promoting the idea that there was a “carbon budget” to be divided among polluters that would enable polluters to keep polluting for decades to come. Again, the IPCC has failed to do what the Paris Agreement calls for, i.e. for the IPCC to specify the pathways that will give the world a better future, specifically the policies that are needed to facilitate a better future. 

In the video below, Guy McPherson also discusses the report. 


Conclusions

This IPCC report should be returned to be rewritten, to instead focus on the best policies to facilitate the necessary changes. The scientific evidence in favor of what needs to be done is overwhelming, from all kinds of perspectives, while it's also simply the right thing to do. Most effective are feebates, i.e. imposing fees on polluting products while using the revenues to support rebates on better alternatives, and feebates are especially effective when implemented locally. Studies on the effectiveness of feebates were made available as early as 2005 and feebates have been discussed by the IMF, the OECD and the UN, and have been implemented in various ways, e.g. in the Clean Car Programme in New Zealand. The situation is dire and calls for the most comprehensive and effective action, as described at the Climate Plan


Links

• IPCC special report on the impacts of global warming of 1.5 °C above pre-industrial levels and related global greenhouse gas emission pathways (SR1.5)
https://report.ipcc.ch/sr15/

• Paris Agreement, adopted 2015
https://unfccc.int/sites/default/files/resource/docs/2015/cop21/eng/l09r01.pdf
https://arctic-news.blogspot.com/2015/12/paris-agreement.html

• Seasonal origin of the thermal maxima at the Holocene and the last interglacial - by Samantha Bova et al. (2021)
https://www.nature.com/articles/s41586-020-03155-x

• Changing El Niño–Southern Oscillation in a warming climate - by Wenju Cai et al. https://www.nature.com/articles/s43017-021-00199-z

• IPCC report may have underplayed risk of freak El Nino and La Nina events 
https://www.smh.com.au/environment/climate-change/ipcc-report-may-have-underplayed-risk-of-freak-el-ninos-and-la-ninas-20210820-p58klm.html

• IMF: Chapter 1. What Is the Best Policy Instrument for Reducing CO2 Emissions?, in: Fiscal Policy to Mitigate Climate Change - by Ruud de Mooij et al. (2012) 

• OECD: Are environmental tax policies beneficial? Learning from programme evaluation studies 

• UN: Policies and Legal Options to Promote the Energy Efficiency of Private Motor Vehicles 

• Feebates: An effective regulatory instrument for cost-constrained environmental policy - by  Kenneth Johnson 
https://www.sciencedirect.com/science/article/abs/pii/S0301421505002776

• NZ Ministry of Transport: Vehicle Purchase Feebate Scheme

• Clean Car Programme in New Zealand

• How much warming have humans caused?
https://arctic-news.blogspot.com/2016/05/how-much-warming-have-humans-caused.html

• A Temperature Rise Of More Than 18 Degrees Celsius By 2026?
https://arctic-news.blogspot.com/2021/06/could-temperatures-keep-rising.html

• Overshoot or Omnicide?
https://arctic-news.blogspot.com/2021/03/overshoot-or-omnicide.html

• Climate Plan
https://arctic-news.blogspot.com/p/climateplan.html

• Pre-industrial
https://arctic-news.blogspot.com/p/pre-industrial.html 

• Feebates
https://arctic-news.blogspot.com/p/feebates.html

• Quotes
https://arctic-news.blogspot.com/p/quotes.html

• Feedbacks
https://arctic-news.blogspot.com/p/feedbacks.html

• Extinction
https://arctic-news.blogspot.com/p/extinction.html

• Latent Heat
https://arctic-news.blogspot.com/p/latent-heat.html

• Aerosols
https://arctic-news.blogspot.com/p/aerosols.html 

• Can we weather the Danger Zone?
https://arctic-news.blogspot.com/2018/07/can-we-weather-the-danger-zone.html

• How much warmer is it now?
https://arctic-news.blogspot.com/2018/04/how-much-warmer-is-it-now.html

• When will we die?
https://arctic-news.blogspot.com/2019/06/when-will-we-die.html

• Most Important Message Ever
https://arctic-news.blogspot.com/2019/07/most-important-message-ever.html

• Methane levels threaten to skyrocket
https://arctic-news.blogspot.com/2014/09/methane-levels-threaten-to-skyrocket.html

• Just do NOT tell them the monster exists
https://arctic-news.blogspot.com/2013/10/just-do-not-tell-them-the-monster-exists.html

• 100% clean, renewable energy is cheaper
https://arctic-news.blogspot.com/2018/02/100-clean-renewable-energy-is-cheaper.html

• Negative-CO2-emissions ocean thermal energy conversion
https://www.sciencedirect.com/science/article/pii/S136403211830532X

• 'Electrogeochemistry' captures carbon, produces fuel, offsets ocean acidification
https://arctic-news.blogspot.com/2018/06/electrogeochemistry-captures-carbon-produces-fuel-offsets-ocean-acidification.html

• Olivine weathering to capture CO2 and counter climate change
https://arctic-news.blogspot.com/2016/07/olivine-weathering-to-capture-co2-and-counter-climate-change.html

• Biochar group at facebook
https://www.facebook.com/groups/biochar

• IPCC seeks to downplay global warming
https://arctic-news.blogspot.com/2018/02/ipcc-seeks-to-downplay-global-warming.html

• Blue Ocean Event
https://arctic-news.blogspot.com/2018/09/blue-ocean-event.html

• What Does Runaway Warming Look Like?
https://arctic-news.blogspot.com/2018/10/what-does-runaway-warming-look-like.html

• Ten Dangers of Global Warming
https://arctic-news.blogspot.com/p/ten-dangers-of-global-warming.html

• AGU poster, AGU Fall Meeting 2011
https://arctic-news.blogspot.com/p/agu-poster.html

Monday, November 16, 2020

Accelerated global warming and stadial cooling events: IPCC oversights regarding future climate trends

 by Andrew Glikson

The linear nature of global warming projections by the IPCC (2014) Assessment Report (AR5) (Figure 1) appears to take little account of stadial cooling events, such as have followed peak temperature rises in previous interglacial stages. The linear trends appear to take only limited account of amplifying positive feedback effects of the warming from land and ocean. A number of factors cast doubt on IPCC climate change projections to 2100 AD and 2300 AD, including:
Figure 1 (a) IPCC average surface temperature change to 2100 relative to 1986-2005 IPCC AR5;
(b) IPCC average surface temperature change to 2300 relative to 1986-2005 IPCC AR5

However, global temperature measurements for 2015-2020 indicate accelerated warming due to both the greenhouse effect reinforced by a solar radiation maximum (Hansen and Sato 2020) (Figure 2).

Figure 2. Accelerated Global Warming reinforced by both greenhouse 
gases and a solar maximum Hansen and Sato, 2020

The weakening of the northern Jet stream, due to polar warming and thus reduced longitudinal temperature contrasts, allows penetration of warm air masses into the polar region and consequent fires (Figure 3). The clash between tropical and polar air and water masses (Figure 3A) leads to regional storminess and contrasting climate change trajectories in different parts of the Earth, in particular along land-ocean boundaries and island chains. 

The weakening of the jet stream and migration of climate zones constitute manifestations of an evolving Earth’s energy imbalance¹, namely a decrease in reflection of solar radiation from Earth to space and thereby global warming. Earth retained 0.6 Watt/m² during 2005-2010 and 0.87 Watt/m² during 2010-2020 (Hansen and Sato 2020), primarily due to a rise in greenhouse gases but also due to a solar radiation peak. During 2015-2020 global warming rates exceeded the 1970-2015 warming rate of 0.18°C/per decade, a deviation greater than climate variability. Hansen and Sato (2020) conclude the accelerated warming is caused by an increasing global climate forcing, specifically by the role of atmospheric aerosols.

Figure 3 A. Undulating and weakening jet stream and the polar vortex and penetration
of warm air, inducing Arctic warming and fires.     B. Satellite images of Wildfires
ravaging parts of the Arctic
, with areas of Siberia, Alaska, Greenland and Canada
engulfed in flames and smoke. While wildfires are common at this time of year, record-
breaking summer temperatures and strong winds have made 2020 fires particularly bad.

Bronselaer et al., 2018 modelled a meltwater-induced cooling of the southern hemisphere toward the end 21st century by as low as -1.5°C (Figure 4A). Hansen et al. 2016 estimated the time frame of 21st century stadial cooling event as dependent on the rates of ice melt (Figure 4B), reaching near global extent toward the end of the century (Figure 4C).

Figure 4 A. 2080–2100 meltwater-induced sea-air temperature anomalies relative to
the standard RCP8.5 ensemble (Bronselaer et al., 2018). Hatching indicates where the
anomalies are not significant at the 95% level;  B. Negative temperature anomalies
through the 21st-22nd centuries signifying stadial cooling intervals (Hansen et al., 2016);
C. A model of Global warming for 2096, where cold ice melt water occupies large parts
of the North Atlantic and circum-Antarctica, raises sea level by about 5 meters and
decreases global temperature by -0.33°C (Hansen et al., 2016).

With the concentration of greenhouse gases rising by approximately 47% during the last century and a half, faster than almost any observed rise in the Cenozoic geological record, the term “climate change” refers to an extreme shift in state of the atmosphere-ocean system. The greenhouse gas rise and temperature rise rates are faster than those of the K-T mass extinction, the Paleocene-Eocene extinction and the last glacial termination.

The consequences for future climate change trends include:
  • Further expansion of the tropical climate zones and a polar-ward shift of intermediate climate zones, leading to encroachment of subtropical deserts over fertile Mediterranean zones. 
  • Spates of regional to continent-scale fires, including in Brazil, Siberia, California, around the Mediterranean, Australia.
  • A weakened undulating jet stream (Figure 3) allowing penetration of and clashes between warm and cold air and water masses, with ensuing storms. 
  • In Australia the prolonged drought, low vegetation moisture, high temperatures and warm winds emanating from the northern Indian Ocean and from the inland, rendering large parts of the continent tinder dry and creating severe fire weather subject to ignition by lightning.
  • The delayed melting of the large ice sheets due to hysteresis², would be followed by sea level rise to Pliocene levels, ~25 meters above pre-industrial levels, once sea level reaches equilibrium with temperature of 2 to 3 degrees Celsius or higher, changing the geography of the continents.
It would follow from these considerations that succeeding periods of peak temperatures, extensive melting of the ice sheets, flow of ice melt into the oceans and thereby stadial cooling would lead to clashes between tropical fronts and cooling masses of air, producing storminess, in particular along continental margins and island chains. The modelled time frame of these developments (Figure 4B) may be cyclical, or may extend further in time and place as long as the ice sheets continue to breakdown.


¹ Earth's energy imbalance is the difference between the amount of solar energy
absorbed 
by Earth and the amount of energy the planet radiates to space as heat.
If the imbalance is 
positive, more energy coming in than going out, we can expect
Earth to become warmer in t
he future — but cooler if the imbalance is negative.
² Hysteresis is the dependence of the state of a system on its history. For example the 
melting of an ice sheet may occur slowly depending on its previous state.

Andrew Glikson

Dr Andrew Glikson
Earth and Paleo-climate scientist
ANU Climate Science Institute
ANU Planetary Science Institute
Canberra, Australia


Books:
The Asteroid Impact Connection of Planetary Evolution
http://www.springer.com/gp/book/9789400763272
The Archaean: Geological and Geochemical Windows into the Early Earth
http://www.springer.com/gp/book/9783319079073
Climate, Fire and Human Evolution: The Deep Time Dimensions of the Anthropocene
http://www.springer.com/gp/book/9783319225111
The Plutocene: Blueprints for a Post-Anthropocene Greenhouse Earth
http://www.springer.com/gp/book/9783319572369
Evolution of the Atmosphere, Fire and the Anthropocene Climate Event Horizon
http://www.springer.com/gp/book/9789400773318
From Stars to Brains: Milestones in the Planetary Evolution of Life and Intelligence
https://www.springer.com/us/book/9783030106027
Asteroids Impacts, Crustal Evolution and Related Mineral Systems with Special Reference to Australia
http://www.springer.com/us/book/9783319745442


Friday, September 27, 2019

IPCC Report Ocean and Cryosphere in a Changing Climate


The IPCC has issued another special report: The Ocean and Cryosphere in a Changing Climate.

How much carbon is there in the Arctic?

[ click on images to enlarge ]
How much carbon is present in the northern circumpolar permafrost region (map)?

According to the report, there is 1460 to 1600 billions of tons of carbon (GtC¹) present in the soil on land. The report also mentions that there is additional carbon present on shallow Arctic sea shelves, but the report doesn't add figures.

Natalia Shakhova et al. once estimated the accumulated methane potential for the Eastern Siberian Arctic Shelf alone to be about 500 Gt of organic carbon, with an additional amount in hydrates of about 1000 Gt and a further amount of methane in free gas of about 700 Gt. Back in 2008, Natalia Shakhova et al. considered release of up to 50 Gt of predicted amount of hydrate storage as highly possible for abrupt release at any time.

Note ¹: 1 billion ton of carbon = 1 GtC = 1.33 Gt of CH₄ (methane) and 1 GtC = 3.67 Gt of CO₂ (carbon dioxide)

How much of these vast amounts could be released to the atmosphere?

The IPCC report projects permafrost near the surface (top 3–4 m) to decrease in area by up to 89% by 2100 under a high emissions scenario (RCP8.5), leading to cumulative release of tens to hundreds of billions of tons of carbon in the form of carbon dioxide and methane to the atmosphere by 2100.

The report fails to warn that, as the Arctic Ocean keeps heating up, huge seafloor methane eruptions could be triggered, and that this could happen within years, as discussed at the extinction page. Abrupt release of 10 Gt of methane would triple the amount of methane in the atmosphere, resulting in huge heating, while it would also trigger the clouds feedback tipping point to be crossed that in itself could push global temperatures up by 8°C within a few years, as earlier discussed in this post and this post.

Sea ice

The report notes that between 1979 and 2018, the areal proportion of multi-year Arctic sea ice at least five years old has declined by approximately 90%. The report refers to a study by Pistone that concludes that the additional heating due to complete Arctic sea ice loss would hasten global warming by an estimated 25 years. Below is a NASA video showing the melting away of the multi-year sea ice over the years.


The image below shows the difference in Arctic sea ice extent between the years, from an earlier post.


The report concludes that Antarctic sea ice extent overall has had no statistically significant trend. At the same time, the report notes that the Southern Ocean's share of the total heat gain in the upper 2000 m global ocean increased to 45–62% between 2005 and 2017. Below is an image illustrating the difference in Antarctic sea ice extent between the years.


The image below shows how much global sea ice extent has decreased over the past few years.

Sea ice decline makes that less sunlight gets reflected back into space and more heat gets absorbed by the ocean. The report also mentions latent heat changes and increased water vapor and increased cloudiness over the Arctic Ocean. Furthermore, as the temperature difference between the North Pole and the Equator narrows, the Jet Stream changes, which makes it more likely that a large influx of hot, salty water can enter the Arctic Ocean. While the IPCC acknowledges that permafrost thaw could release large amount of greenhouse gases, it fails to warn people about the potential for a huge, abrupt temperature rise as a result of the combined impact of warming elements, such as the one illustrated by the image below.


Meanwhile, the MetOp-1 satellite recorded a mean global methane level as high as 1914 parts per billion, on September 30, 2019, pm at 293 mb.


In the report launch press conference video below, IPCC authors respond to the question “May we have already passed the tipping point of abrupt and irreversible change and not knowing it yet?”


Valerie Masson-Delmotte, co-chair of WG1: “I would like to speak about irreversible change in this report. Irreversible means changes that will not be possible to be avoided on timescales of centuries, and climate change is already irreversible, due to the heat uptake in the ocean. We can't go back whatever we do with our emissions. Climate change is already irreversible.”

The situation is dire and calls for comprehensive and effective action, as described in the Climate Plan.


Links

• Climate Plan
https://arctic-news.blogspot.com/p/climateplan.html

• IPCC special report, The Ocean and Cryosphere in a Changing Climate
https://www.ipcc.ch/srocc/home

• Extinction
https://arctic-news.blogspot.com/p/extinction.html

• Most Important Message Ever
https://arctic-news.blogspot.com/2019/07/most-important-message-ever.html

• When Will We Die?
https://arctic-news.blogspot.com/2019/06/when-will-we-die.html

• Critical Tipping Point Crossed In July 2019
https://arctic-news.blogspot.com/2019/09/critical-tipping-point-crossed-in-july-2019.html

• Radiative Heating of an Ice‐Free Arctic Ocean, by Kristina Pistone et al.
https://agupubs.onlinelibrary.wiley.com/doi/abs/10.1029/2019GL082914

• Weekly Arctic Sea Ice Age with Graph of Ice Age By Area: 1984 - 2019, by NASA
https://svs.gsfc.nasa.gov/4750

• IPCC Report Climate Change and Land
https://arctic-news.blogspot.com/2019/08/ipcc-report-climate-change-and-land.html

• IPCC keeps feeding the addication
https://arctic-news.blogspot.com/2018/10/ipcc-keeps-feeding-the-addiction.html

• IPCC seeks to downplay global warming
https://arctic-news.blogspot.com/2018/02/ipcc-seeks-to-downplay-global-warming.html

• Just do NOT tell them the monster exists
https://arctic-news.blogspot.com/2013/10/just-do-not-tell-them-the-monster-exists.html


Friday, August 9, 2019

IPCC Report Climate Change and Land

The IPCC has just issued a special report Climate Change and Land, on climate change, desertification, land degradation, sustainable land management, food security, and greenhouse gas fluxes in terrestrial ecosystems. In its new report 'Climate Change and Land', the IPCC finds that vegan is the best diet to reduce emissions. Sadly, it is yet another missed opportunity to show some integrity.

[ click on image to enlarge ]
Indeed, little or nothing will change as long as the IPCC keeps downplaying the dire situation we're in.

As an example, the IPCC Report uses a very low value of 28 as Global Warming Potential (GWP) for methane, which is totally inappropriate and unacceptable given the rapidity at which the biosphere is deteriorating, given the accelerating pace at which extreme weather events are striking the land all around the world, and given the grim prospects for people worldwide in the absence of rapid and radical change.

The report finds that agriculture, forestry and other land use activities accounted for around 13% of carbon dioxide, 44% of methane, and 82% of nitrous oxide emissions from human activities globally during 2007-2016, representing 23% of total net anthropogenic emissions of greenhouse gases. If emissions associated with pre- and post-production activities in the global food system are included, the emissions could be as high as 37% of total net anthropogenic greenhouse gas emissions.

The Report adds an image showing that annual methane emissions from agriculture had reached some 4Gt CO₂eq in 2016. The IPCC notes that this 4Gt for methane's CO₂-eq is based on a GWP for methane of 28 over 100 years and without climate-carbon feedbacks, taken from its Fifth Assessment Report (AR5), published in 2014.

As said, the Report calculates that net greenhouse gas emissions from agriculture, forestry, and other land use were 23% of people's 2007-2016 emissions when using a GWP of 28 for methane. When using a GWP of 150, that share rises to 31%, as illustrated by the image on the right.

Instead of calculating methane's GWP over 100 years, a very short horizon is appropriate. Moreover, research published in 2016 and 2018 had already found methane to be more potent than IPCC's GWP for methane in AR5, as discussed in a recent post.

When using an appropriate GWP, the percentage of greenhouse gases coming from agriculture (in particular livestock products) increases dramatically, thus rightly highlighting the urgency for governments to act, e.g. by implementing local feebates, such as fees on livestock products and nitrogen fertilizers with revenues used to support soil supplements containing biochar, as recommended in a recent post.


Furthermore, the IPCC should have pointed the finger at the cartel of looters comprising fuel, meat, chemical and pharmaceutical industries and fuel-powered vehicle manufacturers and utilities that finances corrupt politicians and that goes hand in glove with a military-industrial complex that feeds on manufacturing conflict over resources that are the very cause of the wrath of pollution.

The situation is dire and calls for comprehensive and effective action, as described in the Climate Plan.


Links

• IPCC special report Climate Change and Land
https://www.ipcc.ch/report/srccl

• IPCC special report Global Warming of 1.5°C
https://report.ipcc.ch/sr15/

• IPCC keeps feeding the addiction
https://arctic-news.blogspot.com/2018/10/ipcc-keeps-feeding-the-addiction.html

• How much warming have humans caused?
https://arctic-news.blogspot.com/2016/05/how-much-warming-have-humans-caused.html

• Most Important Message Ever
https://arctic-news.blogspot.com/2019/07/most-important-message-ever.html

• Feedbacks
https://arctic-news.blogspot.com/p/feedbacks.html

• Extinction
https://arctic-news.blogspot.com/p/extinction.html

• Most Important Message Ever
https://arctic-news.blogspot.com/2019/07/most-important-message-ever.html

• How much warmer is it now?
https://arctic-news.blogspot.com/2018/04/how-much-warmer-is-it-now.html

• A rise of 18°C or 32.4°F by 2026?
https://arctic-news.blogspot.com/2019/02/a-rise-of-18c-or-324f-by-2026.html

• Climate Plan (page)
https://arctic-news.blogspot.com/p/climateplan.html

• Climate Plan (post)
https://arctic-news.blogspot.com/2019/06/climate-plan.html

• Olivine weathering to capture CO2 and counter climate change
https://arctic-news.blogspot.com/2016/07/olivine-weathering-to-capture-co2-and-counter-climate-change.html

Discussions

• Biochar
https://www.facebook.com/groups/biochar

• Geoengineering
https://www.facebook.com/groups/geoengineering

• Climate Alert
https://www.facebook.com/groups/climatealert

• Arctic News
https://www.facebook.com/groups/arcticnews

• Vegan Organic Food
https://www.facebook.com/groups/veganorganicfood

• Climate Plan
https://www.facebook.com/groups/climateplan


Saturday, October 13, 2018

IPCC keeps feeding the addiction


The IPCC just released its report Global Warming of 1.5°C. Things aren't looking good and instead of providing good advice and guidance, the IPCC bends over backward in efforts to keep feeding the addiction.

The Paris Agreement constitutes a joint commitment by all nations of the world to keep the temperature rise below 1.5°C. The IPCC should have honored this commitment by explaining that the situation is dire and by pointing at action to be taken to improve the situation.

Instead, the IPCC bends over backward to make it look as if temperatures were lower than they really are, in an effort to make it look as if there were carbon budgets to be divided, and polluters should be allowed to keep polluting until those budgets had run out. This is like saying that drug junkies who cause damage and are deeply in debt, should be handed over more OPM (other people's money, in this case the future of all people and other species).

In reality, there is no carbon budget to be divided, there is just a huge carbon debt to be repaid. The urgency and imperative to act is such that progress in one area cannot make up for delays elsewhere. The best policies should be implemented immediately, and everywhere across the world.

Use of terms such as trade-offs, net-outcomes, off-sets, carbon budgets and negative emissions is misguided and highly misleading. Policies based on giving and trading in permits to pollute are less effective than local feebates, i.e. policies that impose fees on sales of polluting products and then use the revenues to support rebates on the better alternatives sold locally.

Here are twelve instances where the IPCC is misleading:
  1. Changing the baseline set at the Paris Agreement
    The Paris Agreement is clear that pre-industrial is to be used as baseline. The IPCC defines pre-industrial as the multi-century period prior to the onset of large-scale industrial activity around 1750, and then proceeds to use as baseline 1850-1900, a period when the Industrial Revolution had long started. This compromises the entire Paris Agreement and thus the integrity of us all. Temperatures in 1900 may well have been 0.3°C higher than pre-industrial, as depicted in above image in the light blue block. Add up the impact of further warming elements and it may well be that people have caused around 2°C of warming already and that we're facing warming of more than 10°C by 2026.

  2. Misleading calculations and wording
    The IPCC suggests that warming caused by people is 1.0°C (±0.2°C), likely to reach 1.5°C between 2030 and 2052. To reach these numbers, the IPCC used misleading calculations in efforts to downplay how dangerous the situation is, as discussed further below. As an example of misleading wording, the IPCC says it has high confidence that 1.5°C won't be reached until 2030 if warming continues to increase at the current rate of 0.2°C per decade. Sure, if warming was 1.0°C and if the temperature rise was indeed increasing by 0.2°C per decade and if that rise would continue at 0.2°C per decade, yes, then it would take 25 years for warming to reach 1.5°C. But the reality is that warming is already far more than 1.0°C and that it is accelerating. That makes it misleading to associate high confidence with the suggestion that warming will not reach 1.5°C until 2030. The suggestion of a straight line (linear trend) is misleading in the first place, since warming is accelerating. The suggestion of a straight line is even more misleading when making projections into the future and when qualifications such as high confidence are added.

  3. Ignoring the importance of peaks
    Daily and monthly peaks are obviously higher than annual averages, and it's those high peaks that kill, making it disrespectful toward past and future victims of extreme weather events to average that away. The image on the right shows that in February 2016, it was on average 1.70°C warmer than in 1900 (1885-1914 i.e. a 30-year period centered around 1900), while the higher latitudes North had anomalies of up to 15.1°C. The IPCC failed to warn people, who mostly live on land on the Northern Hemisphere, how high anomalies were in February 2016. Conservatively, the magenta block at the top of the bar in above image shows a rise of 1.62°C for February 2016. Note that this is the rise from 1900, i.e. before adding 0.3°C for the rise before 1900, and before adding further adjustments as discussed below.

  4. Cherry-picking the baseline period
    The image on the right shows that, for a baseline of a 30-year period around the year 1900, the temperature rise to 2016-2017 was 1.25°C. When adding a further 0.3°C rise for the rise before 1900, warming was well above 1.5°C in 2016-2017. Yet, while first defining pre-industrial as the multi-century period prior to the onset of large-scale industrial activity around 1750, the IPCC then uses 1850-1900 as baseline, a period when it was relatively warm, i.e. warmer than in 1750 and warmer also than in 1900. It was warmer over 1850-1900 due to increasing livestock numbers and forests clearing, while huge amounts of wood were burned, all contributing to large emissions of black carbon, brown carbon, methane, CO, etc., which caused additional warming during this period. So, this period was relatively warm. There was little impact yet of the sulfur aerosols that started coming with burning fossil fuel from 1900. Choosing this period enabled the IPCC to beef up the temperature for its baseline and then draw trends that looks flatter than they would have been if drawn from pre-industrial, to suggest that global warming was only 1°C and that 1.5°C would not be reached until somewhere between 2030 and 2052.

  5. Changing the data
    The U.K. Met Office's HadCRUT dataset goes back to 1850. The IPCC used this dataset, but actually changed the data, by averaging the data with datasets that showed a similar rise for the years after 1900, but that showed higher warming for 1880-1900. This enabled the IPCC to further beef up the average temperature for the period 1850-1900 and then draw a linear trend from 1850-1900 that looks even flatter.

  6. Cherry-picking the type of data
    To further support its suggestions, the IPCC uses water surface data for ocean temperature, but uses air data for temperatures over land. When selecting datasets with more consistency and using air temperatures globally, the temperature rise is 0.1°C higher.

  7. Not using new techniques to estimate values for missing data
    The IPCC chooses not to use new techniques to estimate temperatures where data are missing. Less data are available for the Arctic, and this is precisely where temperatures have risen much faster than in the rest of the world. When values for missing data are included, the temperature rise is another 0.1°C higher.

  8. Leaving out 2016
    The IPCC says the Special Report is an assessment of the relevant state of knowledge, based on the scientific and technical literature available and accepted for publication up to 15 May 2018. Yet, the IPCC says that global warming is currently increasing at 0.2°C per decade, as if the high temperatures in 2016 didn't occur. To arrive at 0.2°C, the IPCC used the period of 2006-2015 and used data from a specific dataset, and then rounded down the value. By contrast, NASA data show a rate of increase of 0.3°C over 2006-2015, 0.4°C over 2007-2016 and 0.4°C over 2008-2017. Failure to properly address acceleration of future warming is further discussed in the point below. 

  9. Failure to properly address dangerous developments
    The IPCC fails to point out that carbon dioxide reaches a maximum in warming the atmosphere some 10 years after emission, which means that the full wrath of global warming due to the very high emissions of carbon dioxide over the past decade is yet to come. While temperatures could rise very rapidly over the coming decade, the IPCC keeps talking about carbon budgets, without properly addressing tipping points such as the decline of the snow and ice cover that will result in huge albedo losses, jet stream changes, more and more extreme weather events, and more. The IPCC fails to point out the danger of destabilization of sediments containing methane in the form of hydrates and free gas. Furthermore, the IPCC fails to properly address the aerosol warming that will occur as sulfur emissions decrease and other aerosols increase such as black carbon, brown carbon, etc. The IPCC fails to mention the water vapor feedback, i.e. the increase of water vapor in the atmosphere that will occur as a result of these developments. Since water vapor itself is a potent greenhouse gas, this will speed up the temperature rise even further. These developments could lead to a potential global temperature rise (from 1750) of more than 10°C by 2026, as illustrated in the image at the top.

  10. There is no carbon budget left
    Instead of pointing at the dangers, as it should have done, the IPCC makes it look as if there was a remaining carbon budget that should be divided among polluters, as if they should continue polluting the world. The IPCC creates this illusion by interpreting the thresholds set at the Paris Agreement as averages over a 30-year period, while ignoring the acceleration of the temperature rise. It should be obvious that there is no such budget. Instead, there's only a huge and very dangerous carbon debt. There is no room for trade-offs or offsets, and terms such as negative emissions are also inappropriate. All efforts should be made to cut emissions, including ending current subsidies for fossil fuel and livestock, while at the same time great effort should be taken to remove carbon from the atmosphere and oceans. And even then, it's questionable whether any humans will be able to survive the coming decade, which will be critically dangerous for all species on Earth.

  11. Suggesting polluting pathways
    The pathways suggested by the IPCC keep fossil fuel in the picture for many years, while highlighting non-solutions such as BECCS. The IPCC makes it look as if coal-fired power plants could continue to operate, by burning more biomass and capturing carbon. The IPCC makes it look as if transport could continue to use internal combustion engines, by burning more biofuel. Instead, clean & renewable energy has many benefits, including that it's more economic, so air capture powered by such facilities would make more sense than BECCS. Furthermore, electric vehicles should be supported now, rather than in the year 2050. It makes sense to stop fossil fuel subsidies, and to support better diets, to plant more vegetation and to support ways to add carbon and nutrients to soils and oceans, such as with biochar and ground rocks. Many technologies have been proposed, e.g. refrigerators and freezers are now made that do not use gases for cooling. The IPCC should not have used pathways that are wrong in the first place. Instead, the IPCC should have pointed at the policies that can best facilitate the necessary transitions, because the scientific evidence is overwhelming and it's the right thing to do.

  12. Not pointing at the best and much-needed policy tools
    The IPCC report fails to point out that imposing fees on polluting products is the most effective policy instrument, the more so when the revenues are used to support rebates on better alternatives supplied locally.
The situation is dire and calls for comprehensive and effective action, as described at the Climate Plan.

Prof. Peter Wadhams and Stuart Scott discuss the IPCC Global Warming of 1.5ºC report

Extended version of above video

Paul Beckwith on baseline, methane and more

Stuart Scott talks with Prof. Peter Wadhams on Arctic sea ice

Magnificent work by Stefanie Steven

[ budget ]
Proper analysis would have pointed at what the best action is to improve the situation.

However, the IPCC does not do that. Instead, the IPCC keeps stating that there was a carbon budget to be divided and consumed, while advocating non-solutions such as BECCS and while hiding the full extent of how threatening the situation is.

A quick word count of the IPCC report Global Warming of 1.5°C (SPM) shows paragraphs full of words such as budget (1st image right) and of non-solutions such as BECCS (2nd image right).

[ BECCS ]
At the same time, it fails to mention biochar, meat or local feebates. It fails to mention the huge threat of feedbacks and tipping points such as methane hydrates and Arctic sea ice, instead making it look as if all that could only pose potential problems over longer timescales.

This is indicative of how much the IPCC is part of the problem and part and parcel of the wilful destruction of life itself that is taking place so obviously all around us.

The IPCC (Intergovernmental Panel on Climate Change) might as well change its name to IPCD (Intergovernmental Panel on Climate Destruction).


It's not as if people weren't warned.
The danger was described back in 2007: Total Extinction.
The mechanism was depicted back in 2011: Runaway Global Warming.
And still, in 2018, the IPCC sadly keeps on feeding the addiction.


Links

• IPCC special report Global Warming of 1.5°C
https://report.ipcc.ch/sr15/

• Paris Agreement
https://arctic-news.blogspot.com/2015/12/paris-agreement.html
http://unfccc.int/documentation/documents/advanced_search/items/6911.php?priref=600008831
https://unfccc.int/resource/docs/2015/cop21/eng/l09r01.pdf

• How much warming have humans caused?
https://arctic-news.blogspot.com/2016/05/how-much-warming-have-humans-caused.html

• Climate Plan
https://arctic-news.blogspot.com/p/climateplan.html

• Feedbacks
https://arctic-news.blogspot.com/p/feedbacks.html

• Extinction
https://arctic-news.blogspot.com/p/extinction.html

• Can we weather the Danger Zone?
https://arctic-news.blogspot.com/2018/07/can-we-weather-the-danger-zone.html

• How much warmer is it now?
https://arctic-news.blogspot.com/2018/04/how-much-warmer-is-it-now.html

• 100% clean, renewable energy is cheaper
https://arctic-news.blogspot.com/2018/02/100-clean-renewable-energy-is-cheaper.html

• Fridges and freezers that don't use gases
https://www.facebook.com/groups/geoengineering/permalink/1794122703977728

• Negative-CO2-emissions ocean thermal energy conversion
https://www.sciencedirect.com/science/article/pii/S136403211830532X

• 'Electrogeochemistry' captures carbon, produces fuel, offsets ocean acidification
https://arctic-news.blogspot.com/2018/06/electrogeochemistry-captures-carbon-produces-fuel-offsets-ocean-acidification.html

• Olivine weathering to capture CO2 and counter climate change
https://arctic-news.blogspot.com/2016/07/olivine-weathering-to-capture-co2-and-counter-climate-change.html

• Biochar group at facebook
https://www.facebook.com/groups/biochar

• Aerosols
https://arctic-news.blogspot.com/p/aerosols.html

• IPCC seeks to downplay global warming
https://arctic-news.blogspot.com/2018/02/ipcc-seeks-to-downplay-global-warming.html

• Blue Ocean Event
https://arctic-news.blogspot.com/2018/09/blue-ocean-event.html

• What Does Runaway Warming Look Like?
https://arctic-news.blogspot.com/2018/10/what-does-runaway-warming-look-like.html

• Ten Dangers of Global Warming
https://arctic-news.blogspot.com/p/ten-dangers-of-global-warming.html

• AGU poster, AGU Fall Meeting 2011
https://arctic-news.blogspot.com/p/agu-poster.html