What is the mechanism behind accelerated warming of the Arctic Ocean, huge abrupt methane eruptions from the seafloor of the Arctic Ocean and skyrocketing temperatures?

1. Potential for Methane Release in Arctic
Vast amounts of methane are stored in hydrates under the seafloor of the Arctic Ocean. Furthermore, vast amounts of methane in the form of free gas are contained in sediments under the seafloor of the Arctic Ocean. Thirdly, vast amounts of carbon are frozen in the permafrost and much may enter the atmosphere in the form of methane as the permafrost continues to thaw.
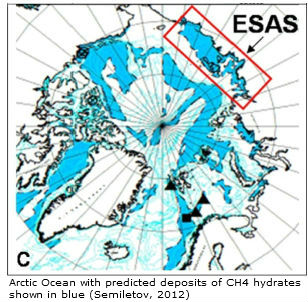 Natalia Shakhova et al. in 2010 estimated the accumulated potential for the East Siberian Arctic Shelf (ESAS) region alone (image on the right) as follows:
- organic carbon in permafrost of about 500 Gt
- about 1000 Gt in hydrate deposits
- about 700 Gt in free gas beneath the gas hydrate stability zone.
In early 2014, Sam Carana estimated annual methane emissions from hydrates and permafrost at 100 Tg (i.e. 0.1 Gt). This methane will contribute to further warming of the air over the Arctic and the North Atlantic, causing further extreme weather events, such as heatwaves and storms along the path of the Gulf Stream from the North Atlantic into the Arctic Ocean, in turn triggering further releases from hydrates at the seafloor of the Arctic Ocean and threatening to escalate into runaway global warming.

Such methane eruptions are caused by warming water of the Arctic Ocean, which in turn is due to emissions by people. Some elements of the mechanism causing methane to erupt from the seafloor are described in more detail below.
2. Ocean Heat
 |
| From: Ocean Temperature Rise continues |

Waters at greater depth are also warming rapidly, as illustrated by the image on the right, from an earlier post, showing a rise in ocean heat up to 2000 m deep that has more than doubled over the past decade. Data from 2005 through to 2014 contain a polynomial trendline that points at a similar rise by 2017, followed by an even steeper rise.
The North Atlantic is warming rapidly, with sea surface temperature anomalies as high as a 12°C (21.6°F) recorded east of North America earlier this year, as illustrated by the image below.
A warmer North Atlantic is a major contributor to the rapidly warming waters of the Arctic Ocean, since the Gulf Stream keeps carrying warmer water into the Arctic Ocean all year long.
A further contributor is a warmer North Pacific.
Further contributions come from the combined impact of numerous feedbacks, in particular changing winds and currents, cryosphere changes and methane releases, as further described below.
 |
| From: Watch where the wind blows |
3. Feedbacks: Changing Winds and Currents, Cryosphere Changes and Methane
- Changed Winds and Currents
Emissions by people are not only causing temperatures of the atmosphere and oceans to rise, they are also causing winds and ocean currents to change. Such changes can in turn result in heatwaves that are more intense and that persist for prolonged periods. Furthermore, strong northbound winds, combined with strong precipitation and waves can speed up the volume of warm water carried by Gulf Stream into the Arctic Ocean, as discussed in an earlier post.
Emissions by people are not only causing temperatures of the atmosphere and oceans to rise, they are also causing winds and ocean currents to change. Such changes can in turn result in heatwaves that are more intense and that persist for prolonged periods. Furthermore, strong northbound winds, combined with strong precipitation and waves can speed up the volume of warm water carried by Gulf Stream into the Arctic Ocean, as discussed in an earlier post.
A warming atmosphere, warming oceans and decline of the Arctic snow and ice cover all go hand in hand. The IPCC concluded in AR5 that, for RCP8.5, the Arctic Ocean will likely be nearly ice-free in September before mid-century. Prof. Peter Wadhams warned, back in 2012, that the Arctic Ocean could be virtually ice-free within a few years. An exponential trendline based on sea ice volume observations shows that sea ice looks set to disappear in 2019, while disappearance in 2015 is within the margins of a 5% confidence interval, reflecting natural variability, as discussed at the FAQ page.

Permafrost decline will cause Arctic temperatures to rise, due to albedo change and due to carbon that is contained in the permafrost and that can be expected to be released in the form of methane or carbon dioxide as the permafrost thaws. The image below pictures permafrost decline as foreseen by the IPCC in AR5.

Obviously, rapid decline of the sea ice will come with albedo changes that will also make the permafrost decline more strongly than the IPCC foresees, while they will also cause even more extreme weather events. One of the dangers is that huge amounts of warmer water will flow from rivers into the Arctic Ocean, as discussed below.
- Warmer Water From Rivers
More sunlight getting absorbed in the Arctic will accelerate warming of the Arctic Ocean directly, while there will also be warmer water flowing into the Arctic Ocean from rivers in Siberia and North America, fueled by stronger and longer heatwaves, storms and wildfires.
More sunlight getting absorbed in the Arctic will accelerate warming of the Arctic Ocean directly, while there will also be warmer water flowing into the Arctic Ocean from rivers in Siberia and North America, fueled by stronger and longer heatwaves, storms and wildfires.
 |
| map from: http://en.wikipedia.org/wiki/File:Rs-map.png |

Another area of concern, also marked with a purple oval in the image below, is located in the north of Canada.

More extreme weather events include heat waves, storms, floods and wildfires, all of which can contribute to more rapid warming of the Arctic Ocean.
The combined effect of all the above will be that methane that is now contained in the form of free gas and hydrates in sediments under the Arctic Ocean, can be expected to be increasingly released as the Arctic Ocean warms further.
- Methane
Of the vast amounts of methane stored in the Arctic, much of it is prone to be released with further temperature rises, as discussed in this earlier post and in this earlier post. Cracks in sediments used to be filled with ice. Warmer water is now melting the ice that used to sit in cracks. This ice has until now acted as a glue, holding the sediment together. Moreover, the ice in the cracks has until now acted as a barrier, a seal, that prevented the methane contained in those sediments from escaping. In a video interview with Nick Breeze, Natalia Shakhova mentions a sample of sediment taken from the ESAS seafloor in 2011 that turned out to be ice-free to a depth of 53 m at water temperatures varying from -0.6˚C to -1.3˚C. Back in 2008, Natalia Shakhova et al. considered release of up to 50 Gt of predicted amount of hydrate storage as highly possible for abrupt release at any time.
The image below, based on data from the IPCC and the World Metereological Organization (WMO), with an added observation from a NOAA MetOp satellite image, illustrates the recent rise of methane levels and the threat that methane levels will continue to rise rapidly.

When looked at from a longer range of years, above image fits in the black square on the image below.


Non-linear rise is supported by the fact that methane's lifetime increases as more methane enters the atmosphere. As the image below shows, peak methane levels have been very high recently.

All these feedbacks can interact and amplify each other in non-linear ways, resulting in rapid and intense temperature rises, as illustrated by the image below.
The threat is that such rapid temperature rises will appear at first in hotspots over the Arctic and eventually around the globe, while also resulting in huge temperature swings that could result in depletion of supply of food and fresh water, as further illustrated by the above image, from an earlier post, and the image below, from another earlier post.

Rapidly rising temperatures will cause stronger evaporation of sea water. Since water vapor is one of the strongest greenhouse gases, this can further contribute to the non-linear temperature rises pictured above.
In conclusion, the situation is dire and calls for comprehensive and effective action, as discussed at the Climate Plan blog.
More extreme weather events include heat waves, storms, floods and wildfires, all of which can contribute to more rapid warming of the Arctic Ocean.
The combined effect of all the above will be that methane that is now contained in the form of free gas and hydrates in sediments under the Arctic Ocean, can be expected to be increasingly released as the Arctic Ocean warms further.
- Methane
Of the vast amounts of methane stored in the Arctic, much of it is prone to be released with further temperature rises, as discussed in this earlier post and in this earlier post. Cracks in sediments used to be filled with ice. Warmer water is now melting the ice that used to sit in cracks. This ice has until now acted as a glue, holding the sediment together. Moreover, the ice in the cracks has until now acted as a barrier, a seal, that prevented the methane contained in those sediments from escaping. In a video interview with Nick Breeze, Natalia Shakhova mentions a sample of sediment taken from the ESAS seafloor in 2011 that turned out to be ice-free to a depth of 53 m at water temperatures varying from -0.6˚C to -1.3˚C. Back in 2008, Natalia Shakhova et al. considered release of up to 50 Gt of predicted amount of hydrate storage as highly possible for abrupt release at any time.
The image below, based on data from the IPCC and the World Metereological Organization (WMO), with an added observation from a NOAA MetOp satellite image, illustrates the recent rise of methane levels and the threat that methane levels will continue to rise rapidly.
When looked at from a longer range of years, above image fits in the black square on the image below.
The image below shows exponential rise based on data of East Siberian Arctic Shelf (ESAS) releases alone, as discussed in an earlier post.
All these feedbacks can interact and amplify each other in non-linear ways, resulting in rapid and intense temperature rises, as illustrated by the image below.
 |
| Diagram of Doom - for more background, see Feedbacks |
4. Runaway Global Warming
In conclusion, the situation is dire and calls for comprehensive and effective action, as discussed at the Climate Plan blog.
Post by Sam Carana.
5 comments:
Thank you very much Sam. As always, excellent work.
Where I live, in Saguenay Quebec, we still have very cold temps since early January. -20°C to -30°C nights predicted till march 6th!!! It's way more than unusual.
On Mr Soon issue, I learned last night that he was one of the scientist (while in fact he's an Aerospace engineer) in the IPCC; holy crap!
I saw part of an interview last night of Chris Hedges, he was talking to Abby Martin about Climate Change, the IPCC and Govts in general. He said: "If we trust within the system, they'll kill us."
All the evidence points towards that.
Followers can read this and watch the video: "Survivable IPCC projections are based on science fiction - the reality is much worse" Written by Nick Breeze: http://www.theecologist.org/blogs_and_comments/commentators/2772427/survivable_ipcc_projections_are_based_on_science_fiction_the_reality_is_much_worse.html
The hardest part is to get peoples attention, but you surely know that. Nevertheless, lets keep trying!
Have a nice day.
I am confused. I thought that global methane levels in 2014 were at 1840ppb (based on Guy McPherson) with some parts of the Arctic showing levels at around 2500ppb.
However, your article appears to show global levels at 2500ppb. have I missed something here? Could you clarify please?
Mean global methane levels go up and down over the course of the year. On the morning of September 7, 2014, mean global methane levels of 1839 ppb were recorded by the MetOp-1 satellite at altitudes from 6.9km to 8.1 km, as mentioned on the 1999-2011 image in the middle of the post.
Peak methane levels are much higher than the mean global levels. On November 16, 2014, a peak methane level of 2717 ppb was recorded, as mentioned on the 1750-2050 image underneath.
The image further down shows peak daily global methane levels recorded by the MetOp satellites in February 2015, i.e. the highest level recorded for each day. Peak methane levels have been very high throughout February 2015, as well as late January, 2015. MetOp-1 recorded methane levels as high as 2503 ppb on January 31, 2015. pm, at 586, with a mean of 1807 ppb, as shown on the image at https://www.facebook.com/photo.php?fbid=10155077158550161&l=1640d42c81, while it recorded mean levels of 1810 ppb that afternoon from 451 mb to 487 mb.
On February 28, 2015, by comparison, mean methane levels as high as 1917 ppb were recorded from 433 mb to 469 mb, while levels over 2400 ppb were recorded from 266 mb to 545 mb, with a peak of 2432 ppb at 367 mb.
Thank you Sam. Sharing.
Let's hope the world as disorganized as it is decides to create mechanism for putting fullest effort into reversing the Extinction event acceleration. Imagine the engine for new industry and retooling that would bring and the benefits indirect and direct to the well being and keeping of hope alive that would bring.
Internet communications can allow good ideas to flow into a program for quality improvement sustainable.. Certainly it is a duty, high to defend our home..
New comments are not allowed.