
Above image shows NASA annual mean 64°N-90°N land-ocean temperature anomalies from 1951-1980, with +0.59°C added for the rise from 1750 to 1951-1980. A polynomial trend is added (based on 1880-2016 data), pointing at 4.5°C anomaly by 2019.
 Will the Arctic keep warming over the coming years in line with this trend? Let's have a look at what affects temperatures in the Arctic most, specifically Ocean Heat, Sea Ice, Land Temperatures and Emissions.
1. Ocean Heat
Warmer Oceans on the Northern Hemisphere will contribute strongly to warming in the Arctic. Here's a graph showing a trend pointing at continued warming of the oceans on the Northern Hemisphere.
 Will oceans keep warming like that, in particular the North Atlantic? The Coriolis force keeps pushing warm water of the North Atlantic along the Gulf Stream toward the Arctic Ocean.
On the image on the right, the Gulf Stream shows up as the warmer water (orange and yellow) off the coast of North America.
Thus, as oceans keep warming, warmer water will reach the Arctic Ocean, melting the sea ice from below.
The image on the right shows that the sea surface was 9.3°C or 16.8°F warmer than 1981-2011 on May 7, 2017, at the location marked by the green circle.

Meanwhile, the sun will warm up the sea ice from above. The sea ice acts as a barrier, insulating the water of the Arctic Ocean from the heat from above. As long as there is sea ice, water just underneath the sea ice will stay close to freezing point.
Sea ice can strongly affect the amount of heat that is retained by Earth. Sea ice reflects most sunlight back into space, but in the absence of sea ice, most sunlight will instead be absorbed by oceans.
For almost a year now, global sea ice extent has been way below what it used to be, meaning that huge amounts of sunlight that were previously reflected back into space, are now instead getting absorbed by Earth, as shown by the graph below (by Wipneus).

 Over the past 365 days, most of the Arctic has been more than 2.5°C or 4.5°F warmer than it was in 1981-2010, as the image on the right illustrates. Note also the anomalies around Antarctica. Decline of the snow and ice cover contributes strongly to these temperature anomalies.
When looking at albedo changes, sea ice area is an even more critical measure than sea ice extent. For a discussion of the difference between area and extent, see this NSIDC page. The image below shows trends for both Arctic and Antarctic sea ice area pointing downward.

When looking at sea ice volume, zero sea ice in September 2017 is within the margins of the trendline below on the right.
 |
| [ Arctic sea ice, gone by Sept. 2017? ] |
Arctic sea ice is at a record low volume for the time of the year (see graph below by Wipneus). This means that there is very little sea ice left to act as a buffer this year. Therefore, heat that won't be consumed in the process of melting the ice will instead speed up Arctic warming.
As said - less sea ice additionally makes that less sunlight will be reflected back into space, and that instead more heat will speed up Arctic warming.

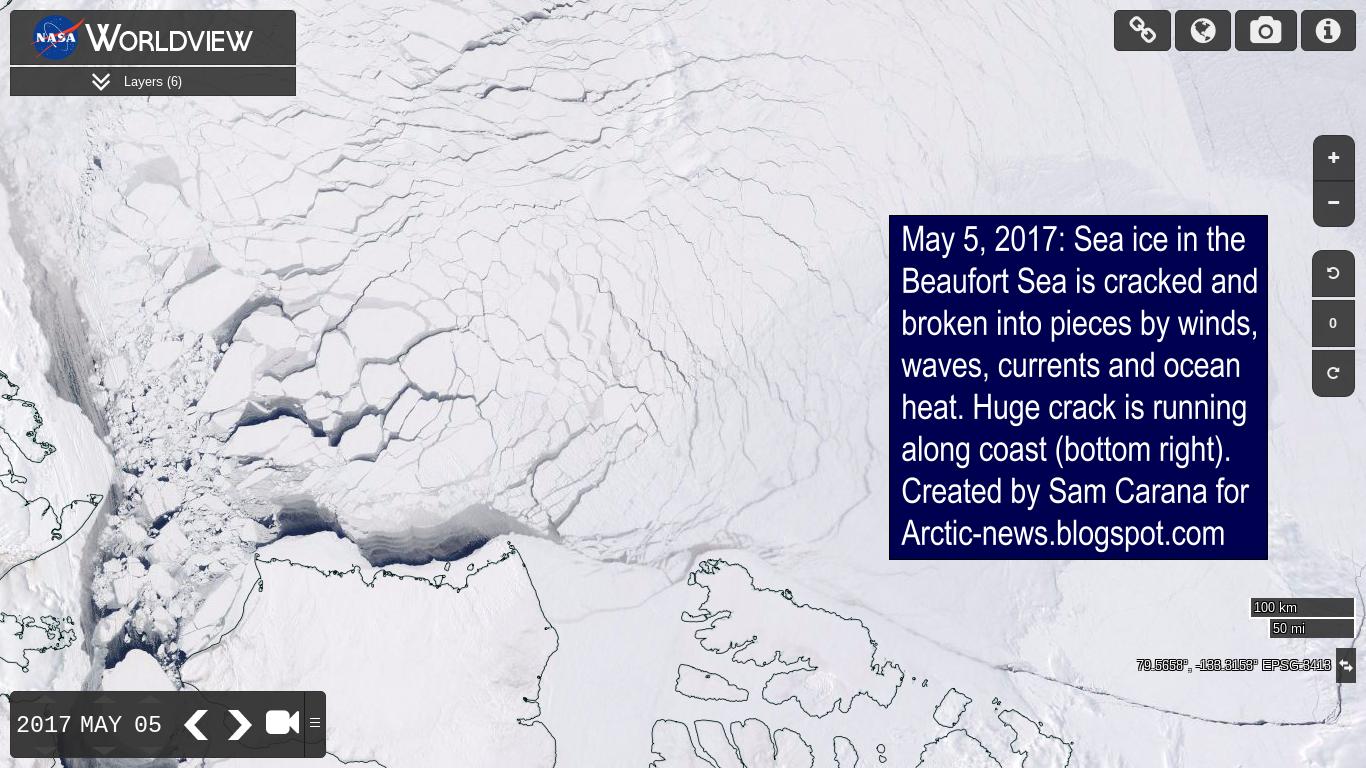
The satellite image below of the Beaufort Sea shows that the sea ice is cracked in many places and broken into pieces by winds, waves, currents and ocean heat. A huge crack can be seen running along the Canadian Archipelago toward Greenland (bottom right on the image).
An animation (1.3 MB) is added at the end of this post showing the sea ice breaking into pieces in the Beaufort Sea from April 26 to May 10, 2017. It illustrates that a combined force of winds, waves, currents and ocean heat can break even the thicker ice into pieces, with the danger that all ice can be pushed out of the Arctic Ocean.
3. Temperatures on land
High temperatures on land will affect the Arctic in a number of ways. What kind of temperatures can be expected over the coming months, which are so critical for Arctic sea ice?
- Heatwaves
Heatwaves over the continents can more easily extend over the Arctic Ocean as the Northern Polar Jet Stream becomes more wavy. Heatwave conditions are more likely to occur as the jet stream is changing due to accelerated warming of the Arctic.
- Wildfires
High temperatures on land can also cause wildfires that can in turn cause huge quantities of emissions, including soot that when settling on snow and ice, can strongly speed up melting. The image below shows carbon dioxide as high as 607 ppm and carbon monoxide as high as 24.84 over Laos on May 4, 2017.

- Warm water from rivers flowing into the Arctic Ocean
 Furthermore, high temperatures on land will warm up the water of rivers flowing into the Arctic Ocean.
- El Niño
An El Niño event can dramatically boost temperatures of the atmosphere. What are the projections for an El Niño in 2017? The image on the right, by the ECMWF (European Centre for Medium-Range Weather Forecasts), indicates an El Niño that is gaining strength.
4. Emissions and Greenhouse Gas Levels
Continued emissions and high greenhouse gas levels are responsible for warming of the planet. Have efforts to cut emissions been successful? Is growth in greenhouse gas levels slowing down? The image below shows accelerating growth of carbon dioxide levels recorded at Mauna Loa, Hawaii.


The image below shows methane levels at Barrow, Alaska.

The situation is dire and calls for comprehensive and effective action, as described in the Climate Plan.
The animation below shows the break up of the sea ice in the Beaufort Sea from April 26 to May 10, 2017. It illustrates that a combined force of winds, waves, currents and ocean heat can break even the thicker ice into pieces, with the danger that all ice can be pushed out of the Arctic Ocean.

No comments:
Post a Comment