Tuesday, January 11, 2022

Accelerating global warming and amplifying feedbacks: The imperative of CO₂ drawdown

by Andrew Glikson

Satellite measurements indicate that 2021 was one of the warmest years on record, with the past seven years being the hottest period recorded globally
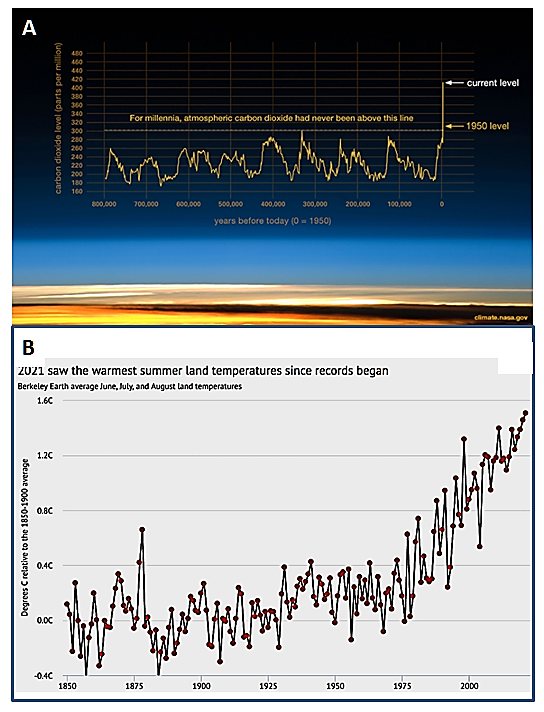
(Met Office, January 10, 2022). Attempts at global emission reductions, lowered in part due to COVID-19 economic slow-down, appear to have little effect on atmospheric CO₂ rise, as indicated by the current rise of atmospheric carbon dioxide to record high levels of 420 ppm despite reduced emissions in 2020-2021 (Figures 1 and 2).

Figure 1. A. Mean global CO₂ levels from 800,000 years to the present (NASA).
        B. Mean global temperature rise from 1850 to 2021 (Berkeley Earth).

As stated by CarbonBrief: “The year so far has been one of extremes, featuring record-shattering heatwaves, wildfires and flooding, as well as the warmest-ever northern-hemisphere summer – June, July and August – in the global land-surface record.”

Whereas climate negotiations mostly focus on possible reductions in emissions, the cumulative buildup of greenhouse gases is determining the future of the terrestrial climate. According to NASA “Once it’s (CO₂) added to the atmosphere, it hangs around, for a long time: between 300 to 1,000 years".

Other estimates are much longer. Because of the longevity of CO₂ and other greenhouses gases in the atmosphere, a decrease in carbon emissions, while essential, is not sufficient to reduce CO₂ levels in the atmosphere in time.

According to the IPCCabout 50% of a CO₂ increase will be removed from the atmosphere within 30 years, and a further 30% will be removed within a few centuries. The remaining 20% may stay in the atmosphere for many thousands of years”. According to the US EPA (Environmental Protection Agency) “Atmospheric lifetime: 50-200 years. No single lifetime can be defined for CO₂ because of the different rates of uptake by different removal processes”.

According to Solomon et al. (2009) and Eby et al. (2009) high levels of CO₂ on the scale of 10² to 10³ ppm would persist for millennia.

Global emission reductions, decreased in part due to COVID-19 economic slow-down, have little effect on the atmospheric CO₂ level, as indicated by the current trend of atmospheric carbon dioxide, at record high levels despite reduced emissions in 2020 (Figure 2). This suggests to a significant extent the current rise in atmospheric CO₂ arises from amplifying feedbacks from land and ocean.

Figure 2. A. Observed and forecast monthly and annual CO2 concentrations at Mauna Loa.
Observations from the Scripps CO2 program, forecasts from Met Office. Credit: Met Office.
B. Measured and forecast monthly CO2 concentrations at Mauna Loa Observatory, Hawaii.
Black line: measurements by the Scripps Institution of Oceanography, UC San Diego. Solid red line
with vertical uncertainty bars: forecast by the Met Office, including the revised forecast for 2020
issued in May 2020 accounting for reduced global emissions due to societal responses to Covid-19.
The forecast uncertainty estimate is ± 0.6 ppm. Dotted red line: original Met Office forecast for
2020 issued in January 2020, not accounting for Covid-related emissions reductions.
Horizontal dashed blue line: 417 ppm, a 50% increase above 278 ppm, the level in 1750-1800
from ice core records.

All taking place notwithstanding hollow promises made at COP26, a meeting noted for the near-absence of contributions by climate scientists.

In trying to avoid an exponential rise in greenhouse gases toward catastrophic levels, one option exists, namely urgent attempts at drawing down at least part of the CO₂ concentration of the atmosphere. The $trillions of dollars required, constituting the “Price of the Earth”, may not exceed the $trillion dollars military expenses spent by the world over the last 70 years, including nuclear missile fleets which constitute a separate threat for life on Earth, as warned by Albert Einstein: “The unleashed power of the atom has changed everything save our modes of thinking and we thus drift toward unparalleled catastrophe”.


Andrew Glikson
A/Prof. Andrew Glikson

Earth and Paleo-climate scientist
School of Biological, Earth and Environmental Sciences
The University of New South Wales,
Kensington NSW 2052 Australia

Books:
The Asteroid Impact Connection of Planetary Evolution
https://www.springer.com/gp/book/9789400763272
The Archaean: Geological and Geochemical Windows into the Early Earth
https://www.springer.com/gp/book/9783319079073
Climate, Fire and Human Evolution: The Deep Time Dimensions of the Anthropocene
https://www.springer.com/gp/book/9783319225111
The Plutocene: Blueprints for a Post-Anthropocene Greenhouse Earth
https://www.springer.com/gp/book/9783319572369
Evolution of the Atmosphere, Fire and the Anthropocene Climate Event Horizon
https://www.springer.com/gp/book/9789400773318
From Stars to Brains: Milestones in the Planetary Evolution of Life and Intelligence
https://www.springer.com/us/book/9783030106027
Asteroids Impacts, Crustal Evolution and Related Mineral Systems with Special Reference to Australia
https://www.springer.com/us/book/9783319745442
The Event Horizon: Homo Prometheus and the Climate Catastrophe
https://www.springer.com/gp/book/9783030547332
The Fatal Species: From Warlike Primates to Planetary Mass Extinction
https://www.springer.com/gp/book/9783030754679

Wednesday, January 5, 2022

Terrifying Arctic greenhouse gas levels continue

NOAA's September 2021 global mean methane reading is 1900.5 parts per billion (ppb), which is 15.8 ppb higher than the reading for September 2020. By comparison, NOAA's annual global mean methane increase for 2020 of 15.74 ppb was at the time the highest on record. 


Keep in mind that this 1900.5 ppb reading is for September 2021; it now is January 2022. Furthermore, NOAA's data are for marine surface measurements; more methane tends to accumulate at higher altitudes, and especially at higher latitudes North, as also illustrated by the images further below. 


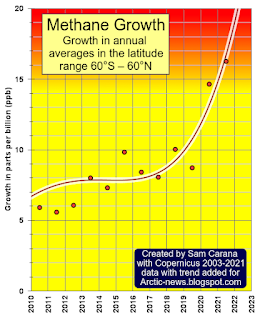
Above, a combination image of methane averages between latitudes 60°S and 60°N (top) and annual growth rates for these data (bottom) through to 2021, from a Copernicus news release.

The image on the right shows the Copernicus data for methane growth with an added trend that ominously points at a growth rate for 2022 that could be more than 20%. 

Keep in mind that these are data for the latitude range from 60°S and 60°N, whereas some very high methane concentrations are being recorded over the area within the Arctic Circle (66°30′ N).

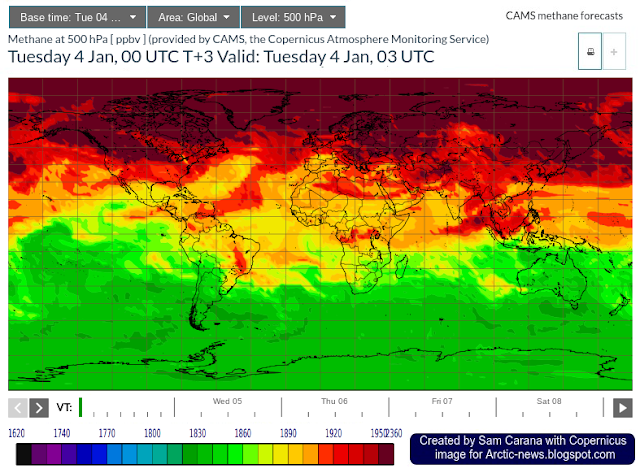
Very high greenhouse gas levels continue to show up over the Arctic. The image below, created with a Copernicus forecast for January 4, 2022, 03 UTC, shows methane at 500 hPa.


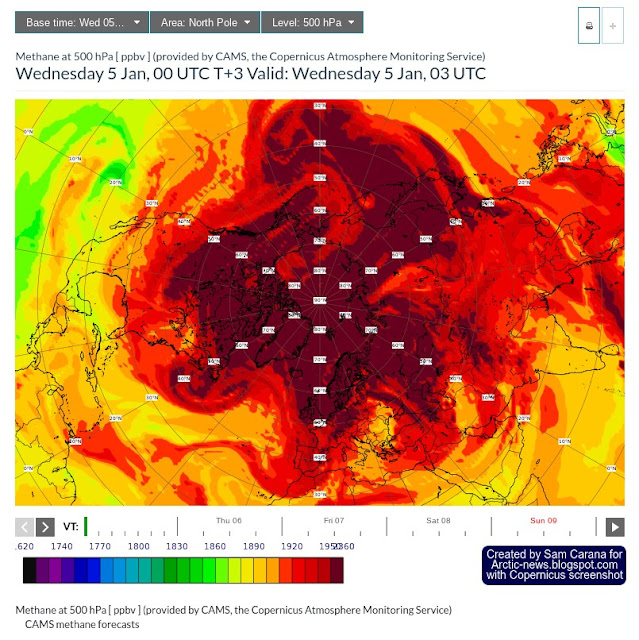
The image further down below is a screenshot of a Copernicus forecast for January 5, 2022, 03 UTC, again showing methane at 500 hPa, but this time using a North Pole projection. 

The darkest-brown color on the scale for 500 hPa on the Copernicus images (above and below) indicates methane concentrations of 1950 ppb and higher. 

While the Copernicus images show well that such concentrations (of 1950 ppb and higher) dominate over the Arctic at 500 hPa, the scales used by Copernicus have upper limits of 2300 ppb (300 hPa), 2360 (500 hPa) and 2320 (total column) which could give the false impression that higher concentrations did not occur at higher altitudes. 

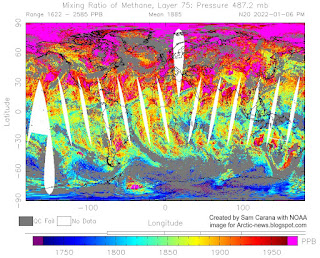
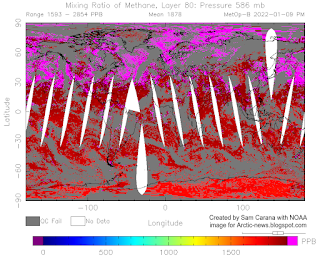
Higher methane concentrations do actually occur at around 500 hPa, as the images on the right illustrate. Such high peaks are important as they could be caused by abrupt methane releases rising in plumes from the seafloor of the Arctic Ocean.

The N20 satellite image on the right that shows concentrations of up to 2585 ppb at 487.2 mb (equivalent to 487.2 hPa) on January 6, 2022. 

Another recent example is the MetOp satellite peak reading on the right of 2854 ppb at 586 mb on January 9, 2022.

An earlier example is a MetOp satellite reading of up to 2861 ppb at 469 mb on December 31, 2021. 

Further examples are readings of up to 2852 ppb at 506 mb and up to 3644 ppb at 367 mb on November 21, 2021, pm.

The image below is a screenshot of a Copernicus forecast for January 5, 2022, 03 UTC, this time showing methane at surface level and using a Eurasia projection. Note that the darkest-brown color on the scale for surface level indicates methane concentrations above 2160 parts per billion (ppb).


The image below is a forecast for January 9, 2022, 03 UTC, run January 9, 2022, 00 UTC. The scale for this image goes up to 24840 ppb. That doesn't necessarily mean that concentrations are forecast to be as high as that; Copernicus has simply fixed the top end of the scale for 850 hPa at 24840 ppb. 


For its surface forecasts, Copernicus appears to use a combination of models and observations, with an emphasis on extrapolating from in situ measurements, which can ignore methane releases from locations where such in situ measurements are lacking, particularly over the Arctic Ocean. By contrast, the animation below of December 31, 2021 am, polar-orbiting MetOp satellite images, from an earlier post, shows the highest methane concentrations first emerging over water at higher latitudes North, rather than over land. 

Clearly, some very high methane concentrations are showing up over the Arctic. The image below shows monthly average in situ methane measurements recorded at Barrow, Alaska, with high averages showing up for recent months.


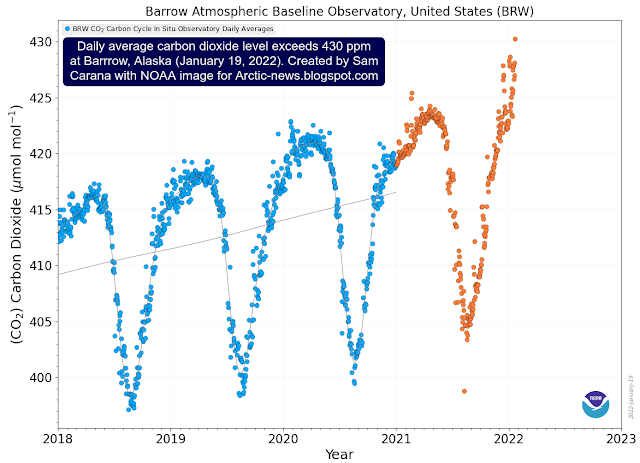
Furthermore, carbon dioxide levels also continue to be very high at Barrow, Alaska, as illustrated by the image below, showing a recent daily average exceeding 430 ppm.


Locally, CO₂ concentration can be even higher. The image below shows a concentration of 440 ppm over the Arctic Ocean at the green circle, as the jet stream crosses the Arctic on January 19, 2022. 


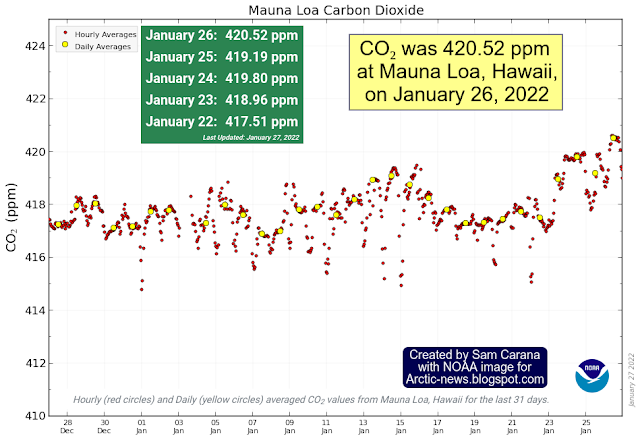
CO₂ concentration at Mauna Loa was 420.52 ppm on January 26, 2022. The annual peak for CO₂ is expected to occur about May 2022, so it will still go up a lot higher than this over the next few months.  


Why again is this growth in methane so terrifying?

The danger is that these high concentrations of greenhouse gases over the Arctic will contribute to high temperature anomalies in the Arctic and result in further decline of the snow and ice cover and associated changes to the Jet Stream, causing abrupt methane releases from submarine sediments containing hydrates and chambers of free gas.

The MetOp-B satellite recorded a mean methane level of 1958 ppb on October 25, 2021 am at 295 mb, and when using a 1-year GWP of 200, this translates into 391.6 ppm CO₂e. Together with the above CO₂, that's 391.6 + 420.52 = 812.12 ppm CO₂e.

Now add an additional 5 Gt of methane from an abrupt eruption of the seafloor, which is only 10% of the 50 Gt that Natalia Shakhova et al. warned about long ago, while 50 Gt is in turn only a small fraction of all the methane contained in sediments in the Arctic. On its own, such an eruption of seafloor methane could raise the global mean methane concentration by almost 2000 ppb which, at a 1-year GWP of 200, would translate into 400 ppm CO₂.

So, that would abruptly cause the joint CO₂e of just two greenhouse gases, i.e. methane and CO₂, to cross the 1200 ppm clouds tipping point, triggering a further 8°C global temperature rise, due to the clouds feedback.

The situation is dire and calls for the most comprehensive and effective action, as described at the Climate Plan.


Links

• NOAA - globally averaged marine surface monthly mean methane data
https://gml.noaa.gov/webdata/ccgg/trends/ch4/ch4_mm_gl.txt

• NOAA - globally averaged marine surface annual mean methane growth rates

• Copernicus news release

• Terrifying Arctic methane levels
https://arctic-news.blogspot.com/2021/12/terrifying-arctic-methane-levels.html

• NOAA - Infrared Atmospheric Sounding Interferometer (IASI) Sounding Products (MetOp)
https://www.ospo.noaa.gov/Products/atmosphere/soundings/iasi

• CAMS, the Copernicus Atmosphere Monitoring Service
https://atmosphere.copernicus.eu/charts/cams

• NOAA - Carbon Cycle Gases, Barrow Atmospheric Baseline Observatory, United States
https://gml.noaa.gov/dv/iadv/graph.php?code=BRW

• NOAA - Trends in Atmospheric Carbon Dioxide, Mauna Loa, Hawaii
https://gml.noaa.gov/ccgg/trends/graph.html

• Human Extinction by 2022?
https://arctic-news.blogspot.com/2021/11/human-extinction-by-2022.html

• Climate Plan
https://arctic-news.blogspot.com/p/climateplan.html


Sunday, December 12, 2021

Terrifying Arctic methane levels

A peak methane level of 3026 ppb was recorded by the MetOp-B satellite at 469 mb on December 11, 2021 am.

This follows a peak methane level of 3644 ppb recorded by the MetOp-B satellite at 367 mb on November 21, 2021, pm.


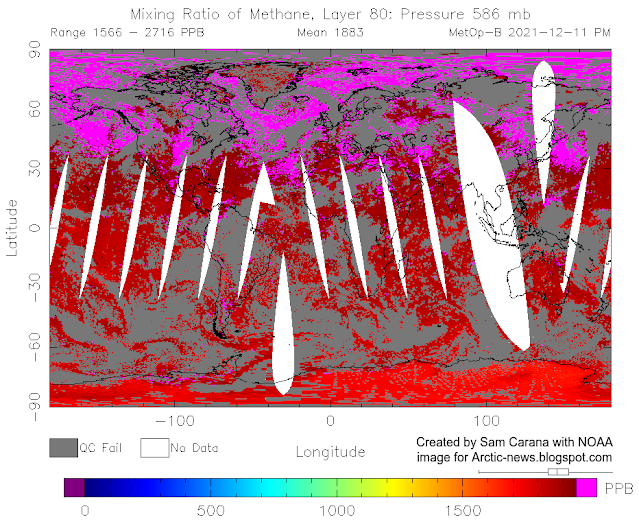
A peak methane level of 2716 ppb was recorded by the MetOp-B satellite at 586 mb on December 11, 2021, pm, as above image shows. This image is possibly even more terrifying than the image at the top, as above image shows that at 586 mb, i.e. much closer to sea level, almost all methane shows up over sea, rather than over land, supporting the possibility of large methane eruptions from the seafloor, especially in the Arctic. 

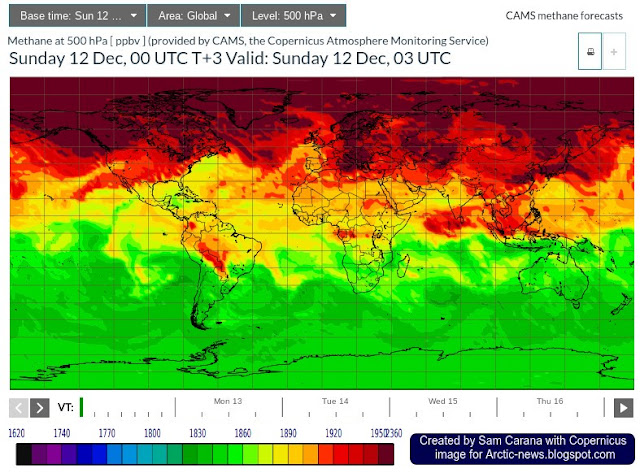
Also, the image was recorded later than the image at the top with the 3026 ppb peak, indicating that even more methane may be on the way. This appears to be confirmed by the Copernicus forecast for December 12, 2021, 03 UTC, as illustrated by the image below, which shows methane at 500 hPa (equivalent to 500 mb).


Furthermore, very high methane levels have recently been recorded at Barrow, Alaska, as illustrated by the image below, showing monthly averages.


And carbon dioxide levels have also been very high recently at Barrow, Alaska, as illustrated by the image below, showing daily averages. 


What causes these terrifying methane levels?

As the combination image below shows, the sea surface temperature north of Svalbard was as high as 4.3°C (or 39.74°F, green circle in the left panel) on December 12, 2021, i.e. as much as 5°C (or 9°F, green circle in the right panel) higher than 1981-2011.

[ click on images to enlarge ]

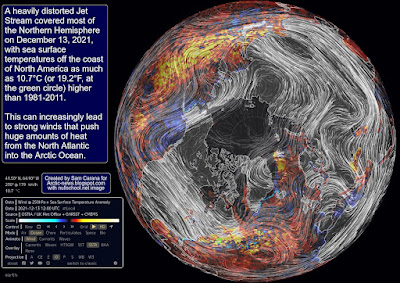
As temperatures in the Arctic keep rising faster than elsewhere in the world, the Jet Stream gets ever more distorted. The image on the right shows a heavily distorted Jet Stream covering most of the Northern Hemisphere on December 13, 2021, with sea surface temperatures off the coast of North America as much as 10.7°C (or 19.2°F, at the green circle) higher than 1981-2011.

At times, this can lead to very strong winds that push huge amounts of heat from the North Atlantic into the Arctic Ocean.

The image on the right is a forecast for December 14, 2021, showing strong wind causing waves as high as 8.3 m (or 27.2 ft) off the coast of Norway, speeding up the flow of warm water as it dives underneath the sea ice north of Svalbard. 

Huge amounts of heat can thus move into the Arctic Ocean, driven by ocean currents and temperature differences.

The danger is that warmer water will cause methane to erupt from the seafloor of the Arctic Ocean, as an earlier post warned.

[ The buffer is gone, from earlier post ]

Sea ice used to act as a buffer, by consuming energy in the process of melting, thus avoiding that this energy could raise the temperature of the water of the Arctic Ocean. As above image indicates, the buffer has now virtually disappeared. 

As sea ice gets thinner, ever less sea ice can act as a buffer. This is also illustrated by the 30-day navy.mil animation (up to November 12, the last 8 days are forecasts) on the right, from an earlier post.

Furthermore, huge amounts of heat did get transferred to the atmosphere over the Arctic Ocean, while and as long as sea ice was low in extent.

The image on the right, also from that earlier post, shows the October 2021 temperature anomaly, with anomalies over the Arctic showing up of as much as 9.1°C.

As the sea ice animation also shows, lower air temperatures after September caused the sea ice to grow in extent, effectively sealing off the Arctic Ocean and reducing heat transfer from the Arctic Ocean to the atmosphere.

Heat that was previously melting the ice or that was getting transferred to the atmosphere is now instead heating up the water. Some 75% of ESAS (East Siberian Arctic Shelf) is shallower than 50 m. Being shallow, these waters can easily warm up all the way down to the sea floor, where heat can penetrate cracks and conduits, destabilizing methane hydrates and sediments that were until now sealing off methane held in chambers in the form of free gas in these sediments.

Sealed off from the atmosphere by sea ice, greater mixing of heat in the water will occur down to the seafloor of the Arctic Ocean.

[  From the post September 2015 Sea Surface Warmest On Record ]
There are some further factors that can contribute to the high methane levels over the Arctic. As the sea ice grows in extent, this results in less moisture evaporating from the water, which together with the change of seasons results in lower hydroxyl levels at the higher latitudes of the Northern Hemisphere, in turn resulting in less methane getting broken down in the atmosphere over the Arctic.

Also, as land around the Arctic Ocean freezes over, less fresh water will flow from rivers into the Arctic Ocean. As a result, the salt content of the Arctic Ocean increases, all the way down to the seafloor of the Arctic Ocean, making it easier for ice in cracks and passages in sediments at the seafloor to melt, allowing methane contained in the sediment to escape. Meanwhile, salty and warm water (i.e. warmer than water that is present in the Arctic Ocean) keeps getting carried along the track of the Gulf Stream into the Arctic Ocean.

The threat

[ The Buffer has gone, feedback #14 on the Feedbacks page ]
The threat is that some of the extra heat will reach sediments at the seafloor of the Arctic Ocean that contain huge amounts of methane in currently still frozen hydrates and in pockets of gas underneath.

Cracks and holes in these sediments that are filled with ice can, as the ice melts away, become passageways for heat to destabilize hydrates, causing an eruption of gas as the methane expands to 160 times its frozen volume. The shockwave resulting from such an eruption can then destabilize neighboring hydrates.

This process threatens to result in ever more methane getting released, as illustrated in the image on the right, from an earlier post.


NOAA's most recent global mean methane reading is 1890.9 ppb for August 2021, with a trend of 1894.8 ppb. Meanwhile, NOAA's global mean methane level will have risen further (December levels are typically more than 10 ppb higher than August levels), while NOAA's data are also for marine surface measurements, and more methane tends to accumulate at higher altitudes. 

In other words, the current global mean of methane is now above 1900 ppb. Given that methane's concentration is rising at accelerating pace (see image right), the implication is that in an expanding troposphere, the volume of methane and thus its greenhouse effect will be rising even faster. 

A study published November 2021 in Science Advances finds a continuous rise of the tropopause in the Northern Hemisphere over 1980–2020, resulting primarily from tropospheric warming. 

As illustrated by the image below, methane on December 26 am, 2021, reached a global mean of 1939 ppb between 293 mb and 280 mb, while the highest peak level (2554 ppb) was reached higher in the atmosphere, at 218 mb.


[ click on images to enlarge ]
The animation on the right, showing methane on December 31, 2021 am, may be helpful in analysis of the origin of these terrifying methane levels.

The CO₂ level at Mauna Loa was 415.87 ppm on December 9, 2021. The MetOp-B satellite recorded a mean methane level of 1958 ppb on October 25, 2021 am at 295 mb, and when using a 1-year GWP of 200, this translates into 391.6 ppm CO₂e. Together, that's 391.6 + 415.87 = 807.47 ppm CO₂e.  

Now add an additional 5 Gt of methane from an abrupt eruption of the seafloor, which is only 10% of the 50Gt that Natalia Shakhova et al. warned about long ago, while 50 Gt is in turn only a small fraction of all the methane contained in sediments in the Arctic. Such an eruption of seafloor methane would raise the global mean methane concentration by almost 2000 ppb which, at a 1-year GWP of 200, would translate into 400 ppm CO₂.

So, that would abruptly cause the joint CO₂e of methane and CO₂ to cross the 1200 ppm clouds tipping point, triggering a further 8°C global temperature rise, due to the clouds feedback


A 5 Gt seafloor methane burst would double the methane in the atmosphere and could instantly raise CO₂e level to above 1200 ppm, thus triggering the cloud feedback (panel top right). Even with far less methane, levels of further pollutants could rise and feedbacks could strengthen, while sulfate cooling could end, and a 18.44°C rise (from pre-industrial) could occur by 2026 (left panel). Meanwhile, humans will likely go extinct with a 3°C rise, and a 5°C rise will likely end most life on Earth.


Conclusion

The situation is dire and calls for the most comprehensive and effective action, as described at the Climate Plan.


Links

• NOAA Infrared Atmospheric Sounding Interferometer (IASI) Sounding Products

• CAMS, the Copernicus Atmosphere Monitoring Service
https://atmosphere.copernicus.eu/charts/cams

• Carbon Cycle Gases, NOAA, Barrow Atmospheric Baseline Observatory, United States

• Nullschool.net

• Warning of mass extinction of species, including humans, within one decade


• Human Extinction by 2022?

• The Methane Threat
https://arctic-news.blogspot.com/2017/04/the-methane-threat.html

• High methane levels over the Arctic Ocean on January 14, 2014

• NOAA mean global monthly methane

• The Importance of Methane

• SCRIPPS - The Keeling Curve

• Will COP26 in Glasgow deliver?

• Continuous rise of the tropopause in the Northern Hemisphere over 1980–2020 - by Lingyun Meng et al.

• Frequently Asked Questions

• When Will We Die?


A Climate of Betrayal

5.9 $trillion spent by governments on fossil fuel subsidies in 2020

by Andrew Glikson

As indicated by the International Monetary fund, greenhouse gas emissions are funded world-wide by government subsidies totaling $5.9 trillion in 2020, about 6.8% global GDP, expected to rise to 7.4% of GDP in 2025, or $11million a minute. In the view of some scientists fuel subsidies are ‘adding fuel to the fire of the climate crisis’.

Hollow words by dignitaries at COP-out-26 may have led many to believe “leaders” are serious when they raise the alarm of “one minute to midnight”, while at the same time allowing the development of new oil, gas and coal mines enhancing the accelerating trend toward an inhabitability of large parts of the planet. The consequences of the continued transfer of extractable carbon to the atmosphere and oceans were summed up by James Hansen, the renowned climate scientist:

Burning all fossil fuels would create a very different planet than the one that humanity knows. The palaeoclimate record and ongoing climate change make it clear that the climate system would be pushed beyond tipping points, setting in motion irreversible changes, including ice sheet disintegration with a continually adjusting shoreline, extermination of a substantial fraction of species on the planet, and increasingly devastating regional climate extremes” and “this equates 400,000 Hiroshima atomic bombs per day 365 days per year”. James Hansen et al. 2012 and James Hansen 2012.

According to Climate 202 (6/12/2021), the Biden administration has approved more oil and gas drilling permits on public lands per month than the Trump administration did during the first three years of the Trump presidency.

In Europe, the year 2020 was supposed to be when the European Union would launch its ambitious plan to tackle the climate crisis, so why does Europe sabotage its own climate goals by subsidizing the fossil sector by more than €137 billion per year? (Figure 1)

Figure 1. Fossil fuel subsidies (in €) per capita in Europe (from Investigate Europe)

Banks continue to finance fossil fuels while signing up to net zero pledges (Nov 2021). The nations that make up the G7 have pumped billions of dollars more into fossil fuels than they have into clean energy since the Covid-19 pandemic, despite their promises of a green recovery. As the UK prepares to host the G7 summit, new analysis reveals that the countries attending committed $189bn to support oil, coal and gas between January 2020 and March 2021. By comparison, the same countries, the UK, US, Canada, Italy, France, Germany and Japan, spent $147bn on clean energy.

In Australia, business as usual continued, where fossil fuel subsidies reached $10.3 billion in 2020-21. Fossil fuel subsidies cost Australians a staggering $10.3 billion in 2020-21. Plans are made for a huge Beetaloo gas field in the Northern Territory. The Galilee coal project is proceeding and the Adani coal project gets ready to ship coal. Coal and gas works, if approved, would result in a nearly 30% increase in emissions within Australia.

Who or what would save nature and humanity from the accelerating destruction of the livable Earth atmosphere and oceans (Figure 2)?

Figure 2. The accelerating destruction of the livable Earth atmosphere and oceans (after Wil Steffen, 2012)