The image below shows sea ice extent as calculated by the Polar View team at the University of Bremen, Germany, updated August 25, 2012.
The image below, edited from the National Snow & Ice Data Center (NSIDC), shows the situation according to the NSIDC updated at August 23, 2012. It's clear that Arctic sea ice extent looks set to reach the 2007 record low within days, if it hasn't been reached already now.
For updates, see the daily images produced by the NSIDC. Note that, to calculate extent, both the NSIDC and the Univeristy of Bremen include areas that show at least 15% sea ice. In the image below, from the Danish Meteorological Institute (DMI), areas with ice concentration higher than 30% are included to calculate ice extent.
Friday, August 24, 2012
Monday, August 20, 2012
Record low sea ice area
Arctic sea ice area reached a record low of 2.87746 million square km on the 230th day of 2012, as illustrated on the image below by The Cryosphere Today. Below the sea surface temperature anomaly for August 20, 2012, by the National Oceanic and Atmospheric Administration (NOAA). The poster forms part of the updated presentation Why act now, and how? |
Sunday, August 19, 2012
Tipping Points
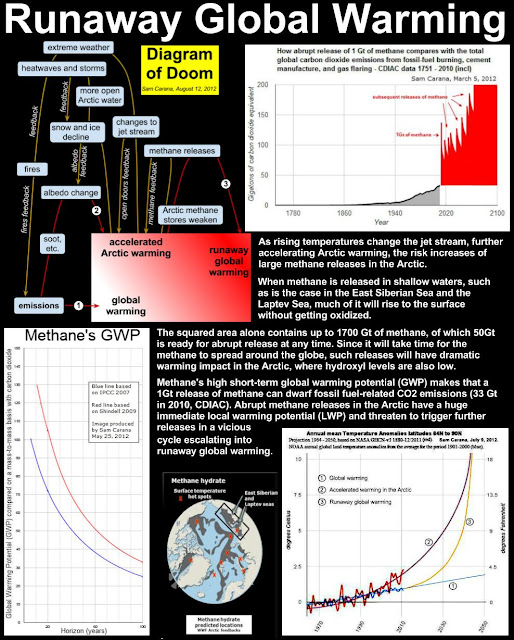
The increasing melt may be a harbinger of greater changes such as the release of methane compounds from frozen soils that could exacerbate warming, and a thaw of the Greenland ice sheet, which would contribute to rising sea levels, NASA’s top climate scientist, James Hansen, said in an e-mail interview, reports Bloomberg.
“Our greatest concern is that loss of Arctic sea ice creates a grave threat of passing two other tipping points -- the potential instability of the Greenland ice sheet and methane hydrates,” Hansen said. “These latter two tipping points would have consequences that are practically irreversible on time scales of relevance to humanity.”
Above image shows methane levels over a period of four years, from August 1, 2008, to August 1, 2012.
Above image shows methane levels over one years, from August 1, 2011, to August 1, 2012. This shows a marked increase in methane levels on the last of the four years further above.
Above image shows methane levels from August 1, 2012, to August 15, 2012. The image shows high levels of methane across the northern hemisphere. Note the high levels above Greenland.
Friday, August 17, 2012
Arctic sea ice updates
Above diagram shows sea ice extent as calculated by the Polar View team at the University of Bremen, Germany.
Paul Beckwith warns that a second cyclone is threatening to batter the remaining sea ice soon.
View Paul's presentation by clicking on the link below.
https://docs.google.com/file/d/0ByLujhsHsxP7cnB0bXhNNFFSQjQ/edit
Or, view the presentation in the window below (it may take some time for the file to fully load).


