Showing posts with label sea ice. Show all posts

Tuesday, July 16, 2019

Most Important Message Ever

This is the most important message ever posted.
Please share it widely and add your comments!
(click on share in the box underneath this post)

A catastrophe of unimaginable proportions is unfolding. Life is disappearing from Earth and runaway heating could destroy all life. At 5°C heating, most life on Earth will have disappeared. When looking only at near-term human extinction, 3°C will likely suffice. Study after study is showing the severity of the threat, yet too many keep ignoring or denying it, at the peril of the world at large. Have a look at the following:

Crossing the 2°C guardrail

The image below shows two trends, a long-term trend (blue) and a short-term trend (red) that better reflects El Niño peaks.


The image confirms an earlier analysis that it could be 1.85°C (or 3.33°F) hotter in 2019 than in 1750.

June 2019 was the hottest June on record, it was 2.08°C (or 3.74°F) hotter than the annual global mean 1980-2015, which was partly due to seasonal variations, as the image below shows.


This gives an idea of how hot it will be mid 2019. July 2019 is on course to be hottest month on record, further highlighting the danger that a strengthening El Niño could cause a steep temperature rise soon.

Remember the 2015 Paris Agreement, when politicians pledged to act on the threat of climate change, including by “Holding the increase in the global average temperature to well below 2°C above pre-industrial levels . . . ”

The image at the top highlights the danger of a rapid temperature rise occurring soon and of the 2°C (or 3.6°F) guardrail getting crossed soon, i.e. in 2020 (the blue long-term trend, based on 1880-June2019 data), or in 2019 (red trend, based on 2011-June 2019 data). Moreover, the danger is that temperatures will not come down after crossing 2°C, but instead will continue in a steep rise toward 3°C.


We are already at about 2°C above pre-industrial

In the image at the top, NASA data are adjusted, as discussed in an earlier post. Such adjustment is appropriate for a number of reasons. 

Firstly, NASA uses the period 1951-1980 as their default baseline. Most of the adjustment is due to the use of a 1750 baseline, which better reflects pre-industrial.

Furthermore, air temperatures over oceans and higher polar anomalies are more appropriate, as confirmed by a recent study that concludes that missing data have been responsible for an underestimation of global warming by 0.1°C, and as illustrated by the image on the right, from a recent study, which shows the difference between using surface air temperature globally (black line), versus when sea surface temperature are used for oceans (dark blue line) and in case of incomplete coverage (light blue line).

At a 3°C rise, humans will likely go extinct

The image at the top shows two trends, a long-term trend in blue and a short-term trend in red which follows variations such as El Niño more closely. The blue trend points at a 3°C (or 5.4°F) rise by 2026, while the red trends shows that a 3°C rise could eventuate as early as in 2020 in case of a persistently strengthening El Niño.

At a 3°C rise, humans will likely go extinct, as habitat for humans (and many other species) will disappear. Such a rise will cause a rapid decline of the snow and ice cover around the globe, in turn making that less sunlight gets reflected back into space. Associated changes are discussed in more detail at this page and this page, and include that the jet stream will further get out of shape, resulting in more extreme weather events such as droughts, heatwaves and firestorms. Changes to the jet stream will also contribute to a further strengthening of storms, which threatens to push large amounts of hot, salty water into the Arctic Ocean, triggering eruptions of more and more seafloor methane.

From a 4°C rise, Earth will have a moist-greenhouse scenario

As the temperature rise gains further momentum, runaway heating may well turn Earth into a lifeless planet. This danger was discussed in a 2013 post, warning that, at 4°C rise, Earth will enter a moist-greenhouse scenario and without anything stopping the rise, it will continue to eventually destroy the ozone layer and the ice caps, while the oceans would be evaporating into the atmosphere's upper stratosphere and eventually disappear into space.

[ from an earlier post ]
At 5°C rise, most life on Earth will be extinct

At 5°C rise, most life on Earth will be extinct. A 2018 study by Strona & Bradshaw indicates that most life on Earth will disappear with a 5°C rise (see box on the right).

As the temperature keeps rising, chances are that all life on Earth will go extinct, as Earth would be left with no ozone layer to protect life from deadly UV-radiation. Furthermore, Earth would no longer have water, an essential building block of life. Soil moisture, ground water and water in oceans would evaporate and eventually disappear into space, as discussed in an earlier post.

There are several reasons why the temperature will keep rising well beyond a 5°C rise, as discussed below.

Could Earth go the same way as Venus?

At first glace, such a lifeless planet scenario may seem unlikely, as Earth did experience high temperatures before, but each time it did cool down again. While many species went extinct as a result of steep temperature rises, each time some species did survive the mass extinction events in the past.

This time, however, the situation is much more dire than during previous mass extinctions, and temperatures could keep rising, due to:
  • Brighter Sun - The sun is now much brighter than it was in the past;
  • No sequestration - The rapidity of the rise in greenhouse gases and of the associated temperature rise leaves species little or no time to adapt or move, and leaving no time for sequestration of carbon dioxide by plants and by deposits from other species, nor for formation of methane hydrates at the seafloor of oceans; 
  • No weathering - The rapidity of the rise also means that weathering doesn't have a chance to make a difference. Rapid heating is also dwarfing what weathering (and vegetation) can do to reduce carbon dioxide levels; and
  • Methane - Due to the rapid temperature rise, there is also little or no time for methane to get decomposed. Methane levels will skyrocket, due to fires, due to decomposition of dying vegetation and due to releases from melting terrestrial permafrost and from the seafloor (see more on methane further below). 

The methane threat

Our predicament

The predicament of this geological time is that methane in hydrates has been accumulating for a long time, especially in the Arctic, where there is little or no hydroxyl present in the atmosphere in the first place, while some 75% of the East Siberian Arctic Shelf (ESAS) is shallower than 50 m, as also discussed in this earlier post and this earlier post.

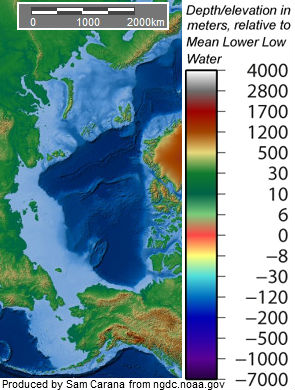
As more methane rises abruptly from the seafloor in plumes, the chance reduces that it will get decomposed in the water, and especially so in the Arctic where long uni-directional sea currents prevent microbes to return to the location of such plumes.

Shallow seas (light blue areas on the image on the right) make waters prone to warm up quickly during summer peaks, allowing heat to penetrate the seabed.

Methane rising through shallow waters will also enter the atmosphere more quickly. Elsewhere in the world, releases from hydrates underneath the seafloor will largely be oxidized by methanotroph bacteria in the water. In shallow waters, however, methane released from the seabed will quickly pass through the water column.

Large abrupt releases will also quickly deplete the oxygen in the water, making it harder for bacteria to break down the methane.

[ from an earlier post ]
The image on the right highlights methane's accelerating rise, showing levels of methane (CH₄), carbon dioxide (CO₂) and nitrous oxide (N₂O) in the atmosphere that are, respectively, 257%, 146% and 122% their 1750 levels.

Hydroxyl depletion extending methane's lifetime

The graph on the right also shows that methane levels in the atmosphere remained almost unchanged during the period 2000-2007. One explanation for this is that, as the world heated up due to the rising levels of greenhouse gases in the atmosphere, the amount of water vapor in the atmosphere rose accordingly (at a rate of 7% for each degree Celsius rise), which translated into more hydroxyl getting produced that resulted in more methane getting decomposed. So, while methane emissions kept rising, the amount of methane in the atmosphere remained relatively stable, as more methane got decomposed. Eventually, in 2007, the continued rise in methane emissions started to overwhelm the capacity of hydroxyl to decompose methane.  

The danger is that, as huge amounts of methane get released rapidly, hydroxyl depletion will extend its lifetime, in turn further accelerating heating and resulting in further releases of seafloor methane.

Methane's GWP

Measured over a few years, methane's global warming potential (GWP) is very high. The image on the right, from IPCC AR5, shows that over a 10-year timescale, the current global release of methane from all anthropogenic sources exceeds all anthropogenic carbon dioxide emissions as agents of global warming; that is, methane emissions are more important than carbon dioxide emissions for driving the current rate of global warming.

The values for methane's GWP that are used in the image on the right are also used in the image below, which shows that over the first few years, methane's GWP is more than 150 times higher than carbon dioxide.


Above image is actually conservative, as the IPCC also gives higher values for methane's GWP in AR5, i.e. for fossil methane and when including climate change feedbacks, while there also is additional warming due to the carbon dioxide that results from methane's oxidation. Furthermore, research published in 2016 and 2018 found methane to be more potent than IPCC's GWP for methane in AR5, so it seems appropriate to use 150 as methane's GWP for periods of a few years.

Self-reinforcing feedback loops further accelerate heating in the Arctic and just one of them, seafloor methane, could suffice to cause runaway heating.

from an earlier post (2014)  
As the image below shows, in which a GWP of 150 for methane is used, just the existing carbon dioxide and methane, plus seafloor methane releases, would suffice to trigger the clouds feedback tipping point to be crossed that by itself could push up global temperatures by 8°C, within a few years.


As described on above image and in an earlier post, a rapid temperature rise could result from a combination of elements, including albedo changes, loss of sulfate cooling, and methane released from destabilizing hydrates contained in sediments at the seafloor of oceans.

[ from an earlier post ]
In the video below, Professor Peter Wadhams and Stuart Scott discuss the threat of large methane releases (recorded March 2019, published July 2019).


Seafloor methane releases could be triggered soon by strong winds causing an influx of warm, salty water into the Arctic ocean, as described in an earlier post and discussed in the 2017 video below. In the above images, methane is responsible for a temperature rise of as much as 1.1°C in a matter of years, but the rise won't stop there. A study published in 2012 calculates that 1000-fold methane increase could occur resulting in a rise of as much as 6°C within 80 years, with more to follow after that.


In the May 2019 video below, Professor Guy McPherson and Thom Hartmann discuss our predicament.


The situation is dire and calls for comprehensive and effective action, as described in the Climate Plan.


Links

• Extinction Alert
https://arctic-news.blogspot.com/2019/02/extinction-alert.html

• Geographical Distribution of Thermometers Gives the Appearance of Lower Historical Global Warming - by Rasmus Benestad et al.
https://agupubs.onlinelibrary.wiley.com/doi/full/10.1029/2019GL083474

• July on course to be hottest month ever, say climate scientists - The Guardian
https://www.theguardian.com/environment/2019/jul/16/july-on-course-to-be-hottest-month-ever-say-climate-scientists

• Radiative forcing of carbon dioxide, methane, and nitrous oxide: A significant revision of the methane radiative forcing - by Maryam Etminan et al. (2018)
https://agupubs.onlinelibrary.wiley.com/doi/full/10.1002/2016GL071930

• Large regional shortwave forcing by anthropogenic methane informed by Jovian observations - by William Collins et al. (2016)
https://advances.sciencemag.org/content/4/9/eaas9593

• Estimating and tracking the remaining carbon budget for stringent climate targets - by Joeri Rogelj et al.
https://www.nature.com/articles/s41586-019-1368-z

• As El Niño sets in, will global biodiversity collapse in 2019?
https://arctic-news.blogspot.com/2018/11/as-el-nino-sets-in-will-global-biodiversity-collapse-in-2019.html

• Methane hydrates
https://methane-hydrates.blogspot.com/2013/04/methane-hydrates.html

• Damage of Land Biosphere due to Intense Warming by 1000-Fold Rapid Increase in Atmospheric Methane: Estimation with a Climate–Carbon Cycle Model, by Atsushi Abata et al. (2012)
https://journals.ametsoc.org/doi/full/10.1175/JCLI-D-11-00533.1

• Extreme weather
https://arctic-news.blogspot.com/p/extreme-weather.html

• Feedbacks in the Arctic
https://arctic-news.blogspot.com/p/feedbacks.html

• Albedo and Latent Heat
https://arctic-news.blogspot.com/p/albedo.html

• Earth is on the edge of runaway warming
https://arctic-news.blogspot.com/2013/04/earth-is-on-the-edge-of-runaway-warming.html

• When Will We Die?
https://arctic-news.blogspot.com/2019/06/when-will-we-die.html

• Warning of mass extinction of species, including humans, within one decade
http://arctic-news.blogspot.com/2017/02/warning-of-mass-extinction-of-species-including-humans-within-one-decade.html

• Climate Plan
https://arctic-news.blogspot.com/p/climateplan.html


Wednesday, May 1, 2019

Greenhouse Gas Levels Keep Accelerating

Carbon Dioxide


Weekly CO₂ (carbon dioxide) levels at Mauna Loa, Hawaii, in May, 2019, reached 415.39 ppm, as above image shows. An ominous trendline points at 420 ppm in 2020.


The daily average CO₂ level recorded by NOAA at Mauna Loa, Hawaii, on May 15, 2019, was 415.64 ppm, as above image shows. The image below also shows hourly average levels from April 15, 2019, to May 15, 2019.


Current CO₂ levels far exceed levels that were common during the past 800,000 years, as the image below shows. CO₂ levels moved between roughly 180 and 280 ppm, while the temperature went up and down by some 10°C or 18°F.


The daily average CO₂ level recorded by scripps.ucsd.edu at Mauna Loa, Hawaii, on May 13, 2019, was 415.5 ppm and the May 15, 2019, level was 415.7 ppm. On May 14, 2019, one hourly average exceeded 417 ppm.


The situation is dire

This level of 417 ppm is 139 ppm above the CO₂ level in the year 1750 and more than 157 ppm above what the CO₂ level would have been if levels had followed a natural trend. As shown by the inset (from Ruddiman et al.) in above image, a natural trend points at levels below 260 ppm.

Furthermore, methane levels are rising even faster than CO₂ levels. While CO₂ levels did rise by 146% since 1750, methane levels did rise by 257% since that time and there is much potential for an even faster rise in methane levels due to seafloor hydrate releases. Levels of nitrous oxide also keep rising rapidly.

Such a rise in greenhouse gas levels has historically corresponded with more than 10°C or 18°F of warming, when looking at greenhouse gas levels and temperatures over the past 420,000 years, as illustrated by the image below.


Given that a 100 ppm rise in CO₂ did historically cause temperatures to rise by 10°C or 18°F, how much warming would be in line with a 157 ppm CO₂ and how fast could such a rise unfold?

A temperature of 10°C or 18° above 1750 seems in line with such high greenhouse gas levels. This is illustrated by above graph, based on 420,000 years of ice core data from Vostok, Antarctica, and as the post What Does Abrupt Climate Change Look Like? describes.


Why isn't it much warmer now? Why hasn't such a rise happened yet? Oceans and ice are still holding off such a rise, by absorbing huge amounts of warming. Of 1993-2003 warming, 95.5% was absorbed by oceans and ice. However, ocean stratification and ice loss are making the atmosphere take up more and more heat.

There are further warming elements, in addition to the accelerating rise in greenhouse gas levels. Mentioned above is the loss of the snow and ice cover. The domino effect is a popular way to demonstrate a chain reaction. It is typically sequential and typically uses dominoes that are equal in size. A chain reaction can be achieved with solid dominoes each as much as 1.5 times larger than the previous one. The exponential function is discussed in the video below by Guy McPherson. Rather than following a linear order, warming elements can be self-reinforcing feedback loops and can influence each other in ways that multiply (rather than pass on) their impact, which can speed up the temperature rise exponentially.

So, how fast and by how much could temperatures rise? As oceans and ice are taking up ever less heat, rapid warming of the lower troposphere could occur very soon. When including the joint impact of all warming elements, as described in a recent post, abrupt climate change could result in a rise of as much as 18°C or 32.4°F by 2026. This could cause most life on Earth (including humans) to go extinct within years.

Methane

Next to carbon dioxide, there are further greenhouse gases. Methane is important, because of its high short-term potency as a greenhouse gas and because methane levels in the atmosphere have hugely risen since 1750, and especially recently, as illustrated by the image on the right.

Carbon dioxide (CO₂), methane (CH₄) and nitrous oxide (N₂O) levels in the atmosphere in 2017 were, respectively, 257%, 146% and 122% their 1750 levels.

A recent study by Turetsky et al. concludes that, since sudden collapse releases more carbon per square metre because it disrupts stockpiles deep in frozen layers, and since abrupt thawing releases more methane than gradual thawing does, the impact of thawing permafrost on Earth’s climate could be twice that expected from current models.

As said, there also is a huge and growing danger of large abrupt methane releases from clathrates contained in sediments at the seafloor of the Arctic Ocean.

As illustrated by the image below, methane levels are rising and this rise is accelerating.


The graph shows July 1983 through December 2018 monthly global methane means at sea level, with added trend. Higher methane means can occur at higher altitude than at sea level. On Sep 3, 2018, daily methane means as high as 1905 ppb were recorded at 307 mb, an altitude at which some of the strongest growth in methane has occurred, as discussed in earlier posts such as this one.

The recent rise in methane is the more worrying in the light of recent research that calculates that methane's radiative forcing is about 25% higher than reported in IPCC AR5, implying that methane's GWP (global warming potential) over 10 years may be well over 150 times as much as CO₂.

Nitrous Oxide

Next to carbon dioxide and methane, there are further greenhouse gases, of which nitrous oxide is particularly important. Nitrous oxide is up to 300 times as potent as a greenhouse gas as carbon dioxide and has a lifetime of 121 years. Several recent studies point at the danger of huge releases of nitrous oxide from permafrost.

According to a 2017 study by Voigt et al., Arctic permafrost contains vast amounts of nitrogen (more than 67 billion tons). Warming of the Arctic permafrost is accelerating, causing rapid thaw of permafrost soils, and this now threatens to cause huge releases of nitrous oxide to the atmosphere. The study concluded that nitrous oxide emissions in the Arctic are likely substantial and underestimated, and show high potential to increase with permafrost thaw.

In the video below, Paul Beckwith discusses nitrous oxide.


In the video below, Paul Beckwith discusses the recent study by Wilkerson et al.


The study by Wilkerson et al. shows that nitrous oxide emissions from thawing Alaskan permafrost are about twelve times higher than previously assumed. A 2018 study by Yang et al. points at the danger of large nitrous oxide releases from thawing permafrost in Tibet. Even more nitrous oxide could be released from Antarctica. The danger is illustrated by the image below, which shows that massive amounts of nitrous oxide were recorded over Antarctica on April 29, 2019.


Depletion of the Ozone Layer

In addition to being a potent greenhouse gas, nitrous oxide is also an ozone depleting substance (ODS). As the left panel of the image below shows, growth in the levels of chlorofluorocarbons (CFCs) has slowed over the years, yet their impact will continue for a long time, given their long atmospheric lifetime (55 years for CFC-11 and 140 years for CFC-12). Since nitrous oxide levels continue to increase in the atmosphere, while the impact of CFC-11 and CFC-12 is slowly decreasing over time, the impact (as an ODS) of nitrous oxide has relatively grown, as the right panel of the image below shows.

[ from an earlier post ]
James Anderson, co-recipient of the 1995 Nobel Prize in chemistry for his work on ozone depletion, said in 2018 that "we have five years to save ourselves from climate change".

Comprehensive Action

In conclusion, while it's important to reduce emissions of all greenhouse gases, reducing emissions of methane and nitrous oxide is particularly important. To both reduce polluting emissions and to remove greenhouse gases from the atmosphere and oceans, the Climate Plan recommends feebates as depicted in the image below. As the image also mentions, further lines of action will be needed to avoid a rapid rise in temperature.

[ from an earlier post ]
Meanwhile, Arctic sea ice reached a new record low for April, as illustrated by the NSIDC image below.

In the video below, Guy McPherson describes what threatens to eventuate soon. This is an edit of the April 22, 2019, video in which Guy McPherson was interviewed by Peter B. Collins for the community television station in Marin County, California.


In the video below, Guy McPherson gives a presentation at the Center for Spiritual Living, in Chico, April 28, 2019.


The situation is dire and calls for comprehensive and effective action as described in the Climate Plan.


Links

• Climate Plan
https://arctic-news.blogspot.com/p/climateplan.html

• Permafrost collapse is accelerating carbon release, by Merritt Turetsky et al. (30 April 2019)
https://www.nature.com/articles/d41586-019-01313-4

• Permafrost nitrous oxide emissions observed on a landscape scale using the airborne eddy-covariance method, by Jordan Wilkerson et al. (April 3, 2019)
https://www.atmos-chem-phys.net/19/4257/2019/

• Can natural or anthropogenic explanations of late-Holocene CO2 and CH4 increases be falsified?, by William Ruddiman et al. (2011)
https://journals.sagepub.com/doi/10.1177/0959683610387172

• Radiative forcing of carbon dioxide, methane, and nitrous oxide: A significant revision of the methane radiative forcing, by Etminan et al. (2016)
https://agupubs.onlinelibrary.wiley.com/doi/full/10.1002/2016GL071930

• Magnitude and Pathways of Increased Nitrous Oxide Emissions from Uplands Following Permafrost Thaw, by Guibiao Yang et al. (July 9, 2018)
https://pubs.acs.org/doi/10.1021/acs.est.8b02271

• Increased nitrous oxide emissions from Arctic peatlands after permafrost thaw, by Carolina Voigt et al.
https://www.pnas.org/content/early/2017/05/23/1702902114

• We Have Five Years To Save Ourselves From Climate Change, Harvard Scientist Says - James Anderson (January 15, 2018)
https://www.forbes.com/sites/jeffmcmahon/2018/01/15/carbon-pollution-has-shoved-the-climate-backward-at-least-12-million-years-harvard-scientist-says/

• A rise of 18°C or 32.4°F by 2026?
https://arctic-news.blogspot.com/2019/02/a-rise-of-18c-or-324f-by-2026.html

• Care for the Ozone Layer
https://arctic-news.blogspot.com/2019/01/care-for-the-ozone-layer.html

• What Does Runaway Warming Look Like?
https://arctic-news.blogspot.com/2018/10/what-does-runaway-warming-look-like.html

• Rapid ice loss in early April leads to new record low - NSIDC
https://nsidc.org/arcticseaicenews/2019/05/rapid-ice-loss-in-early-april-leads-to-new-record-low/


Monday, April 8, 2019

Blue Ocean Event Consequences

A Blue Ocean Event looks set to occur in the Arctic when there will be virtually no sea ice left. At first, the duration of this event will be a few weeks in September, but as more heat accumulates in the Arctic, the event will last longer each year thereafter.

Indeed, a Blue Ocean Event will come with accumulation of more heat, due to loss of latent heat, as a dark (blue) ocean absorbs more sunlight than the reflective ice, etc. Consequences will extend far beyond the Arctic, as shown on the image below that features Dave Borlace's Blue Ocean Top Ten Consequences.


Dave Borlace goes into more detail regarding these consequences in the video Blue Ocean Event : Game Over?


A Blue Ocean Event could happen as early as September 2019. The image below shows that Arctic sea ice extent on April 7, 2019, was 12.97 million km², a record low for measurements at ads.nipr.ac.jp for the time of year. By comparison, on May 28, 1985, extent was larger (13.05 million km²) while it was 51 days later in the year.


In the video below, Paul Beckwith also discusses the rapid decline of the sea ice and the consequences.


Clearly, the rapid decline of the sea ice has grave consequences. When also looking beyond what's happening in the Arctic, there are further events, tipping points and feedbacks that make things worse. An earlier post contains the following rapid warming scenario:
  1. a stronger-than-expected El Niño would contribute to
  2. early demise of the Arctic sea ice, i.e. latent heat tipping point +
  3. associated loss of sea ice albedo, 
  4. destabilization of seafloor methane hydrates, causing eruption of vast amounts of methane that further speed up Arctic warming and cause
  5. terrestrial permafrost to melt as well, resulting in even more emissions,
  6. while the Jet Stream gets even more deformed, resulting in more extreme weather events
  7. causing forest fires, at first in Siberia and Canada and
  8. eventually also in the peat fields and tropical rain forests of the Amazon, in Africa and South-east Asia, resulting in
  9. rapid melting on the Himalayas, temporarily causing huge flooding,
  10. followed by drought, famine, heat waves and mass starvation, and
  11. collapse of the Greenland Ice Sheet.


Importantly, depicted above is only one scenario out of many. Things may eventuate in different order and occur simultaneously, i.e. instead of one domino tipping over the next one sequentially, many events reinforcing each other. Further points should be added to the list, such as falling away of sulfate cooling due to economic changes, ocean stratification and stronger storms that can push large amounts of warm salty water into the Arctic Ocean.

Global sea ice extent is also at a record low for the time of year. Global sea ice extent on April 8, 2019, was 17.9 million km². On April 8, 1982, global sea ice extent was 22.32 million km², i.e. a difference of 4.42 million km². That constitutes a huge albedo loss.


As discussed in an earlier post, this all adds up to further global warming that may eventuate very rapidly. The image below shows how a total rise of 18°C or 32.4°F from preindustrial could eventuate by 2026.


The situation is dire and calls for comprehensive and effective action, as described in the Climate Plan.


Links

• Blue Ocean Event : Game Over? - by Dave Borlace
https://www.youtube.com/watch?v=qo3cznpfIpA

• Climate System Upheaval: Arctic Sea-Ice, Snow Cover, Jet-Stream, Monsoonal Consequences - by Paul Beckwith
https://www.youtube.com/watch?v=ZtpF--rqZZ8

• Jet Stream Center-of-Rotation to Shift 17 degrees Southward from North Pole to Greenland with Arctic Blue Ocean Event - by Paul Beckwith
https://www.youtube.com/watch?v=bFme3C9e-cs

• Blue Ocean Event
https://arctic-news.blogspot.com/2018/09/blue-ocean-event.html

• Stronger Extinction Alert
https://arctic-news.blogspot.com/2019/03/stronger-extinction-alert.html

• It could be unbearably hot in many places within a few years time
https://arctic-news.blogspot.com/2016/07/it-could-be-unbearably-hot-in-many-places-within-a-few-years-time.html

• Feedbacks
https://arctic-news.blogspot.com/p/feedbacks.html

• Latent Heat
https://arctic-news.blogspot.com/p/latent-heat.html

• Albedo and more
https://arctic-news.blogspot.com/p/albedo.html

• Warning of mass extinction of species, including humans, within one decade
https://arctic-news.blogspot.com/2017/02/warning-of-mass-extinction-of-species-including-humans-within-one-decade.html

• How much warming have humans caused?
https://arctic-news.blogspot.com/2016/05/how-much-warming-have-humans-caused.html

• The Threat
https://arctic-news.blogspot.com/p/threat.html

• A rise of 18°C or 32.4°F by 2026?
https://arctic-news.blogspot.com/2019/02/a-rise-of-18c-or-324f-by-2026.html

• Extinction
https://arctic-news.blogspot.com/p/extinction.html

• Climate Plan
https://arctic-news.blogspot.com/p/climateplan.html


Sunday, March 31, 2019

Arctic Warming Up Fast

On March 30, 2019, Arctic sea ice extent was 13.42 million km², a record low for the measurements at ads.nipr.ac.jp for the time of year.


[ click on images to enlarge ]
As the Arctic warms up faster than the rest of the world, the temperature difference between the North Pole and the Equator narrows, making the jet stream wavier, thus enabling warm air over the Pacific Arctic to move more easily into the Arctic.

The image on the right shows that, on March 31, 2019, the Arctic was 7.5°C or 13.5°F warmer than 1979-2000.

The earlier forecast below shows a temperature anomaly for the Arctic of 7.6°C or 13.68°F for March 31, 2019, 12:00 UTC and in places 30°C or 54°F warmer. The inset shows the Jet Stream moving higher over the Bering Strait, enabling air that has been strongly warmed up over the Pacific Ocean to move into the Arctic.


A wavier Jet Stream also enables cold air to more easily move out of the Arctic. The inset shows the Jet Stream dipping down over North America where temperatures lower than were usual were recorded.

The later forecast below shows a temperature anomaly for the Arctic of 7.7°C or 13.86°F for March 31, 2019, 12:00 UTC.


The image below shows that El Niño can be expected to push temperatures up higher in 2019 during the Arctic sea ice retreat.

A warmer sea surface can cause winds to grow dramatically stronger, and they can push warm, moist air into the Arctic, while they can also speed up sea currents that carry warm, salty water into the Arctic Ocean.

Rivers can also carry huge amounts of warm water from North America and Siberia into the Arctic Ocean, as these areas are getting hit by ever stronger heatwaves that are hitting the Arctic earlier in the year.

With Arctic sea ice at a low, it won't be able to act as a buffer to absorb heat for long, with the danger that an influx of warm, salty water will reach the seafloor and trigger methane eruptions.

As warmer water keeps flowing into the Arctic Ocean and as air temperatures in the Arctic are now starting to rise on the back of a strengthening El Niño, fears for a Blue Ocean Event in 2019 are rising, which would further accelerate the temperature rise as less sunlight gets reflected back into space.

The situation is dire and calls for comprehensive and effective action, as described at the Climate Plan.

Links

• Arctic sea ice extent
https://ads.nipr.ac.jp/vishop/#/extent

• Climate Reanalyzer
https://climatereanalyzer.org

• ENSO Update by Climate Prediction Center / NCEP 25 March 2019
https://www.cpc.ncep.noaa.gov/products/analysis_monitoring/lanina/enso_evolution-status-fcsts-web.pdf

• Blue Ocean Event
https://arctic-news.blogspot.com/2018/09/blue-ocean-event.html

• Climate Plan
https://arctic-news.blogspot.com/p/climateplan.html


Friday, January 25, 2019

Accelerating growth of carbon dioxide in the atmosphere

People may not have thought that growth in carbon dioxide (CO₂) levels in the atmosphere would accelerate, when pledges were made in 2015 at the Paris Agreement to take efforts to keep the temperature rise under 1.5°C compared to preindustrial.


Yet, on January 21, 2019, hourly average CO₂ levels well above 414 ppm were recorded at Mauna Loa, Hawaii, the highest levels since such measurements started. A daily average level of 413.86 ppm was recorded on January 22, 2019.


A recent Met Office forecast expects monthly averages to reach a level of 414.7 ppm in May 2019. The forecast expects annual average CO₂ levels at Mauna Loa to be 2.75 ppm higher in 2019 than in 2018. That figure is virtually on the trendline depicted below.


The trend in above image is calculated with NOAA 1959-2017 growth data, with an estimate for 2018 calculated by Sam Carana with NOAA January 2017-November 2018 data (orange dot), and with this Met Office forecast used for 2019 (purple dot).

Strong CO₂ growth is forecast for 2019, due to a number of factors including rising emissions, the added impact of El Niño and less uptake of carbon dioxide by ecosystems. A recent study warns that global warming will enhance both the amplitude and the frequency of eastern Pacific El Niño events and associated extreme weather events. Another recent study warns that, while the terrestrial biosphere now absorbs some 25% of CO₂ emissions by people, the rate of land carbon uptake is likely to fall with reduced soil moisture levels in a warmer world. Furthermore, forest fires will increase as temperatures rise, as soils get more dry and as winds increase in strength, resulting in further increases of CO₂ emissions.

The warming impact of CO₂ can be expected to increase over the next ten years, the more so since the warming impact of CO₂ reaches a peak ten years after emission. In conclusion, CO₂ can cause a global temperature rise of 0.5°C over the next ten years.

Ocean Heat

La Niña has kept much heat in oceans in 2018. Not surprisingly, 2018 was the hottest year for our oceans since global records began in 1958.

As an indication how much heat is contained in the North Atlantic, very high sea surface temperatures did show up recently off the coast of North America, with anomalies on January 23, 2019, as high as 12.6°C or 22.6°F (compared to 1981-2011, green circle on the image on the right).

That day, sea surface temperatures near Svalbard were as high as 18.3°C or 64.9° (green circle, image right). The Gulf Stream carries ocean heat to the Arctic Ocean and it can take a couple of months for this heat to reach the Arctic Ocean and contribute to melting of the sea ice.

So, Arctic sea ice is expected to be invaded by ocean heat from below in 2019, while El Niño will cause high temperatures over the Arctic, melting the sea ice from above.

Furthermore, rivers that end in North America and Siberia can be expected to carry much warm water into the Arctic Ocean.

The image below shows surface air temperature forecasts for February 1, 2019, 15:00 UTC. Low temperatures show up many place on the Northern Hemisphere, such as -44.5°C or -48.2°F in Siberia, -44°C or -47.1°F in Greenland and -40.8°C or -41.4°F near Hudson Bay.


[ NOAA Climate.gov cartoon by Emily Greenhalgh ]
These low temperatures are the result of global warming. As the Arctic warms up faster than the rest of the world, the temperature difference between the North Pole and the Equator narrows, making the jet stream wavier, thus enabling cold air from the Arctic to descend further south.

As the jet stream gets wavier, more warm air can also enter the Arctic from the south. Above image also shows that surface air temperatures near Svalbard are forecast as high as 5.2°C or 41.4°F, illustrating how warm the air can be close to the North Pole, at a time of year when virtually no sunlight reaches that area.

Furthermore, as oceans get warmer, the temperature difference between land and oceans increases in Winter. This larger temperature difference results in stronger winds that can carry more warm and moist air inland, e.g. into the U.S., as illustrated by the cartoon. Stronger winds can also carry more warm and moist air into the Arctic and can speed up the flow of sea currents, causing warm and salty water to reach the sea ice and speed up its decline.

The sea surface is warming up strongly in this area near Svalbard, as the water underneath the surface of the North Atlantic can be much warmer than the water at the surface, and warm water is coming to the surface in line with a rise in the seafloor in this area, as discussed in earlier posts such as this one and this one.

Methane hydrates

With sea ice at a low, it won't be able to act as a buffer to absorb heat for long. One danger is that, as more heat arrives in the Arctic and as the sea ice melts away, the sea ice will no longer be able to act as a buffer absorbing ocean heat any longer, and ocean heat will instead reach sediments at the seafloor of the Arctic Ocean.

[ The Buffer has gone, feedback #14 on the Feedbacks page ]
Joint impact

[ For details, see the Extinction page ]
The joint impact of all this is terrifying. Ocean heat that reaches sediments at the seafloor of the Arctic Ocean can destabilize hydrates, resulting in eruptions of huge amounts of methane. This alone can cause a global temperature rise of 1.1°C in a matter of years.

A lot of this has not been accounted for by the IPCC, i.e. the recent increases in CO₂ emissions, increases in methane releases, increases in further emissions such as nitrous oxide and black carbon, albedo changes due to decline in the snow and ice cover and associated changes such as jet stream changes, more permafrost melting and stronger impacts of future El Niño events.

The image on the right shows the joint impact of the warming elements that threaten to eventuate over the next few years and that could result in a rapid 10°C or 18°F global temperature rise by 2026 or even earlier. Keep in mind that global biodiversity will have collapsed once temperatures have risen by 5°C.

The situation is dire and calls for comprehensive and effective action, as described at the Climate Plan.


Links

• Faster CO₂ rise expected in 2019
https://www.metoffice.gov.uk/news/releases/2019/2019-carbondioxide-forecast

• Increased variability of eastern Pacific El Niño under greenhouse warming, by Wenju Cai et al.
https://www.nature.com/articles/s41586-018-0776-9

• El Niño events will intensify under global warming, by Yoo-Geun Ham
https://www.nature.com/articles/d41586-018-07638-w

• Large influence of soil moisture on long-term terrestrial carbon uptake, by Julia Green et al.
https://www.nature.com/articles/s41586-018-0848-x

• 2018 Continues Record Global Ocean Warming, by Lijing Cheng et al.
https://link.springer.com/article/10.1007/s00376-019-8276-x

• Are record snowstorms proof that global warming isn’t happening?
https://www.climate.gov/news-features/climate-qa/are-record-snowstorms-proof-global-warming-isn%E2%80%99t-happening

• Co-extinctions annihilate planetary life during extreme environmental change, by Giovanni Strona and Corey Bradshaw
https://www.nature.com/articles/s41598-018-35068-1

• Dangerous situation in Arctic
https://arctic-news.blogspot.com/2018/11/dangerous-situation-in-arctic.html

• Accelerating Warming of the Arctic Ocean
https://arctic-news.blogspot.com/2016/12/accelerating-warming-of-the-arctic-ocean.html

• Climate Plan
https://arctic-news.blogspot.com/p/climateplan.html

• Extinction
https://arctic-news.blogspot.com/p/extinction.html


Saturday, December 8, 2018

Carbon dioxide emissions are rising

CO₂ emissions are rising

In models used by the Intergovernmental Panel on Climate Change (IPCC), carbon dioxide (CO₂) emissions were expected to come down in line with pledges made at the Paris Agreement. Yet, the Global Carbon Project projects growth in CO₂ emissions from fossil fuels and industry in 2018 to be +2.7%, within uncertainty margins from +1.8% to +3.7%.


This rise is in line with an image from an earlier post that shows growth of CO₂ in the atmosphere to be accelerating.
[ Growth of CO₂ in ppm, based on annual Mauna Loa data (1959-2017), with 4th-order polynomial trend added ]

Methane emissions rising as well

And it's not just CO₂ emissions that are rising. Methane emissions are rising as well. Sadly, politicians typically ignore this elephant in the room, in particular seafloor methane emissions that threaten to trigger a huge temperature rise within years.

[ ignoring the elephant in the room, i.e. seafloor methane ]
The MetOp image below shows high methane levels over oceans on December 9, 2018, pm, at 469 mb. Levels over the Arctic Ocean in particular are very high, as the large areas solidly colored magenta indicate.


The MetOp image shows many areas where no data were available, as indicated by the color grey. The NPP images don't have as many grey areas. The image below confirms very high methane levels over the Arctic Ocean on December 9, 2018 pm, closer to the surface, i.e. at 840 mb. While there still are many grey areas, the absence of data for many of them is due to altitude, since large parts of Greenland, Antarctica and the Himalayas are rather high.


As discussed in earlier posts, large amounts of methane appear to be rising from the Arctic Ocean. As the methane rises higher in the atmosphere, it moves closer to the Equator. The NPP image below shows levels at 399 mb on December 9, 2018, pm. At this altitude, there are very few grey areas, so it's possible to get a fuller picture of where the highest levels of methane are. Ominously, levels as high as 3060 ppb were reached.


El Niño events will intensify

The image on the right shows that, on December 30, 2018, sea surface temperature anomalies were as high as 9.7°C or 17.4°F in the Pacific Ocean, 11.1°C or 20°F in the Atlantic Ocean and 17.1°C or 30.8°F near Svalbard in the Arctic Ocean.

NOAA expects El Niño to form and continue through the Northern Hemisphere winter 2018-19 (~90% chance). A recent study concludes that global warming will enhance both the amplitude and the frequency of eastern Pacific El Niño events.

Albedo change

Albedo change due to decline of the snow and ice cover is another feedback that the IPCC has yet to come to grips with. The IPCC seems to have hoped that albedo loss in the Arctic was somehow compensated for by albedo gain in the Antarctic.

The IPCC (in AR5, WG1) did find a significant increase in Antarctic annual mean sea ice extent that is very likely in the range of 1.2 to 1.8 % per decade between 1979 and 2012 (0.13 to 0.20 million km² per decade) (very high confidence).

As the image below shows, global sea ice extent steadily came down, but then grew somewhat until end 2014. From end 2014 on, Antarctic sea ice extent fell rapidly, with huge repercussions for global sea ice extent, as also illustrated by the image on the right that highlights the most recent years of the graph below.

At the end of 2016, Antarctic sea ice extent was a lot smaller than it was at the end of 2014. Such a difference in sea ice extent corresponds with a huge difference in radiative forcing (RF).

Antarctic sea ice extent was 4.913 million km² on January 5, 2019, a record low for the time of year and 4.212 million km² less than it was on January 5, 2015, when extent was 9.125 million km².

This decline could make a difference of 1.3 W/m² in RF. By comparison, the IPCC estimated the net RF from all emissions by people from 1750 to 2011 at 1.6 W/m².

As the image below shows, global sea ice extent was at a record low for the time of year on Dec. 28, 2018, and looks set to go lower in 2019.

Antarctic sea ice decline is only part of the picture, there's also Arctic sea ice decline and there's decline of the snow and ice cover on land.

Joint impact

A lot of this has not been accounted for by the IPCC, i.e. the recent increases in CO₂ emissions, increases in methane releases, increases in further emissions such as nitrous oxide and black carbon, albedo changes due to decline in the snow and ice cover and associated changes such as jet stream changes, more permafrost melting and stronger impacts of future El Niño events.

The image on the right shows the joint impact of the warming elements that threaten to eventuate over the next few years and that could result in a 10°C or 18°F global temperature rise in a matter of years.

The situation is dire and calls for comprehensive and effective action, as described at the Climate Plan.

Links

• Global Carbon Project
http://www.globalcarbonproject.org

• Looking the climate abyss in the eye!
https://arctic-news.blogspot.com/2018/09/looking-the-climate-abyss-in-the-eye.html

• How much warmer is it now?
https://arctic-news.blogspot.com/2018/04/how-much-warmer-is-it-now.html

• Feedbacks
https://arctic-news.blogspot.com/p/feedbacks.html

• How much warming have humans caused?
https://arctic-news.blogspot.com/2016/05/how-much-warming-have-humans-caused.html

• Albedo change in the Arctic
http://arctic-news.blogspot.com/2012/07/albedo-change-in-arctic.html

• IPCC AR5 WG1 chapter 4
https://www.ipcc.ch/site/assets/uploads/2018/02/WG1AR5_Chapter04_FINAL.pdf

• The Threat
https://arctic-news.blogspot.com/p/threat.html

• Extinction
https://arctic-news.blogspot.com/p/extinction.html

• Climate Plan
https://arctic-news.blogspot.com/p/climateplan.html

• NOAA El Niño forecast
https://www.cpc.ncep.noaa.gov/products/analysis_monitoring/lanina/enso_evolution-status-fcsts-web.pdf
https://www.cpc.ncep.noaa.gov/products/analysis_monitoring/enso_advisory/ensodisc.shtml

• El Niño events to become stronger and more intense
https://www.theage.com.au/environment/climate-change/el-nino-events-to-become-stronger-and-more-intense-study-finds-20181212-p50lrv.html
https://www.nature.com/articles/s41586-018-0776-9