Showing posts with label ocean. Show all posts

Monday, June 20, 2022

Arctic sea ice June 2022 - why the situation is so dangerous

Sea Ice Extent


Arctic sea ice extent has fallen strongly in June 2022. On June 22, 2022, Arctic sea ice extent was among the lowest on record for the time of year, as illustrated by the above image, adapted from the National Snow and Ice Data Center (NSIDC Chartic). 

The image below, from an animation by Zachary Labe, shows Arctic sea ice extent up to June 20, 2022, based on Vishop data. The yellow line is the year 2022. The white line shows extent for the year 2012, when it reached a record minimum in September. The blue line shows extent the year 2020, when the minimum in September was second lowest.
 

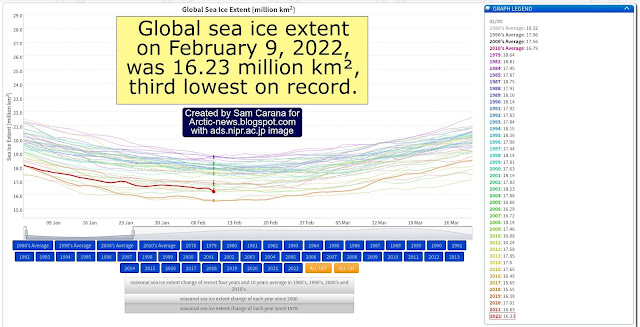
The image below, adapted from Vishop, shows that on June 23, 2022, global sea ice extent was at a record low for the time of year.


La Niña

[ adapted from NOAA - click on images to enlarge ]
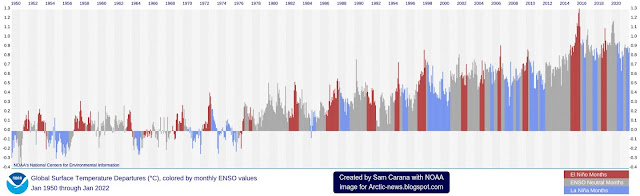
The fact that sea ice is so low for the time of the year is the more striking as we are currently in the depths of a persistent La Niña, which suppresses the temperature rise.

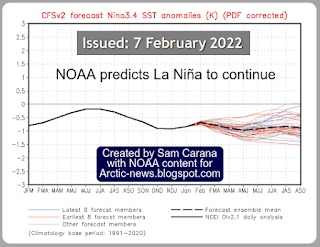
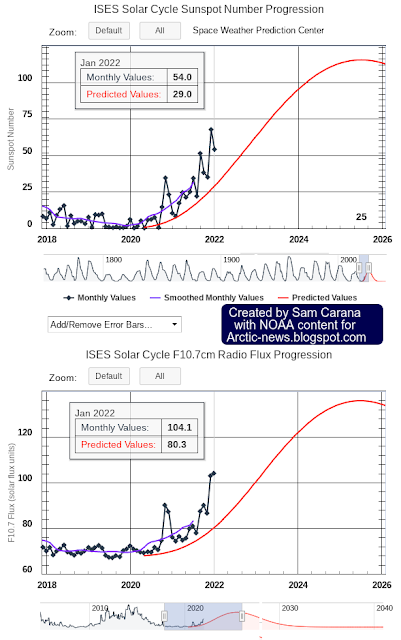
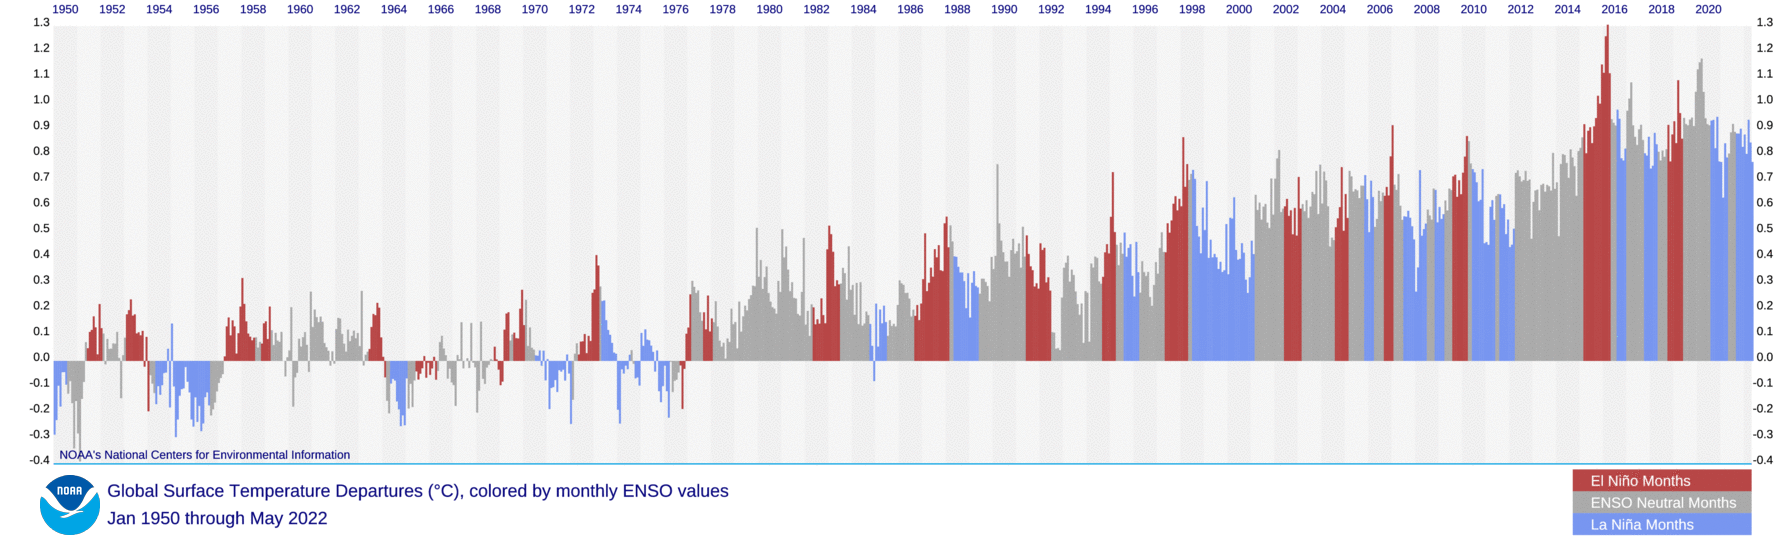
El Niños typically occur every 3 to 5 years, according to NOAA and as also illustrated by the NOAA image below, so the upcoming El Niño can be expected to occur soon.

The NOAA image below indicates that going from the bottom of a La Niña to the peak of an El Niño could make a difference of more than half a degree Celsius (0.5°C or 0.9°F).


Furthermore, the rise in sunspots from May 2020 to July 2025 could make a difference of some 0.15°C (0.27°F). The next El Niño looks set to line up with a high peak in sunspots, in a cataclysmic alignment that could push up the temperature enough to cause dramatic sea ice loss in the Arctic, resulting in runaway temperature rise by 2026.

Multi-year Sea Ice

The NSIDC compilation below illustrates how much multi-year sea ice has already declined over the years. The top panel shows the age of Arctic sea ice for the March 12 to 18 period in (a) 1985 and (b) 2022. The oldest ice, greater than 4 years old, is in red. Plot (c) shows the timeseries from 1985 through 2022 of percent cover of the Arctic Ocean domain (inset, purple region) by different sea ice ages during the March 12 to 18 period.


Sea Ice Volume

On June 18, 2022, Arctic sea ice volume was among the lowest on record for the time of year, as illustrated by the image below, adapted from Polarportal.


A Blue Ocean Event occurs when virtually all sea ice disappears and the surface color changes from white (sea ice) to blue (ocean). According to many, a Blue Ocean Event starts once Arctic sea ice extent falls below 1 million km².

The image on the right shows a trend pointing at zero Arctic sea ice volume by September 2027.

Note that the volume data in the image are averages for the month September ⁠— the minimum for each year is even lower. Furthermore, since zero volume implies zero extent, this indicates that a Blue Ocean Event (extent below 1 million km²) could happen well before 2027.

Sea Ice Thickness

The Naval Research Laboratory one-month animation below shows Arctic sea ice thickness up to June 18, 2022, with 8 days of forecasts added.


The above animation shows a dramatic fall in sea ice thickness over a large area, while sea ice is disappearing altogether in some places. This fall in thickness is mostly due to warm water from the Atlantic Ocean that is melting the sea ice hanging underneath the surface. This is where the sea ice constitutes the latent heat buffer, consuming incoming heat in the process of melting.

The University of Bremen combination image below shows the difference in sea ice thickness between June 1 and June 30, 2022. The image on the right shows a large areas where sea ice is less than 20 cm thick.


The NASA Worldview image below shows the situation on June 24, 2022. Plenty of water is showing up as close as 200 km to the North Pole.


Also view the NASA Worldview animation comparing sea ice at June 24 and 25, 2022 at facebook

Ocean Heat and decline of the Latent Heat Buffer


Ocean heat keeps rising; in 2021, despite La Niña conditions, ocean heat reached yet another record high, as illustrated by the above image, from an earlier post.

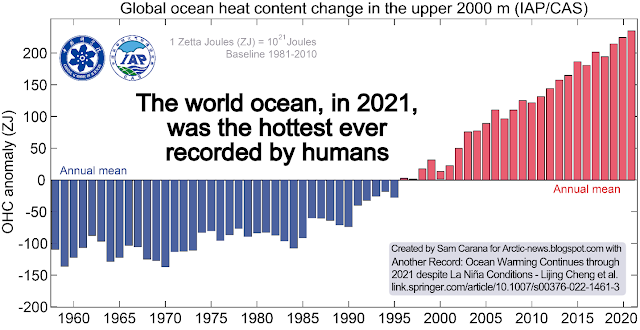
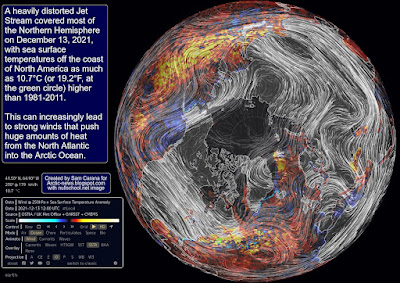
A 2019 analysis concludes that the latent heat tipping point gets crossed when the sea surface temperature anomaly on the Northern Hemisphere gets higher than 1°C above 20th century's temperature and when there is little or no thick sea ice left. As the image below indicates, the temperature anomaly of 1°C above the 20th century average looks set to be crossed in the course of the year 2021.


Close to the coast of Siberia, where much of the sea ice has disappeared altogether, the decline is due for a large part to warm water from rivers flowing into the Arctic Ocean. 


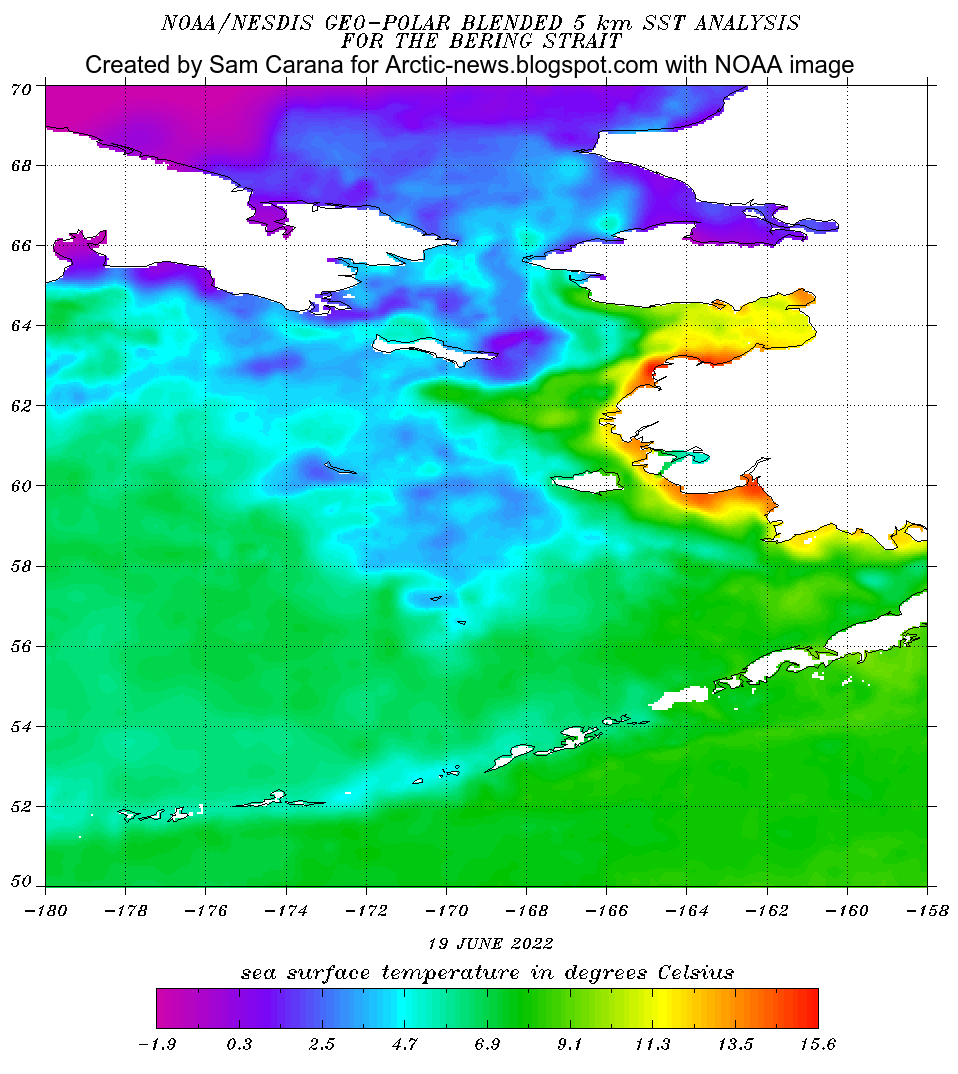
Sea ice has also disappeared altogether in the Bering Strait, for a great part due to warm water from rivers in Alaska, especially the Yukon River, the Kuskokwim River and the Copper River, as illustrated by the above NOAA image, which shows sea surface temperatures as high as 15.6°C or 60.08°F.


On June 10, 2022, the sea surface temperature anomaly from 1981-2011 in the Bering Strait was as high as 15.5°C or 27.9°F (at green circle), illustrated by the above nullschool.net image. In 1981-2011, the Bering Strait was still largely frozen at this time of year.

The NOAA image below illustrates how the Gulf Stream is pushing warm water toward the Arctic, with sea surface temperatures in the North Atlantic reaching as high as 32.1°C or 89.78°F on June 19, 2022. 


Latent heat is heat that is (less and less) going into melting the sea ice. The reason this heat is called latent (hidden) heat, is that it doesn't raise the temperature of the water, but instead gets consumed in the process of melting the ice. Latent heat is energy associated with a phase change, such as the energy consumed when solid ice turns into water (i.e. melting). During a phase change, the temperature remains constant. Sea ice acts as a buffer that absorbs heat, while keeping the temperature at zero degrees Celsius. As long as there is sea ice in the water, this sea ice will keep absorbing heat, so the temperature doesn't rise at the sea surface. The amount of energy absorbed by melting ice is as much as it takes to heat an equivalent mass of water from zero to 80°C.


The combination image below illustrates how much ocean heat is entering the Arctic Ocean from the Atlantic Ocean, heating up the sea ice from below.

The left panel shows the depth of the Arctic Ocean, with darker blue indicating greater depth.

In the right panel, the light blue, green and yellow colors indicate the thickest ice, located in the shallow waters off the coasts of North America and Greenland. The darker blue colors indicate where much of the sea ice has melted away, from below, as also illustrated by the one-month animation below showing sea ice thickness up to June 22, 2022, with an added 8 days of forecasts. The white color indicates where the sea ice has melted away entirely, e.g. in the Bering Strait and north of Siberia, mainly due to warm water from rivers entering the Arctic Ocean.


Once most of the sea ice that was hanging underneath the surface is gone, further heat will still keep moving underneath the sea ice from the Atlantic Ocean and - to a lesser extent - from the Atlantic Ocean into the Arctic Ocean. Without the latent heat buffer, this heat must go elsewhere, i.e. it will typically raise the temperature of the water. The atmosphere will also warm up faster. More evaporation will occur once the sea ice is gone, further warming up the atmosphere.

As the Latent Heat Tipping Point gets crossed, there may still be a thin layer of ice at the surface, at least as long as air temperatures are low enough to keep it frozen and as long as strong winds haven't pushed the sea ice out of the Arctic Ocean. This thin layer of ice will still consume some ocean heat below the surface, but at the same time it acts as a seal, preventing heat from the Arctic Ocean to enter the atmosphere. Even if a lot of sea ice remains, the situation is dangerous, if not even more dangerous. The continuing La Niña could cause a lot of thin sea ice to remain at the surface of the Arctic Ocean this year. The more sea ice remains, the less ocean heat can be transferred from the Arctic Ocean to the atmosphere over the Arctic Ocean, which means that more heat remains in the Arctic Ocean.

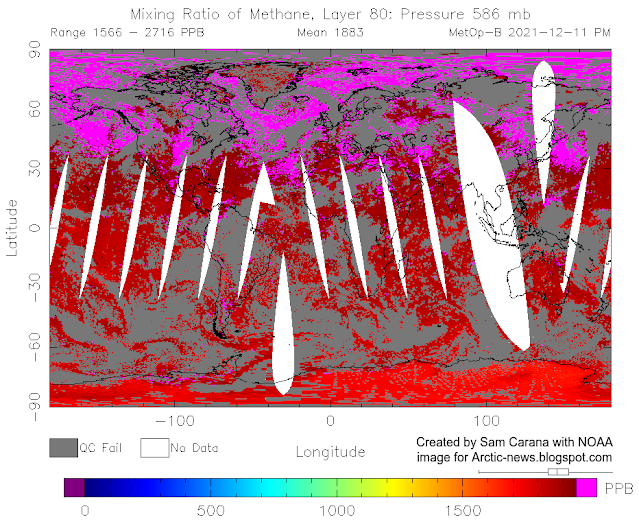
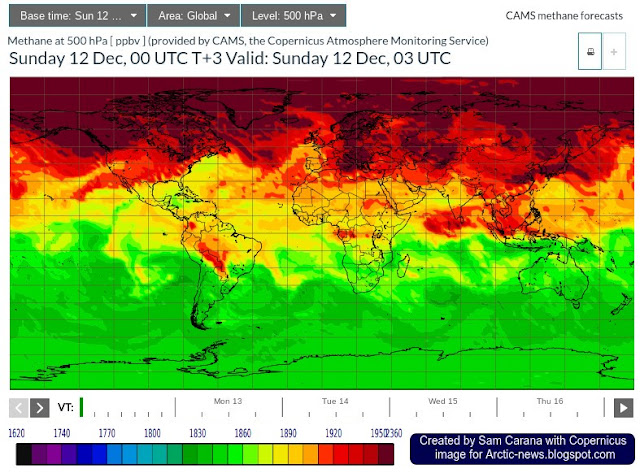
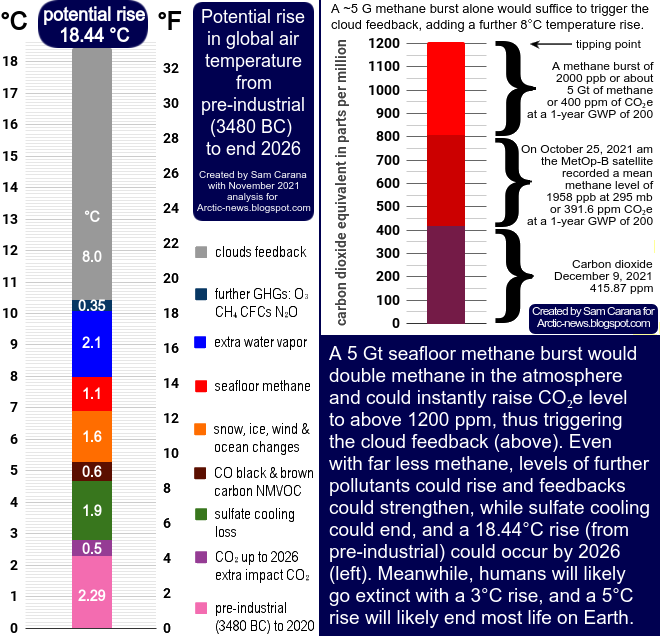
One huge danger is that, as the buffer disappears that until now has consumed huge amounts of ocean heat, more heat will reach methane hydrates at the seafloor of the Arctic Ocean, causing them to get destabilized and resulting in releases of methane from these hydrates and from free gas underneath that was previously sealed by the hydrates.

As the latent heat buffer of the sea ice underneath the surface disappears, more of this heat could then reach sediments at the seafloor of the Arctic Ocean, threatening eruptions to occur of seafloor methane (from hydrates and from free gas underneath the hydrates). The methane could similarly push up temperatures dramatically over the Arctic, and globally over the next few years. 

[ feedback #14: Latent Heat ]

The above 2014 image, from the feedbacks page, shows three of the numerous feedbacks that are accelerating warming in the Arctic. Feedback #1 is the albedo feedback. Feedback #14 refers to the loss of the Latent Heat Buffer and warming of the Arctic Ocean. Feedback #2 refers to methane releases. 

Heatwaves look set to continue on the Northern Hemisphere, extending heat over the Arctic Ocean and thus affecting Arctic sea ice from above, while warm water from rivers will cause more melting at the surface, and while rising ocean heat will continue to cause more melting of the ice underneath the surface. If this continues, we can expect a new record low for sea ice in September 2022 and the joint loss of the latent heat buffer and the loss of albedo could push up temperatures dramatically over the Arctic, while the additional methane could similarly push up temperatures dramatically over the Arctic, and globally over the next few years. 

[ The Buffer has gone, feedback #14 on the Feedbacks page ]

Conclusion

In conclusion, temperatures could rise strongly in the Arctic soon, due to sea ice loss in combination with an upcoming El Niño and a peak in sunspots, with the potential to drive humans extinct as early as in 2025, while temperatures would continue to skyrocket in 2026, making it in many respects rather futile to speculate about what will happen beyond 2026. At the same time, the right thing to do now is to help avoid the worst things from happening, through comprehensive and effective action as described in the Climate Plan.

• Blue Ocean Event 

• Polarportal

• Naval Research Laboratory

• University of Bremen

• NASA Worldview satellite

• NOAA - sea surface temperature
https://www.ospo.noaa.gov/Products/ocean/sst/contour/index.html

• nullschool
https://earth.nullschool.net

• Albedo, latent heat, insolation and more

• Latent Heat Buffer

• Feedbacks in the Arctic

• Extinction
https://arctic-news.blogspot.com/p/extinction.html

• Climate Plan
https://arctic-news.blogspot.com/p/climateplan.html


Wednesday, February 9, 2022

Accelerating loss of global snow and ice cover


Ocean heat is at record levels. As a result, global sea ice extent was only 16.23 million km² on February 9, 2022, the third lowest extent on record. What makes this even more worrying is that we're currently in the depth of a persistent La Niña.


Antarctic sea ice at lowest extent on record since start satellite measurements

Ocean heat is a huge threat for Antarctica at the moment. The image below shows that Antarctic sea ice extent was only 2.091 million km² on February 16, 2022, the lowest on record since the start of satellite measurements.


Ocean heat is reducing the sea ice around Antarctica and is getting underneath floating sea ice. 

The Thwaites Glacier, which is on a retrograde slope, is especially vulnerable to collapse. 

The Thwaites Glacier contains enough ice to raise global sea levels by 65 cm (25.59 inches) if it were to completely collapse.

The animation on the right, created with images from Climate Reanalyzer, shows the retreat of the Antarctic snow and ice cover from January 5 to February 18, 2021. 

The animation underneath, by navy.mil, shows sea ice thickness over 30 days up to February 17, 2022 (with 8 days of forecasts added).

Another danger of a rapid loss of the snow and ice cover on Antarctica is release of methane. Jemma Wadham warned about this in a 2012 study, as discussed at the post methane hydrates. More recently, Jemma Wadham said: “We are sleepwalking into a catastrophe for humanity.

The Thwaites Glacier is often called the Doomsday Glacier because if it collapses it would lead to vast sea level rise, and scientists believe it is likely to fail within a few years, says Cliff Seruntine (the Naturalist) in the video below. 


A recent study concludes that mountain glaciers may hold less ice than previously thought. Their disappearance means less water for drinking and agriculture, and faster temperature rises due to albedo loss. While the study found that the Himalayas contain more water than thought, another recent study, Mt. Everest’s highest glacier is a sentinel for accelerating ice loss, describes how human-induced climate change has a huge impact on the highest reaches of the planet.

The outlook for the Arctic is most threatening, as the post methane hydrates also concluded back in 2013, as described in numerous post here at Arctic-news and as discussed in the video below by Jim Massa.


A huge temperature rise threatens to unfold soon


Above image indicates that the difference between the top of El Niño and the bottom of La Niña could be more than half a degree Celsius.

As said, we're currently in the depth of a persistent La Niña, which suppresses temperatures. As the temperature keeps rising, ever more frequent strong El Niño events are likely to occur, as discussed in an earlier post

A 2019 study analyzes how tipping the ENSO into a permanent El Niño can trigger state transitions in global terrestrial ecosystems.

Currently, the temperature rise is additionally suppressed by low sunspots. Within a few years time, sunspots can be expected to reach the peak of their current cycle and observed sunspots are looking stronger than predicted. 

In the image below on the right, adapted from NOAA, the solar cycle is represented as the number of sunspots (top) and F10.7cm radio flux (bottom). 

In a recent communication, James Hansen repeats that, as reductions take place in the sulfate aerosols that are currently co-emitted by traffic, transport and industry, this is causing the current temperature rise to accelerate and could cause further rapid global warming, referred to in a 2021 presentation as a termination shock.

Furthermore, in addition to a huge temperature rise resulting from sulfate aerosols falling away, there could be a further rise in temperature as a result of releases of other aerosols with a net warming impact, such as black and brown carbon, which can increase dramatically as more wood burning and forest fires take place.

In summary, while the temperatures are accelerating, we'll soon be moving into the next El Niño, with sunspots moving toward a peak, with sulfate aerosols causing a termination shock and with other aerosols further driving up the temperature rise. 

Stop the deception!

In a giant scheme of deception, the temperature rise is all too often presented with images of people playing on the beach on a 'warm' day, as if 'global warming' was making life more 'comfortable'. 

Forest fires are called 'wildfires', biomass burning and associated deforestation is referred to as 'renewable biofuel', fracking-induced earthquakes are called 'natural' disasters and methane eruptions are called seeps and bubbles of 'natural' gas from 'natural' sources such as wetlands. 

This gives the false impression that this was somehow 'natural' as if human activities had nothing to do with it, and as if owning beach-front property was becoming ever more attractive.


Let's stop this deception! In reality, human-caused emissions have a huge short-term impact on temperature and their combination with genuinely natural variability such as El Niño and sunspots can act as a catalyst, causing numerous feedbacks to kick in with ever greater ferocity. 

This can result in collapse of global sea ice and permafrost, resulting in albedo loss and eruption of huge quantities of carbon dioxide, methane and nitrous oxide, further driving up the temperature rise abruptly, as described at the extinction page. Further feedbacks are also described at the feedbacks page

Conclusion

The situation is dire and calls for the most comprehensive and effective action, as described at the Climate Plan.


Links

• Another Record: Ocean Warming Continues through 2021 despite La Niña Conditions - by Lijing Cheng et al. 
https://link.springer.com/article/10.1007%2Fs00376-022-1461-3

• Ocean heat is at record levels, with major consequences - by Kevin Trenberth

• Arctic Data archive System - Vishop extent

• NSIDC: Charctic Interactive Sea Ice Graph

• IPCC: Marine Ice Sheet Instability

• Climate Reanalyzer
https://climatereanalyzer.org/wx/DailySummary/#seaice-snowc-topo

• Antarctica CICE ice thickness

• Antarctica’s ‘doomsday’ glacier: how its collapse could trigger global floods and swallow islands 
https://theconversation.com/antarcticas-doomsday-glacier-how-its-collapse-could-trigger-global-floods-and-swallow-islands-173940

• Methane hydrates (2013)

• Potential methane reservoirs beneath Antarctica - by Jemma Wadham et al. (2012) 
https://www.nature.com/articles/nature11374

• A new frontier in climate change science: connections between ice sheets, carbon and food webs (2021) 

• Ice velocity and thickness of the world’s glaciers - by Romain Millan et al. 
https://www.nature.com/articles/s41561-021-00885-z

• Mountain glaciers may hold less ice than previously thought – here’s what that means for 2 billion downstream water users and sea level rise 
https://theconversation.com/mountain-glaciers-may-hold-less-ice-than-previously-thought-heres-what-that-means-for-2-billion-downstream-water-users-and-sea-level-rise-176514

• Mt. Everest’s highest glacier is a sentinel for accelerating ice loss - by Mariusz Potocki et al. 

• Human-induced climate change impacts the highest reaches of the planet — Mount Everest
• Ocean Heat Content Update 1 - 2022 - Science Talk with Jim Massa
https://www.youtube.com/watch?v=pctkg_LDqcU

• NOAA - ENSO: Recent Evolution, Current Status and Predictions
https://www.cpc.ncep.noaa.gov/products/analysis_monitoring/lanina/enso_evolution-status-fcsts-web.pdf

• NOAA - Monthly Temperature Anomalies Versus El Niño 
• Human Extinction by 2022? 

• Tipping the ENSO into a permanent El Niño can trigger state transitions in global terrestrial ecosystems - by Mateo Duque-Villegas et al. (2019) 
https://esd.copernicus.org/articles/10/631/2019

• James Hansen - The New Horse Race

• Climate Impact of Decreasing Atmospheric Sulphate Aerosols and the Risk of a Termination Shock - by Leon Simons, James Hansen and Yann duFournet (2021) 

• NOAA - Solar Cycle Progression

• Aerosols

• Feedbacks

• Extinction


Sunday, December 12, 2021

Terrifying Arctic methane levels

A peak methane level of 3026 ppb was recorded by the MetOp-B satellite at 469 mb on December 11, 2021 am.

This follows a peak methane level of 3644 ppb recorded by the MetOp-B satellite at 367 mb on November 21, 2021, pm.


A peak methane level of 2716 ppb was recorded by the MetOp-B satellite at 586 mb on December 11, 2021, pm, as above image shows. This image is possibly even more terrifying than the image at the top, as above image shows that at 586 mb, i.e. much closer to sea level, almost all methane shows up over sea, rather than over land, supporting the possibility of large methane eruptions from the seafloor, especially in the Arctic. 

Also, the image was recorded later than the image at the top with the 3026 ppb peak, indicating that even more methane may be on the way. This appears to be confirmed by the Copernicus forecast for December 12, 2021, 03 UTC, as illustrated by the image below, which shows methane at 500 hPa (equivalent to 500 mb).


Furthermore, very high methane levels have recently been recorded at Barrow, Alaska, as illustrated by the image below, showing monthly averages.


And carbon dioxide levels have also been very high recently at Barrow, Alaska, as illustrated by the image below, showing daily averages. 


What causes these terrifying methane levels?

As the combination image below shows, the sea surface temperature north of Svalbard was as high as 4.3°C (or 39.74°F, green circle in the left panel) on December 12, 2021, i.e. as much as 5°C (or 9°F, green circle in the right panel) higher than 1981-2011.

[ click on images to enlarge ]

As temperatures in the Arctic keep rising faster than elsewhere in the world, the Jet Stream gets ever more distorted. The image on the right shows a heavily distorted Jet Stream covering most of the Northern Hemisphere on December 13, 2021, with sea surface temperatures off the coast of North America as much as 10.7°C (or 19.2°F, at the green circle) higher than 1981-2011.

At times, this can lead to very strong winds that push huge amounts of heat from the North Atlantic into the Arctic Ocean.

The image on the right is a forecast for December 14, 2021, showing strong wind causing waves as high as 8.3 m (or 27.2 ft) off the coast of Norway, speeding up the flow of warm water as it dives underneath the sea ice north of Svalbard. 

Huge amounts of heat can thus move into the Arctic Ocean, driven by ocean currents and temperature differences.

The danger is that warmer water will cause methane to erupt from the seafloor of the Arctic Ocean, as an earlier post warned.

[ The buffer is gone, from earlier post ]

Sea ice used to act as a buffer, by consuming energy in the process of melting, thus avoiding that this energy could raise the temperature of the water of the Arctic Ocean. As above image indicates, the buffer has now virtually disappeared. 

As sea ice gets thinner, ever less sea ice can act as a buffer. This is also illustrated by the 30-day navy.mil animation (up to November 12, the last 8 days are forecasts) on the right, from an earlier post.

Furthermore, huge amounts of heat did get transferred to the atmosphere over the Arctic Ocean, while and as long as sea ice was low in extent.

The image on the right, also from that earlier post, shows the October 2021 temperature anomaly, with anomalies over the Arctic showing up of as much as 9.1°C.

As the sea ice animation also shows, lower air temperatures after September caused the sea ice to grow in extent, effectively sealing off the Arctic Ocean and reducing heat transfer from the Arctic Ocean to the atmosphere.

Heat that was previously melting the ice or that was getting transferred to the atmosphere is now instead heating up the water. Some 75% of ESAS (East Siberian Arctic Shelf) is shallower than 50 m. Being shallow, these waters can easily warm up all the way down to the sea floor, where heat can penetrate cracks and conduits, destabilizing methane hydrates and sediments that were until now sealing off methane held in chambers in the form of free gas in these sediments.

Sealed off from the atmosphere by sea ice, greater mixing of heat in the water will occur down to the seafloor of the Arctic Ocean.

[  From the post September 2015 Sea Surface Warmest On Record ]
There are some further factors that can contribute to the high methane levels over the Arctic. As the sea ice grows in extent, this results in less moisture evaporating from the water, which together with the change of seasons results in lower hydroxyl levels at the higher latitudes of the Northern Hemisphere, in turn resulting in less methane getting broken down in the atmosphere over the Arctic.

Also, as land around the Arctic Ocean freezes over, less fresh water will flow from rivers into the Arctic Ocean. As a result, the salt content of the Arctic Ocean increases, all the way down to the seafloor of the Arctic Ocean, making it easier for ice in cracks and passages in sediments at the seafloor to melt, allowing methane contained in the sediment to escape. Meanwhile, salty and warm water (i.e. warmer than water that is present in the Arctic Ocean) keeps getting carried along the track of the Gulf Stream into the Arctic Ocean.

The threat

[ The Buffer has gone, feedback #14 on the Feedbacks page ]
The threat is that some of the extra heat will reach sediments at the seafloor of the Arctic Ocean that contain huge amounts of methane in currently still frozen hydrates and in pockets of gas underneath.

Cracks and holes in these sediments that are filled with ice can, as the ice melts away, become passageways for heat to destabilize hydrates, causing an eruption of gas as the methane expands to 160 times its frozen volume. The shockwave resulting from such an eruption can then destabilize neighboring hydrates.

This process threatens to result in ever more methane getting released, as illustrated in the image on the right, from an earlier post.


NOAA's most recent global mean methane reading is 1890.9 ppb for August 2021, with a trend of 1894.8 ppb. Meanwhile, NOAA's global mean methane level will have risen further (December levels are typically more than 10 ppb higher than August levels), while NOAA's data are also for marine surface measurements, and more methane tends to accumulate at higher altitudes. 

In other words, the current global mean of methane is now above 1900 ppb. Given that methane's concentration is rising at accelerating pace (see image right), the implication is that in an expanding troposphere, the volume of methane and thus its greenhouse effect will be rising even faster. 

A study published November 2021 in Science Advances finds a continuous rise of the tropopause in the Northern Hemisphere over 1980–2020, resulting primarily from tropospheric warming. 

As illustrated by the image below, methane on December 26 am, 2021, reached a global mean of 1939 ppb between 293 mb and 280 mb, while the highest peak level (2554 ppb) was reached higher in the atmosphere, at 218 mb.


[ click on images to enlarge ]
The animation on the right, showing methane on December 31, 2021 am, may be helpful in analysis of the origin of these terrifying methane levels.

The CO₂ level at Mauna Loa was 415.87 ppm on December 9, 2021. The MetOp-B satellite recorded a mean methane level of 1958 ppb on October 25, 2021 am at 295 mb, and when using a 1-year GWP of 200, this translates into 391.6 ppm CO₂e. Together, that's 391.6 + 415.87 = 807.47 ppm CO₂e.  

Now add an additional 5 Gt of methane from an abrupt eruption of the seafloor, which is only 10% of the 50Gt that Natalia Shakhova et al. warned about long ago, while 50 Gt is in turn only a small fraction of all the methane contained in sediments in the Arctic. Such an eruption of seafloor methane would raise the global mean methane concentration by almost 2000 ppb which, at a 1-year GWP of 200, would translate into 400 ppm CO₂.

So, that would abruptly cause the joint CO₂e of methane and CO₂ to cross the 1200 ppm clouds tipping point, triggering a further 8°C global temperature rise, due to the clouds feedback


A 5 Gt seafloor methane burst would double the methane in the atmosphere and could instantly raise CO₂e level to above 1200 ppm, thus triggering the cloud feedback (panel top right). Even with far less methane, levels of further pollutants could rise and feedbacks could strengthen, while sulfate cooling could end, and a 18.44°C rise (from pre-industrial) could occur by 2026 (left panel). Meanwhile, humans will likely go extinct with a 3°C rise, and a 5°C rise will likely end most life on Earth.


Conclusion

The situation is dire and calls for the most comprehensive and effective action, as described at the Climate Plan.


Links

• NOAA Infrared Atmospheric Sounding Interferometer (IASI) Sounding Products

• CAMS, the Copernicus Atmosphere Monitoring Service
https://atmosphere.copernicus.eu/charts/cams

• Carbon Cycle Gases, NOAA, Barrow Atmospheric Baseline Observatory, United States

• Nullschool.net

• Warning of mass extinction of species, including humans, within one decade


• Human Extinction by 2022?

• The Methane Threat
https://arctic-news.blogspot.com/2017/04/the-methane-threat.html

• High methane levels over the Arctic Ocean on January 14, 2014

• NOAA mean global monthly methane

• The Importance of Methane

• SCRIPPS - The Keeling Curve

• Will COP26 in Glasgow deliver?

• Continuous rise of the tropopause in the Northern Hemisphere over 1980–2020 - by Lingyun Meng et al.

• Frequently Asked Questions

• When Will We Die?


Monday, December 6, 2021

Planetary Extinction due to Arctic Atmospheric Methane Veil

 by Malcolm Light


Below is Malcolm Light's Arctic methane growth diagram, updated in line with recent mean atmospheric methane concentrations and temperature data. 

[ click on images to enlarge ]

NOAA mean globally-averaged marine surface data show high increases in methane levels recently, which were used to generate the trends and curves to the year 2030 in above image.

[ from earlier post ]
NASA temperature data as adjusted by Sam Carana on the right show the potential for a mean temperature anomaly from pre-industrial of 3°C anomaly to occur late in 2022 (blue trend). By extension, a 4°C anomaly could occur in late 2023 and a 5°C anomaly in late 2024. 

Above data was used to determine a trend line for exponentially increasing atmospheric methane increase, as well as where along the trend lines the surface atmospheric temperature anomalies would occur.

A surface atmospheric temperature anomaly of 10°C was recorded in France in the summer of 2020 (Copernicus 2020) with the overlying methane global veil giving a concentration of 2008 ppb. In this case the Global Warming is only partly caused by the methane (about 85.5%) and the rest by the concentration of other greenhouse gases.

It seems that we only have a very short time left until total Planetary Extinction due to the Arctic Atmospheric Methane Global Warming Veil. It is now clear that we do not have time to extract the methane from the subsea Arctic methane reserves, because we are so close to total extinction in 3 years.

The blue color on the map on the right indicates depth (see scale underneath).

The image below, by Malcolm Light and based on Max & Lowrie (1993), from a recent post, shows vulnerable Arctic Ocean slope and deep water methane hydrates zones below 300 m depth. 

Malcolm Light indicates three areas: 
Area 1. Methane hydrates on the slope; 
Area 2. Methane hydrates on the abyssal plane; 
Area 3. Methane hydrates associated with the spreading Gakkel Ridge hydro-thermal activity (the Gakkel Riidge runs in between the northern tip of Greenland and the Laptev Sea).


In addition, huge amounts of methane are contained in sediments at the bottom of the shallow parts of the Arctic Ocean, in particular the East Siberian Arctic Shelf (ESAS). Dr. Natalia Shakova warned in 2008 that some 50Gt of carbon in the form of methane can be released at any moment from the East Siberian Arctic Shelf alone, because of the high temperature of the invading Atlantic (Gulf Stream) waters. This threatens to cause a 10°C surface atmospheric temperature increase leading to Global Extinction. 

The cataclysmic weather events occurring worldwide including giant droughts and city-destroying fires, floods and summer and winter storm systems have already devastated Canada and the United States.

From the sharp increase in catastrophic weather events, it is obvious that ‘Mother Earth’ has correctly identified the North American continent as the source of its gigantic pollution problems. Extreme Fossil Fuel pollution from the United States and Canada has previously heated up the Gulf Stream which flows north into the Arctic Ocean as the Svalbard current, where it is now destabilizing the shelf methane hydrates in the Laptev Sea and on the East Siberian Arctic Shelf. 

The image below illustrates that huge amounts of heat are entering the Arctic Ocean, driven by ocean currents and temperature differences. 

[ from earlier post ]


Links 

• NOAA - Trends in Atmospheric Methane
https://gml.noaa.gov/ccgg/trends_ch4/

• Human Extinction by 2022?
https://arctic-news.blogspot.com/2021/11/human-extinction-by-2022.html

• Arctic Ocean invaded by hot, salty water
https://arctic-news.blogspot.com/2021/05/arctic-ocean-invaded-by-hot-salty-water.html

• Max, M.D. & Lowrie, A. 1993. Natural gas hydrates: Arctic and Nordic Sea potential. In: Vorren, T.O., Bergsager, E., Dahl-Stamnes, A., Holter, E., Johansen, B., Lie, E. & Lund, T.B. Arctic Geology and Petroleum Potential, Proceedings of the Norwegian Petroleum Society Conference, 15-17 August 1990, Tromso, Norway. Norwegian Petroleum Society (NPF), Special Publication 2 Elsevier, Amsterdam, 27-53. 
https://www.elsevier.com/books/arctic-geology-and-petroleum-potential/vorren/978-0-444-88943-0

• Extinction by 2027- by Malcolm Light
https://arctic-news.blogspot.com/2021/05/extinction-by-2027.html

• Anomalies of methane in the atmosphere over the East Siberian shelf: Is there any sign of methane leakage from shallow shelf hydrates? - by Shakhova, Semiletov, Salyuk and Kosmach (2008) 
https://www.cosis.net/abstracts/EGU2008/01526/EGU2008-A-01526.pdf

• Will humans be extinct by 2026? - An exploration of the potential, by Sam Carana

• WARNING - Planetary Omnicide between 2023 and 2031 - by Malcolm Light
https://arctic-news.blogspot.com/2015/02/warning-planetary-omnicide-between-2023-and-2031.html