On June 1, 2020, NOAA recorded a daily average carbon dioxide (CO₂) level of 418.32 ppm at Mauna Loa, Hawaii.
The image below shows hourly average CO₂ levels approaching 419 ppm at Mauna Loa on May 1, 2020.
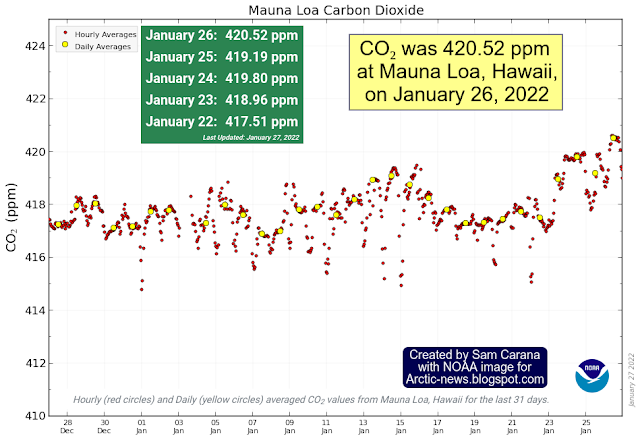
The image below shows hourly (red circles) and daily (yellow circles) averaged CO₂ values at Mauna Loa, Hawaii over 31 days, up to May 31, 2020, with some recent hourly averages showing up with values exceeding 419 ppm.
The image below shows hourly (red circles) and daily (yellow circles) averaged CO₂ values at Mauna Loa, Hawaii over 31 days, through June 1, 2020, when a daily average of 418.32 ppm was recorded.
By comparison, the highest daily average CO₂ level recorded by NOAA in 2019 at Mauna Loa was 415.64 ppm, as discussed in an
. The image below shows how CO₂ growth has increased over the decades.
As illustrated by the image below, the daily average CO₂ on June 1, 2019, was 414.14 ppm and the daily average CO₂ on June 1, 2020, was 418.32 ppm, i.e. 4.18 ppm higher. The average in May 2019 was 414.65 ppm and the average in May 2020 was 417.07 ppm, i.e. 2.42 ppm higher. Since the annual maximum is typically reached in May, this high reading for June 1, 2020, could indicate that, while CO₂ emissions by people were suppressed in April and May 2020 due to the COVID-19 lockdowns, growth of CO₂ levels in the atmosphere continues to speed up now as restrictions are relaxed.
Even more significant than the daily averages could be the hourly averages. The daily average CO₂ level recorded by
at Mauna Loa, Hawaii, was 418.04 ppm on May 25, 2020. On May 24, 2020, one hourly average exceeded 420 ppm, at which time emissions by people had raised CO₂ levels by some 160 ppm compared to the situation thousands of years ago, and by even more if levels had continued to follow a natural trend, as illustrated by the image and inset below.
A rise of 100 ppm CO₂ has historically corresponded with a global temperature rise of some 10°C or 18°F, when looking at CO₂ levels and temperatures over the past 420,000 years, as illustrated by the image below.

Concentrations of carbon dioxide, methane (CH₄) and nitrous oxide (N₂O) in 2018 surged by higher amounts than during the past decade, according to a 2019 WMO
news release and as illustrated by the image on the right, from an
earlier post, which shows that CH₄, CO₂ and N₂O levels in the atmosphere in 2018 were, respectively, 259%, 147% and 123% of their pre-industrial (before 1750) levels.
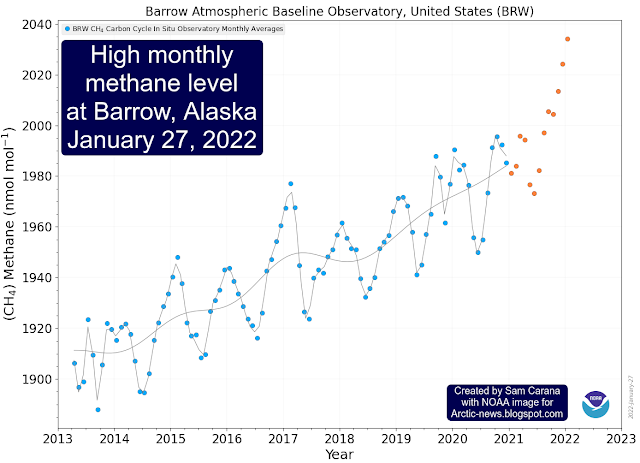
So, methane levels have been rising much faster than CO₂ since 1750 and there is much potential for an even faster rise in methane levels due to seafloor hydrate releases.
Furthermore, as industrial activity declines in the wake of COVID-19, loss of aerosol masking alone could trigger a rapid rise, as discussed by
Guy McPherson in recent papers
here and
here.
Given this, the 160 ppm rise in CO₂ could lead to a global temperature rise of 18°C or 32.4°F from 1750, and such a rise could unfold soon, as oceans and ice take up ever less heat and further feedbacks kick in, as also discussed in earlier post such as
this one and
this one.
Levels for methane and nitrous oxide were very high in May 2020, as further discussed below.
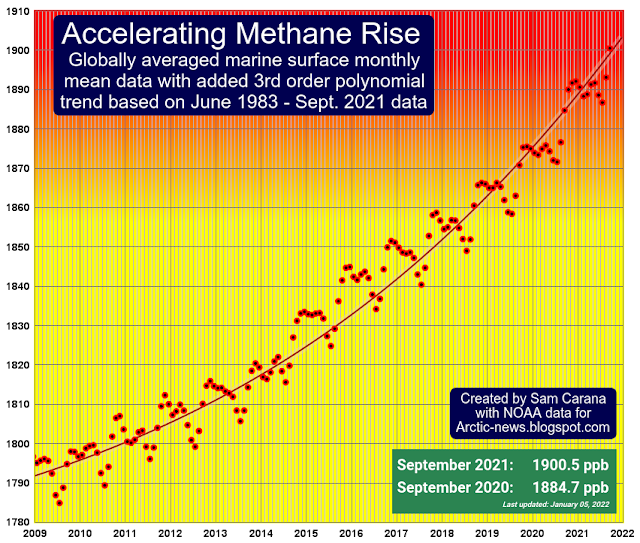
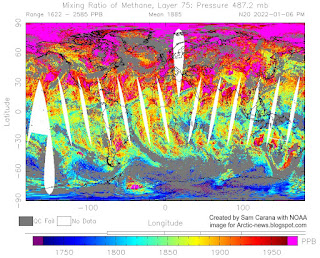
Methane
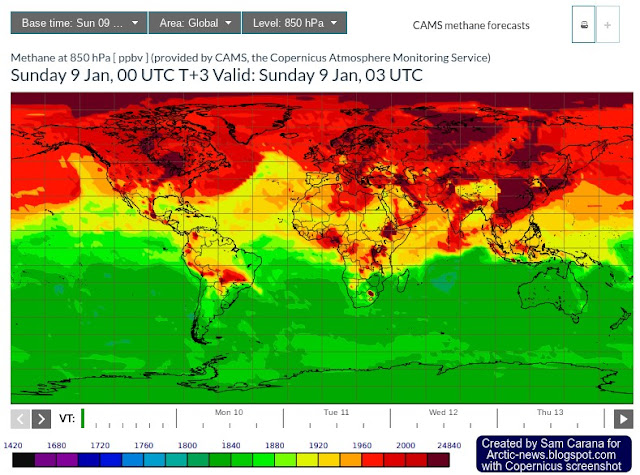
MetOp-1 recorded peak methane levels of 2917 ppb at 469 mb on the afternoon of May 22, 2020.
MetOp-1 recorded mean methane levels of 1896 ppb at 336 mb on the morning of May 22, 2020.
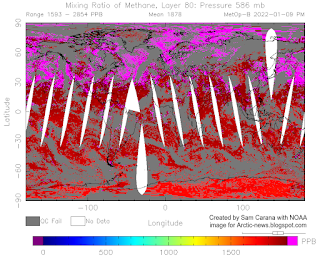
MetOp-2 recorded peak methane levels of 1918 ppb at 586 mb on the afternoon of May 24, 2020.
Nitrous Oxide
N20 recorded peak nitrous oxide levels of 366 ppb at 840 mb on the morning of May 21, 2020.
N20 recorded somewhat lower peak nitrous oxide levels of 346.9 ppb at 487.2 mb on the afternoon of May 23, 2020, but look at how much of Antarctica is covered by the magenta color, reflecting levels at the top end of the scale.
Rising greenhouse gas levels are damaging the ozone layer
Nitrous oxide is both a potent greenhouse gas and an
ozone depleting substance that is thus directly damaging the ozone layer.
Additionally, rising greenhouse gas levels are indirectly damaging the ozone layer in three ways:
Firstly, rising greenhouse gas levels are making water vapor enter the stratosphere. Higher sea surface temperatures along the path of the Gulf Stream
fuel hurricanes traveling north along North America's east coast. More heat also translates into more wind; stronger hurricanes are getting stronger over the years.
Rising levels of greenhouse gases
strengthen winds and increase water vapor in the atmosphere. Temperatures are rising faster in the Arctic than in the rest of the world, as illustrated by the image below, and this is changing the Jet Stream.
 |
| [ click on images to enlarge ] |
Jennifer Francis has long pointed out that, as temperatures at the North Pole are rising faster than at the Equator, the Jet Stream is becoming wavier and can get stuck in a 'blocking pattern' for days, increasing the duration and intensity of extreme weather events. This can result in stronger storms moving more water vapor inland over the U.S., as discussed in earlier posts such as
this one. Such storms can cause large amounts of water vapor to rise high up in the sky. Water vapor that enters the stratosphere can
damage the ozone layer.
Secondly, as plumes above the anvils of severe storms bring water vapor up into the stratosphere, this also contributes to the formation of
cirrus clouds that trap a lot of heat that would otherwise be radiated away, from Earth into space.
Thirdly, higher temperatures and stronger winds increase the intensity of droughts. Heatwaves combined with strong winds, dry soil and dry vegetation can make forest fires produce smoke that can
enter the stratosphere and stay there for along time.
Recent examples of extreme weather events are described below, i.e. a huge storm and a heatwave in the Arctic.
Super Typhoon Amphan hits India and Bangladesh
Also in May 2020, super typhoon Amphan hit India and Bangladesh, with high waves and heavy rainfall. Waves as high as 14.2 m or 46.6 ft were forecast (at the green circle) for May 20, 2020, 06:00 UTC as Amphan approached Bangladesh.
"Once once-in-a-century, now once-in-a-decade", comments Sam Carana on
this and other events.
The sea surface temperature image below shows that, on May 17, 2020, ocean temperatures were as high as 32.9°C or 91.1°F.
The combination image below shows high sea surface temperatures on May 15, 2020, 12:00 UTC, in the left panel.
Anomalies in the Indian Ocean were as high as 3.4°C or 6.0°F, in the Arctic Ocean as high as 1°C or 1.8°F and in the Pacific Ocean as high as 5.1°C or 9.1°F. Anomalies are from daily average during years 1981-2011.
The right panel of the combination image shows how these high ocean temperatures cause circular wind patterns. Wind speed was as high as 255 km/h or 159 mph in the Indian Ocean, at the location of super typhoon Amphan, on May 18, 2020, 06:00 UTC, while instantaneous wind power density was as high as 177.2 kW/m².
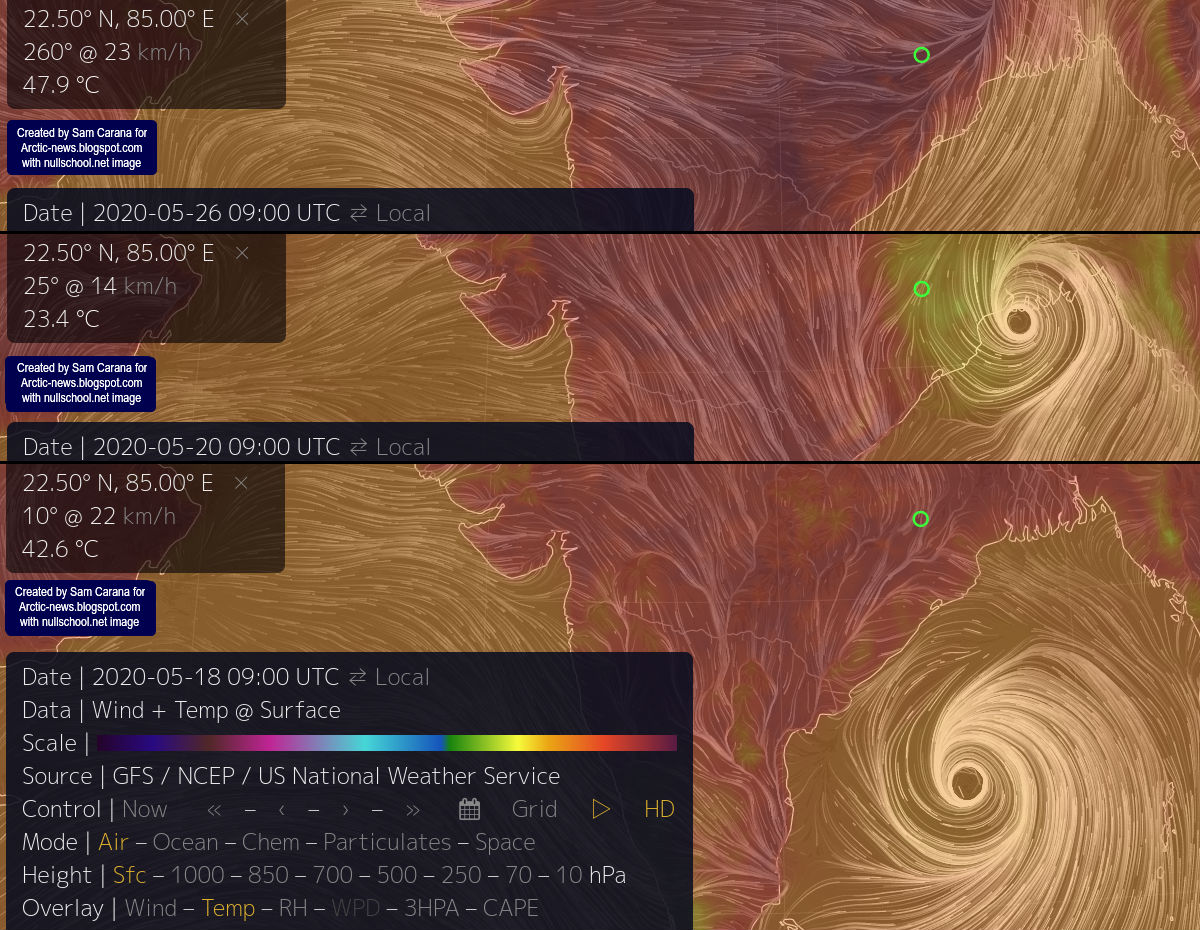
The combination image below shows the temporary cooling impact of Amphan.
The bottom panel shows that on May 18, 2020 09:00 UTC, the temperature at a location in India was 42.6°C or 108.6°F, as Amphan was approaching from the South.
The middle panel shows that, two days later, at the same location and at same time of day, the temperature had fallen to 23.4°C or 74°F as Amphan hit the area.
The cooling is only temporary. The top panel shows that a temperature of 47.9°C or 118.1°F is forecast for that location, same time of day, for May 26, 2020.
Siberian Heatwave
A heatwave hit Siberia in May 2020.
Above image shows that temperature anomalies were forecast to be at the high end of the scale over Siberia on May 22, 2020, 06:00 UTC, i.e. 30°C or 54°F higher than 1979-2000. At the same time, cold temperatures are forecast for much of eastern Europe.
What enables such a strong heatwave to develop is that the Jet Stream is getting more wavy as the temperature difference between the North Pole and the Equator is narrowing, causing both hot air to move up into the Arctic (red arrow) and cold air to descend out of the Arctic (blue arrow).
The Siberian heatwave threatens to trigger forest fires that can cause large amounts of black carbon to settle on the snow and ice cover, speeding up its demise. Furthermore, the heatwave threatens rivers to heat up that carry large amounts of water into the Arctic Ocean. Finally, as discussed, more intense forest fires threaten to cause organic carbon compounds to enter the stratosphere.
Extinction mechanism
A
recent study by John Marshall et al. found that the Devionian mass extinction event 360 million years ago, that killed much of the Earth's plant and freshwater aquatic life, was caused by a brief breakdown of the ozone layer. John Marshall
says: "Current estimates suggest we will reach similar global temperatures to those of 360 million years ago, with the possibility that a similar collapse of the ozone layer could occur again, exposing surface and shallow sea life to deadly radiation. This would move us from the current state of climate change, to a climate emergency."
John refers to the
work by James Anderson et al., who warn that CO₂ and CH₄ release from clathrates and permafrost could cause more water to get carried into the stratosphere. John further
describes the 'Extinction mechanism': "High summer temperatures over continental areas can increase the transport of water vapour high into the atmosphere. This water vapour carries with it organic carbon compounds that include chlorine, which are produced naturally by a wide variety of plants, algae and fungi. Once these compounds are near the ozone layer, they release the chlorine and this breaks down ozone molecules. This produces a positive feedback loop because a collapsing terrestrial ecosystem will release a flush of nutrients into the oceans, which can cause a rapid increase in algae."
Arctic sea ice volume
As
Guy McPherson points out, COVID-19 alone could trigger an abrupt huge temperature rise.
Furthermore, loss of Arctic sea ice could cause a rapid
temperature rise.
Ominously, Arctic sea ice volume has been at record low since the start of 2020, while 2019 volume was at a record low from October, making that volume has now been at record low for almost 8 months straight.
The situation is dire and calls for immediate, comprehensive and effective action as described in the
Climate Plan.
Links
• Climate Plan
https://arctic-news.blogspot.com/p/climateplan.html
• Climate Plan (June 1, 2019 version)
https://arctic-news.blogspot.com/2019/06/climate-plan.html
• The Keeling Curve - Scripps Institution of Oceanography at UC San Diego
https://scripps.ucsd.edu/programs/keelingcurve
• 417.93 parts per million (ppm) CO2 in air 24-May-2020
https://twitter.com/Keeling_curve/status/1264955470655025152
• Greenhouse Gas Levels Keep Accelerating
https://arctic-news.blogspot.com/2019/05/greenhouse-gas-levels-keep-accelerating.html
• Will COVID-19 Trigger Extinction of All Life on Earth? - by Guy McPherson
https://opastonline.com/wp-content/uploads/2020/04/will-covid-19-trigger-extinction-of-all-life-on-earth-eesrr-20-.pdf
• Earth is in the Midst of Abrupt, Irreversible Climate Change - by Guy McPherson
https://www.onlinescientificresearch.com/articles/earth-is-in-the-midst-of-abrupt-irreversible-climate-change.pdf
• Extinction
https://arctic-news.blogspot.com/p/extinction.html
• Most Important Message Ever
https://arctic-news.blogspot.com/2019/07/most-important-message-ever.html
• Methane
https://arctic-news.blogspot.com/p/methane.html
• Study shows erosion of ozone layer responsible for mass extinction event
https://www.eurekalert.org/pub_releases/2020-05/uos-sse052620.php
• UV-B radiation was the Devonian-Carboniferous boundary terrestrial extinction kill mechanism - by John Marshall et al.
https://advances.sciencemag.org/content/6/22/eaba0768
• Prehistoric climate change damaged the ozone layer and led to a mass extinction - by John Marshall
https://theconversation.com/prehistoric-climate-change-damaged-the-ozone-layer-and-led-to-a-mass-extinction-139519
• UV Dosage Levels in Summer: Increased Risk of Ozone Loss from Convectively Injected Water Vapor - by James Anderson et al.
https://science.sciencemag.org/content/337/6096/835
• Care for the Ozone Layer
https://arctic-news.blogspot.com/2019/01/care-for-the-ozone-layer.html
• Why stronger winds over the North Atlantic are so dangerous
https://arctic-news.blogspot.com/2020/02/why-stronger-winds-over-north-atlantic-are-so-dangerous.html
• A Global Temperature Rise Of More than Ten Degrees Celsius By 2026?
https://arctic-news.blogspot.com/2016/07/a-global-temperature-rise-of-more-than-ten-degrees-celsius-by-2026.html
• Forces behind Superstorm Sandy
https://arctic-news.blogspot.com/2012/11/forces-behind-superstorm-sandy.html
• April 2020 temperatures very high
https://arctic-news.blogspot.com/2020/05/april-2020-temperatures-very-high.html
• Could Humans Go Extinct Within Years?
https://arctic-news.blogspot.com/2020/01/could-humans-go-extinct-within-years.html
• Arctic Ocean November 2019
https://arctic-news.blogspot.com/2019/11/arctic-ocean-november-2019.html