Showing posts with label Antarctica. Show all posts

Wednesday, February 9, 2022

Accelerating loss of global snow and ice cover


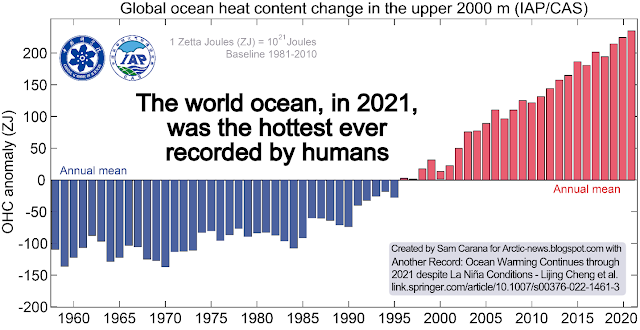
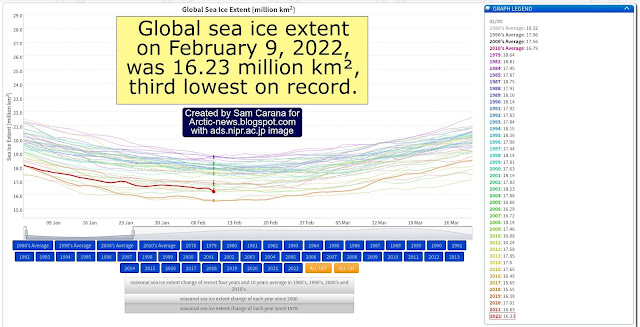
Ocean heat is at record levels. As a result, global sea ice extent was only 16.23 million km² on February 9, 2022, the third lowest extent on record. What makes this even more worrying is that we're currently in the depth of a persistent La Niña.


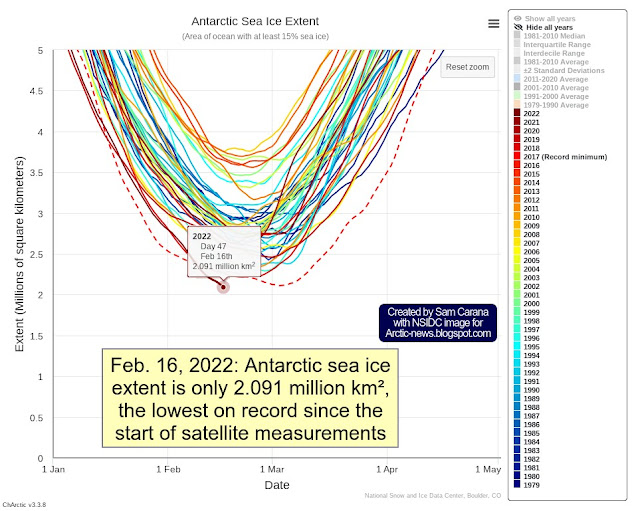
Antarctic sea ice at lowest extent on record since start satellite measurements

Ocean heat is a huge threat for Antarctica at the moment. The image below shows that Antarctic sea ice extent was only 2.091 million km² on February 16, 2022, the lowest on record since the start of satellite measurements.


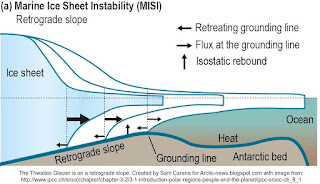
Ocean heat is reducing the sea ice around Antarctica and is getting underneath floating sea ice. 

The Thwaites Glacier, which is on a retrograde slope, is especially vulnerable to collapse. 

The Thwaites Glacier contains enough ice to raise global sea levels by 65 cm (25.59 inches) if it were to completely collapse.

The animation on the right, created with images from Climate Reanalyzer, shows the retreat of the Antarctic snow and ice cover from January 5 to February 18, 2021. 

The animation underneath, by navy.mil, shows sea ice thickness over 30 days up to February 17, 2022 (with 8 days of forecasts added).

Another danger of a rapid loss of the snow and ice cover on Antarctica is release of methane. Jemma Wadham warned about this in a 2012 study, as discussed at the post methane hydrates. More recently, Jemma Wadham said: “We are sleepwalking into a catastrophe for humanity.

The Thwaites Glacier is often called the Doomsday Glacier because if it collapses it would lead to vast sea level rise, and scientists believe it is likely to fail within a few years, says Cliff Seruntine (the Naturalist) in the video below. 


A recent study concludes that mountain glaciers may hold less ice than previously thought. Their disappearance means less water for drinking and agriculture, and faster temperature rises due to albedo loss. While the study found that the Himalayas contain more water than thought, another recent study, Mt. Everest’s highest glacier is a sentinel for accelerating ice loss, describes how human-induced climate change has a huge impact on the highest reaches of the planet.

The outlook for the Arctic is most threatening, as the post methane hydrates also concluded back in 2013, as described in numerous post here at Arctic-news and as discussed in the video below by Jim Massa.


A huge temperature rise threatens to unfold soon


Above image indicates that the difference between the top of El Niño and the bottom of La Niña could be more than half a degree Celsius.

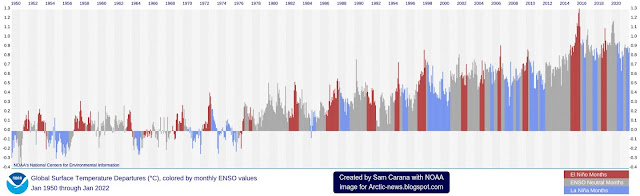
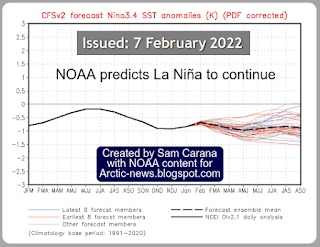
As said, we're currently in the depth of a persistent La Niña, which suppresses temperatures. As the temperature keeps rising, ever more frequent strong El Niño events are likely to occur, as discussed in an earlier post

A 2019 study analyzes how tipping the ENSO into a permanent El Niño can trigger state transitions in global terrestrial ecosystems.

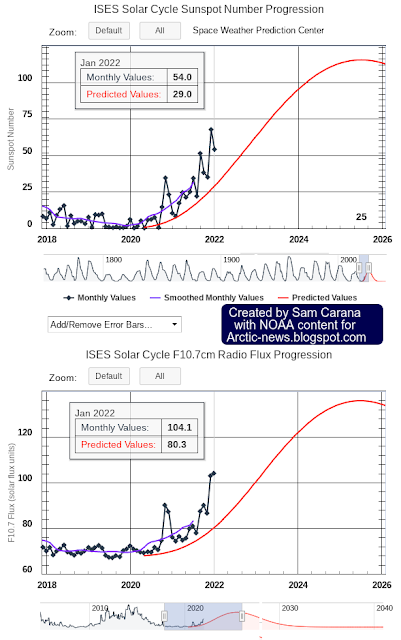
Currently, the temperature rise is additionally suppressed by low sunspots. Within a few years time, sunspots can be expected to reach the peak of their current cycle and observed sunspots are looking stronger than predicted. 

In the image below on the right, adapted from NOAA, the solar cycle is represented as the number of sunspots (top) and F10.7cm radio flux (bottom). 

In a recent communication, James Hansen repeats that, as reductions take place in the sulfate aerosols that are currently co-emitted by traffic, transport and industry, this is causing the current temperature rise to accelerate and could cause further rapid global warming, referred to in a 2021 presentation as a termination shock.

Furthermore, in addition to a huge temperature rise resulting from sulfate aerosols falling away, there could be a further rise in temperature as a result of releases of other aerosols with a net warming impact, such as black and brown carbon, which can increase dramatically as more wood burning and forest fires take place.

In summary, while the temperatures are accelerating, we'll soon be moving into the next El Niño, with sunspots moving toward a peak, with sulfate aerosols causing a termination shock and with other aerosols further driving up the temperature rise. 

Stop the deception!

In a giant scheme of deception, the temperature rise is all too often presented with images of people playing on the beach on a 'warm' day, as if 'global warming' was making life more 'comfortable'. 

Forest fires are called 'wildfires', biomass burning and associated deforestation is referred to as 'renewable biofuel', fracking-induced earthquakes are called 'natural' disasters and methane eruptions are called seeps and bubbles of 'natural' gas from 'natural' sources such as wetlands. 

This gives the false impression that this was somehow 'natural' as if human activities had nothing to do with it, and as if owning beach-front property was becoming ever more attractive.


Let's stop this deception! In reality, human-caused emissions have a huge short-term impact on temperature and their combination with genuinely natural variability such as El Niño and sunspots can act as a catalyst, causing numerous feedbacks to kick in with ever greater ferocity. 

This can result in collapse of global sea ice and permafrost, resulting in albedo loss and eruption of huge quantities of carbon dioxide, methane and nitrous oxide, further driving up the temperature rise abruptly, as described at the extinction page. Further feedbacks are also described at the feedbacks page

Conclusion

The situation is dire and calls for the most comprehensive and effective action, as described at the Climate Plan.


Links

• Another Record: Ocean Warming Continues through 2021 despite La Niña Conditions - by Lijing Cheng et al. 
https://link.springer.com/article/10.1007%2Fs00376-022-1461-3

• Ocean heat is at record levels, with major consequences - by Kevin Trenberth

• Arctic Data archive System - Vishop extent

• NSIDC: Charctic Interactive Sea Ice Graph

• IPCC: Marine Ice Sheet Instability

• Climate Reanalyzer
https://climatereanalyzer.org/wx/DailySummary/#seaice-snowc-topo

• Antarctica CICE ice thickness

• Antarctica’s ‘doomsday’ glacier: how its collapse could trigger global floods and swallow islands 
https://theconversation.com/antarcticas-doomsday-glacier-how-its-collapse-could-trigger-global-floods-and-swallow-islands-173940

• Methane hydrates (2013)

• Potential methane reservoirs beneath Antarctica - by Jemma Wadham et al. (2012) 
https://www.nature.com/articles/nature11374

• A new frontier in climate change science: connections between ice sheets, carbon and food webs (2021) 

• Ice velocity and thickness of the world’s glaciers - by Romain Millan et al. 
https://www.nature.com/articles/s41561-021-00885-z

• Mountain glaciers may hold less ice than previously thought – here’s what that means for 2 billion downstream water users and sea level rise 
https://theconversation.com/mountain-glaciers-may-hold-less-ice-than-previously-thought-heres-what-that-means-for-2-billion-downstream-water-users-and-sea-level-rise-176514

• Mt. Everest’s highest glacier is a sentinel for accelerating ice loss - by Mariusz Potocki et al. 

• Human-induced climate change impacts the highest reaches of the planet — Mount Everest
• Ocean Heat Content Update 1 - 2022 - Science Talk with Jim Massa
https://www.youtube.com/watch?v=pctkg_LDqcU

• NOAA - ENSO: Recent Evolution, Current Status and Predictions
https://www.cpc.ncep.noaa.gov/products/analysis_monitoring/lanina/enso_evolution-status-fcsts-web.pdf

• NOAA - Monthly Temperature Anomalies Versus El Niño 
• Human Extinction by 2022? 

• Tipping the ENSO into a permanent El Niño can trigger state transitions in global terrestrial ecosystems - by Mateo Duque-Villegas et al. (2019) 
https://esd.copernicus.org/articles/10/631/2019

• James Hansen - The New Horse Race

• Climate Impact of Decreasing Atmospheric Sulphate Aerosols and the Risk of a Termination Shock - by Leon Simons, James Hansen and Yann duFournet (2021) 

• NOAA - Solar Cycle Progression

• Aerosols

• Feedbacks

• Extinction


Friday, June 21, 2019

Beyond climate tipping points

Beyond climate tipping points
Greenhouse gas levels exceed the stability limit of the
Greenland and Antarctic ice sheets

by Andrew Glikson

Abstract

The pace of global warming has been grossly underestimated. As the world keeps increasing its carbon dioxide (CO₂) emissions, rising in 2018 to a record 33.1 billion ton of CO₂ per year, the atmospheric greenhouse gas level has now exceeded 560 ppm (parts per million) CO-equivalent, namely when methane and nitrous oxide are included. This level surpasses the stability threshold of the Greenland and Antarctic ice sheets. The term “climate change” is thus no longer appropriate, since what is happening in the atmosphere-ocean system, accelerating over the last 70 years or so, is an abrupt calamity on a geological dimension, threatening nature and human civilization. Ignoring what the science says, the powers-that-be are presiding over the sixth mass extinction of species, including humanity.

As conveyed by leading scientists “Climate change is now reaching the end-game, where very soon humanity must choose between taking unprecedented action, or accepting that it has been left too late and bear the consequences” (Prof. Hans Joachim Schellnhuber) ... “We’ve reached a point where we have a crisis, an emergency, but people don’t know that ... There’s a big gap between what’s understood about global warming by the scientific community and what is known by the public and policymakers” (Prof. James Hansen).


Rising greenhouse gases and temperatures

By May 2019 CO₂ levels (measured at Mauna Loa, Hawaii) reached 414.66 ppm, growing at a rate of 3.42 ppm/year, well above the highest rate recorded for the last 65 million years. The total CO, methane (CH) and nitrous oxide (NO) expressed as CO-equivalents has reached at least 560.3 ppm (Table 1) (at a very low forcing value for methane ¹), the highest concentration since 34 - 23 Million years ago, when atmospheric CO ranged between 350 and 500 ppm.

Table 1. Total atmospheric CO2e from CO2, CH4 and N2O
CO2
CO2 rate
CH4
CH4 rate
N2O
414.66 ppm 
3.42 ppm/year
1865.4 ppb
9.2 ppm/year
332ppb
CO2 ppm 
rise/year
CH4 forcing ≥25 CO2e
CH4 ppb
rise/year
N2O forcing = 298 CO2e
CO2 ppm 
414.7

CH4 ppm forcing
1.865 x ≥25 =
46.6 ppm CO2e 
(equivalent)

N2O ppm forcing
0.332 x 298 =
99 ppm CO2e 
(equivalent)

Total CO2e: 414.7+46.6+99 = >560.3 ppm CO2
¹A methane forcing value of 25 x CO2 is very low. Higher forcing values are more appropriate.
Plus: SF₆, CHF3, CH2F2, CF4, C2F6, C3F8, C4F10, C4F8, C5F12, C6F1


Figure 1. Projected CO₂ levels for IPCC emission scenarios

The current rise of the total greenhouse gas levels to at least 560 ppm CO-equivalent, twice the pre-industrial CO2 level of 280 ppm, implies that global warming has potentially reached +2°C to +3°C above pre-industral temperature. Considering the mitigating albedo/reflection effects of atmospheric aerosols, including sulphur dioxide, dust, nitrate and organic carbon, the mean rise of land temperature exceeds +1.5°C (Berkeley Earth institute).

The threshold for collapse of the Greenland ice sheet is estimated in the range of 400-560 ppm CO₂ at approximately 2.0 - 2.5 degrees Celsius above pre-industrial temperatures, and is retarded by hysteresis (where a physical property lags behind changes in the effect causing it). The threshold for the breakdown of the West Antarctic ice sheet is similar. The greenhouse gas level and temperature conditions under which the East Antarctic ice sheet formed about 34 million years ago are estimated as ~800–2000 ppm at 4 to 6 degrees Celsius above pre-industrial values. Based mainly on satellite gravity data there is evidence the East Antarctic ice sheet is beginning to melt in places (Jones, 2019), with ice loss rates of approximately 40 Gt/y (Gigaton of ice per year) in 1979–1990 and up to to 252 Gt/y in 2009–2017 (Rignot et al., 2019).

The cumulative contribution to sea-level rise from Antarctic ice melt was 14.0 ± 2.0 mm since 1979. This includes 6.9 ± 0.6 mm from West Antarctica, 4.4 ± 0.9 mm from East Antarctica, and 2.5 ± 0.4 mm from the Antarctic Peninsula (Rignot et al., 2019). Based on the above the current CO-equivalent level of at least 560 ppm closely correlates with the temperature peak at ~16 million tears ago (Figures 2 and 5), when the Greenland ice sheet did not exist and large variations affected the Antarctic ice sheet (Gasson et al., 2016).

Figure 2. Updated Cenozoic pCO₂ and stacked deep-sea benthic foraminifer oxygen isotope curve for 0 to
65 Ma (Zachos et al., 2008) converted to the Gradstein timescale (Gradstein et al., 2004).
ETM2 = Eocene Thermal Maximum 2, PETM = Paleocene/Eocene Thermal Maximum.

Transient melt events

As the glacial sheets disintegrate, cold ice-melt water flowing into the ocean ensue in large cold water pools, a pattern recorded through the glacial-interglacial cycles of the last 450,000 years, manifested by the growth of cold regions in the north Atlantic Ocean south of Greenland and in the Southern Ocean fringing Antarctica (Figures 3 and 4). The warming of the Arctic is driven by the ice-water albedo flip (where dark sea-water absorbing solar energy alternate with high-albedo ice and snow) and by the weakening of the polar boundary and jet stream. Penetration of Arctic-derived cold air masses through the weakened boundary results in extreme weather events in North America, Europe and northern Asia, such as the Beast from the East event.

Warming of +3°C to +4°C above pre-industrial levels, leading to enhanced ice-sheet melt, would raise sea levels by 2 to 5 meters toward the end of the century, and likely by 25 meters in the longer term. Golledge et al. (2019) show meltwater from Greenland will lead to substantial slowing of the Atlantic overturning circulation, while meltwater from Antarctica will trap warm water below the sea surface, increasing Antarctic ice loss. The effects of ice sheet-melt waters on the oceans were hardly included in IPCC models. Depending on the amplifying feedbacks, prolonged Greenland and Antarctic melting (Figures 3 and 4) and a consequent freeze event may ensue, lasting perhaps as long as two to three centuries.


Figure 3. (A) Global warming map (NASA 2018). Note the cool ocean regions south of Greenland
and along the Antarctic. Credits: Scientific Visualization Studio/Goddard Space Flight Center;
(B) 2012 Ocean temperatures around Antarctica, (NASA 2012).

21st–23rd centuries uncharted climate territory

Modelling of climate trends for the 2100-2300 by the IPCC AR5 Synthesis Report, 2014 portrays predominantly linear models of greenhouse gas rise, global temperatures and sea levels. These models however appear to take little account of amplifying feedbacks from land and ocean and of the effects of cold ice-melt water on the oceans. According to Steffen et al. (2018) “self-reinforcing feedbacks could push the Earth System toward a planetary threshold” and “would lead to a much higher global average temperature than any interglacial in the past 1.2 million years and to sea levels significantly higher than at any time in the Holocene”.

Amplifying feedbacks of global warming include:
  • The albedo-flip in melting sea ice and ice sheets and the increase of the water surface area and thereby the sequestration of CO₂. Hudson (2011) estimates a rise in radiative forcing due to removal of Arctic summer sea ice of 0.7 Watt/m², a value close to the total of methane release since 1750.
  • Reduced ocean CO₂ intake due to lesser solubility of the gas with higher temperatures.
  • Vegetation desiccation and loss in some regions, and thereby reduced evaporation with its cooling effect. This factor and the increase of precipitation in other regions lead to a differential feedbacks from vegetation as the globe warms (Notaro et al. 2007).
  • An increase in wildfires, releasing greenhouse gases.
  • Release of methane from permafrost, bogs and sediments and other factors.
Linear temperature models do not appear to take into account the effects on the oceans of ice melt water derived from the large ice sheets, including the possibility of a major stadial event such as already started in oceanic tracts fringing Greenland and Antarctica (Figure 3). In the shorter term sea level rises include the Greenland ice sheet (6-7 meter sea level rise) and West Antarctic ice sheet melt (4.8 meter sea level rise). Referring to major past stadial events, including the 8200 years-old Laurentian melt event and the 12.7-11.9 younger dryas event, a prolonged breakdown of parts of the Antarctic ice sheet could result in major sea level rise and extensive cooling of northern and southern latitudes, parallel with warming of tropical and mid-latitudes (Figure 4) (Hansen et al., 2016). The clashes between polar-derived cold weather fronts and tropical air masses are bound to lead to extreme weather events, echoed in Storms of my grandchildren (Hansen, 2010).

Figure 4. Model Surface-air temperature (°C) for 2096 relative to 1880–1920 (Hansen et al. 2016).
The projection portrays major cooling of the North Atlantic Ocean, cooling of the circum-Antarctic Ocean 

and further warming in the tropics, subtropics and the interior of continents, including Siberia and Canada.

Summary and conclusions
  1. Global greenhouse gases have reached a level exceeding the stability threshold of the Greenland and Antarctic ice sheets, melting at an accelerated rate
  2. The current growth rate of atmospheric greenhouse gas of 3.42 ppm CO₂/year is the fastest recorded for the last 55 million years
  3. Allowing for the transient albedo enhancing effects of sulphur dioxide and other aerosols, mean global temperature has reached about 2 degrees Celsius above pre-industrial temperatures. 
  4. Due to hysteresis the large ice sheets outlast their melting temperatures. 
  5. Cold ice melt water flowing from the ice sheets at an accelerated rate will reduce the temperature of large ocean tracts in the North Atlantic and circum-Antarctic. Strong temperature contrasts between cold polar-derived air and water masses and tropical air and water masses would result in extreme weather events, retarding agriculture in large parts of the world. 
  6. Humans will survive in relatively favorable parts of Earth, such as sub-polar regions and sheltered mountain valleys, where hunting of surviving fauna may be possible.
  7. In the wake of partial melting of the large ice sheets, the Earth climate would shift to polarized conditions including reduced polar ice sheets and tropical to super-tropical regions such as existed in the Miocene (5.3 - 23 million years ago) (Figure 5). 
Figure 5. Late Oligocene–Miocene inferred atmospheric CO2 fluctuations and effects on global temperature
based on Stromata index (SI) of 25 and 12 Ma (late Oligocene to late middle Miocene) fossil leaf remains;
(A) Reconstructed late Oligocene–middle Miocene CO2 levels based on individual independently
calibrated tree species; (B) Modeled temperature departure of global mean surface temperature from
present day, calculated from mean CO2 estimates by using a CO2–temperature sensitivity study. Red
discontinuous lines: 2019 CO2-e levels and 2019 temperatures (discounting the aerosol masking effects).
Current greenhouse gas forcing and global mean temperature are approaching Miocene Optimum-like composition, bar the hysteresis effects of reduced ice sheets (Figure 5). Strong temperature polarities are suggested by the contrasts between reduced Antarctic ice sheet and super-tropical conditions in low to mid-latitudes. Land areas would be markedly reduced due to a sea level rise of approximately 40 ± 15 meters.
Andrew Glikson


Dr Andrew Glikson
Earth and climate scientist
Australian National University
Canberra, Australian Territory, Australia
geospec@iinet.net.au

Books:
The Archaean: Geological and Geochemical Windows into the Early Earth
The Asteroid Impact Connection of Planetary Evolution
Asteroids Impacts, Crustal Evolution and Related Mineral Systems with Special Reference to Australia
Climate, Fire and Human Evolution: The Deep Time Dimensions of the Anthropocene
The Plutocene: Blueprints for a Post-Anthropocene Greenhouse Earth
Evolution of the Atmosphere, Fire and the Anthropocene Climate Event Horizon
From Stars to Brains: Milestones in the Planetary Evolution of Life and Intelligence

From Stars to Brains: Milestones in the Planetary Evolution of Life and Intelligence

The Plutocene: Blueprints for a Post-Anthropocene Greenhouse Earth

Added below is a video with an August 6, 2019, interview of Andrew Glikson by Guy McPherson and Kevin Hester, as edited by Tim Bob.


Saturday, September 6, 2014

Antarctica linked to Arctic

Waters in the Arctic Ocean continue to warm up. Very warm waters from the North Atlantic and Pacific Ocean are invading the Arctic Ocean.


Waters in the North Atlantic and in the North Pacific are very warm, due to a number of reasons.

What is happening in the oceans is very important in this respect. As discussed in earlier posts, most of the extra heat caused by people's emissions goes into the oceans.

The great ocean conveyor belt (Thermohaline Circulation), brings warm water from the southern hemisphere to the northern hemisphere.

The Gulf Stream is the North Atlantic leg of the great ocean conveyor belt, and it brings dense, salty water from the North Atlantic into the Arctic Ocean.

Saltier water is denser than fresher water because the dissolved salts fill interstices between water molecules, resulting in more mass per unit volume.

Very dense ocean water can be found in the North Atlantic because the North Atlantic has high salinity, due to high evaporation rates, while salty water is also coming from the Mediterranean Sea.

As also discussed in an earlier post, this dense, saltier water sinks in the North Atlantic, accumulating in deeper water.

By contrast, much of the Arctic Ocean has low salinity, due to ice melt and river runoff.  As it enters the Arctic Ocean, the warm and dense water from the Atlantic thus dives under the under the sea ice and under the less salty surface water in the Arctic Ocean.

In conclusion, much of the heat resulting from people's emissions accumulates in the North Atlantic and also ends up in the Arctic. This partly explains why surface temperatures are rising much faster at the poles, as illustrated by the NOAA image below.


There are further reasons why surface air temperatures elsewhere (other than at the poles) are rising less rapidly than they did, say, a decade ago. As also discussed by Andrew Glikson in the post No Planet B, the increased amounts of sulphur emitted by the growing number of coal-fired power plants and by the burning of bunker fuel on sea is (temporarily) masking the full wrath of global warming.

Another reason is the growth of the sea ice around Antarctica, as illustrated by the CryosphereToday image on the left.

Melting takes place both in the Arctic and on Antarctica, but more so in the Arctic. Recent research of CryoSat-2 data reveals that Greenland alone is now losing about 375 cubic kilometers of ice annually, while in Antarctica the annual volume loss now is about 125 cubic kilometers.

Currents also distribute ocean heat in ways that make the Arctic warm up more than twice as rapidly as the Antarctic. In a recent paper, John Marshall et al. further suggest that ozone depletion also contributes to this.

All this makes that, while the jet streams on the northern hemisphere are circumnavigating the globe at a slower pace, jet streams on the southern hemisphere are getting stronger, making it more difficult for warm air to enter the atmosphere over Antarctica, while the stronger winds also speed up sea currents on the southern hemisphere. This makes the sea ice around Antarctica grow, and as the sea ice spreads further away from Antarctica, temperatures of surface waters around Antarctica are falling.

Growth of the sea ice around Antarctica makes that more sunlight is reflected back into space. There now is some 1.5 million square kilometers more sea ice around Antarctica than there used to be. The albedo change associated with sea ice growth on the southern hemisphere can be estimated at 1.7 W/sq m, i.e. more than the total RF of all CO2 emission caused by people from 1750 to 2011 (IPCC AR5).


The rapid growth of sea ice on the southern hemisphere alone goes a long way to explain why, over the past three months, surface air temperatures have not been much higher than they used to be, both globally and in the Arctic, as illustrated by above NOAA image. What has also contributed to warmer temperatures around latitude 60 on the northern hemisphere is the fact that methane has accumulated in the atmosphere at that latitude, as discussed in earlier posts.

Arctic SST far exceed anything ever seen in human history
So, does the sea ice on the southern hemisphere constitute a negative feedback that could hold back global warming? It doesn't.

It may temporarily keep surface temperatures close to what they used to be, as the sea ice reflects lots of sunlight back into space, but at the same time ocean temperatures are rising strongly, as the sea ice also prevents heat from radiating out of the waters around Antarctica.

The latter also helps explaining the colder surface temperatures over those waters.

Much of this additional ocean heat has meanwhile been transported by the great ocean conveyor belt to the northern hemisphere.

No time before in human history has such a huge amount of ocean heat accumulated in the North Atlantic and the North Pacific. This heat is now threatening to invade the Arctic Ocean and trigger huge temperature rises due to methane eruptions from the seafloor.


The situation is dire and calls for comprehensive and effective action, as dicussed at the Climate Plan blog.