STAR (Satellite Transmission, Arctic Methane Remission) – HAARP PROJECT
By Malcolm P.R. Light
March 1, 2021
Introduction
 |
| Poster 1. [larger size - source] |
 |
| Poster 2. [larger size] |
Subsea Arctic Methane produced at the surface diffuses upward and is broken down by photo dissociation (sunlight) and chemical attack by nascent oxygen and hydroxyl (Heicklen, 1967). The Lucy Project is a radio/laser system for destroying the first hydrogen bond in atmospheric methane, when it forms dangerously thick global warming clouds over the Arctic (Figure 5, 6 and 7)(Light & Carana, 2012).
 |
| Table 1. and 2. [larger size] |
It generates similar gas products to those normally produced by the natural destruction of methane in the atmosphere over some 15 to 20 years. Radio frequencies are used in generating nano-diamonds from methane gas in commercial applications over the entire pressure range of the atmosphere up to 50 km altitude (Light and Carana, 2012). The methane molecule requires 435 kilo - joules per mole to dislodge the first hydrogen proton and an average of 409.3 kilo - joules per mole for the other three protons (Hutchinson, 2014). Hydroxyl requires 493 kilo-joules per mole to generate it from water (Hutchinson, 2014).
Recent experiments have shown that when a test tube of seawater is illuminated by a polarized 13.56 MHZ radio beam, that flammable gases (nascent hydrogen and hydroxyls) were released at the top of the tube (iopscience.iop.org, 2013). In the Arctic Ocean, polarized 13.56 MHZ radio waves will decompose atmospheric humidity, mist, fog, ocean spray and the surface of the waves themselves into nascent hydrogen and hydroxyl over the region where a massive methane torch (plume) is entering the atmosphere, so that the additional hydroxyl produced will react with the rising methane, breaking a large part of it down (iopscience.iop.org, 2013).
The Upper Atmosphere
The following discussion deals mainly with lower part of the Upper Atmosphere or Thermosphere between 50 km to 400 km altitude although the importance of the exponentially growing Arctic Atmospheric Methane Global Warming Veil in the Troposphere (0–10 km height) is also emphasized (NIWA, 2021). The Troposphere is overlain by the Stratosphere (10–30 km altitude) and the Mesosphere between 30 and 50 km height (NIWA, 2021).
The normal chemistry of the atmosphere is controlled by the absorption of the sun’s radiation which results in the photo - dissociation of many molecules, but in particular oxygen (O₂) and methane (CH4)(Heicklen, 1976). The reactive fragments produced, react further forming a whole series of different species that have been observed in the atmosphere (Heicklen, 1976).
Heicklen (1976) states that at the surface of the Earth, only wavelengths greater than 3400 Angstroms (less than 8.8174*10^14 Hertz ) are not strongly absorbed by the atmosphere (Figures 1 to 4, Tables 1 to 5). Below an altitude of 160 km, the absorption of the sun’s radiation by O₂ and O3 largely controls the chemistry of the atmosphere. Nitrogen (N₂) absorbs most of the radiation with wavelengths of less than 1000 Angstroms (frequencies greater than 3*10^15 Hertz) at heights above 110 km. Oxygen photo - dissociation reactions are shown in detail in Tables 1 and 2 which are modified from Tables 1-5 and 1-6, in Heicklen, 1976. Photo-dissociation reactions for oxygen, methane and other species are shown on Tables 3 and 4 from Heicklen, 1976.
The photo-dissociation of oxygen (O₂), when the sun’s radiation is sufficiently energetic (i.e wavelengths less than 1750 Angstroms, frequencies greater than 1.7131*10^15 Hertz) results in the formation of an electrically excited O (¹D) atom and the ground state O(³P) atom (Heicklen, 1976). Oxygen photo–dissociates at unit efficiency in the Schumann–Runge continuum over a wavelength range from 1400 Angstroms (frequency = 2.1414*10^15 Hertz) to 1740 Angstroms (frequency = 1.7229*10^15 Hertz) (Heicklen, 1976).
O₂ + h*frequency(Schumann–Runge continuum) = O(¹D) + O(³P)
h = Planck’s Constant
Oxygen (O₂) photo dissociation in the Schumann–Runge continuum gives a photo dissociation coefficient J(O₂) of 3.7*10^-6 sec-1 at the top of the atmosphere above 120 km altitude, for an overhead sun (Nicolet, 1971 in Heicklen, 1978).
The sun’s radiation is much weaker at wavelengths less than 1400 Angstroms (Schumann–Runge continuum) and little Oxygen (O₂) photo dissociation occurs except for the Lyman–a line, at a wavelength of 1215.7 Angstroms (frequency = 2.4660*10^15 Hertz), the energy of which extends down to a level of 65 km altitude (Heicklen, 1976).
A comparison of the frequency bands for the 13.56 MHz Methane Destruction Frequency, Microwave Ovens and the various Airglo Bands is shown in Table 5 (from Dolezalek in Lide and Frederickse, 1995). Although the Methane Destruction Frequency of 13.56 MHz is in the High frequency (3*10^6 – 3*10^ 7 Hertz)(Decameter Waves), ITU Band Number 7, it is some 67.6 to 180.7 times lower in frequency than microwave oven frequencies which lie in the Ultra High Frequency (3*10^8 – 3*10^9 Hertz)(ITU Band No. 9)(Decimeter waves)(Chaplin, 2020, Wales 2020). Normal domestic microwave ovens have a frequency of 2.45*10^9 Hertz while commercial ovens have slightly lower frequencies of 9.15*10^8 Hertz (Chaplin, 2020; Wales, 2020).
Above 88 km the Even Integer Multiple of the Methane Destruction Frequency = 2*10^8*13.56*10^6 Hertz = 2.712*10^15 Hertz has a wavelength of 1105.43 Angstroms = 110.543 nm and is a major methane destruction photo–dissociation energy event (Figures 1, 2 and 4). The altitude of the base of the Even Integer Multiple of the Methane Destruction Frequency is fixed at 88 km using the 65 km base given for the Lyman–a line (1215.7 Angstroms) and the 110 km base for Nitrogen (N₂) absorption of wavelengths shorter than 1000 Angstroms (Heicklen , 1976).
The methane photo-dissociation coefficient continues to reduce with decreasing altitude so that at by 70 km height, the methane photo-dissociation coefficient (J(CH₄)) is 5.3*10^-7 (sec-1) while the oxygen (O₂) photo-dissociation coefficient has sharply fallen to 2*10^-10 (sec-1) for the Schumann–Runge continuum (SRC)(Heicklen, 1976, Tables 1,2 and 4). Methane here photo-dissociates 2650 times as easily as oxygen (O₂) and 662.5 times as much as the oxygen (O₂) molecule for the complete conversion of the methane to nano-diamonds and hydrogen.
Figure References
Figure 3. Concentration increase of Arctic Methane Global Warming Veil between 2013 and 2050. Calculated from IASI MetOp methane data by Sam Carana, 2014.
https://arctic-news.blogspot.com/2014/06/arctic-atmospheric-methane-global-warming-veil.html
References
ACS 2013. Thermal Energy in the Ocean. ACS Climate Science toolkit/Oceans, Ice and Rocks.
http://www.acs.org/content/acs/en/climatescience/oceanicerocks/thermalenergy.html
Allen P.A., and Allen J.R. 1990. Basin Analysis, Principles and Applications. Blackwell Scientific Publications, Oxford. 451 pp.
Anderson D.L., 1989. Theory of the Earth. Blackwell Scientific Publications. Boston 1- 366 pp.
Anderson D.L., Minster B.J., and Cole D., 1974. The Effect of Oriented Cracks on Seismic Velocities. J. Geophys. Res. 79, 4011 - 4015.
Anderson D.L. and Whitcomb J. 1973. The dilatancy - diffusion model of earthquake prediction. In: Proceedings of the Conference on Tectonic Problems of the San Andreas Fault System.(A.M. Nur. ed.) 417 - 426. Stanford U. Publ. Geol. Sci. 13.
Ashton, A., 2001. Harmonograph. A visual guide to the mathematics of music. Wooden Books, Glastonbwy, 58 pp.
Baile L. W. and Braille S.W. 2002. Journey to the Centre of the Earth.
http://web.ics.purdu.ed/~braile/edumod/journey/journey.htm
Baker J.A., MacPherson C.G., Menzies M.A., Thirwall M.F., Al-Kadasi M., Mattey D.P., 1999. Resolving Crustal and Mantle Contributions to Continental Flood Volcanics in Yemen. Constraints from Mineral Oxygen Isotope Data. Jour. of Petrology, Vol 41, Issue 12, pp. 1805 - 1820
Balmaseda M.A., Trenberth K.E., Källén E., 2013. Distinctive climate signals in reanalysis of global ocean heat content. Geophysical Research Letters, Vol. 40, Issue 9, 1754 - 1759.
Boudon V. 2012. Spectroscopy of Methane. Molecular Spectroscopy and Applications. Department of Optics and Matter-Radiation Interaction. Institut Camat de Bourgogne (ICB). UMR5209 CNRS-Universite de Bourgogne, Dijon, France.
 |
| Table 3. [larger size] |
The normal chemistry of the atmosphere is controlled by the absorption of the sun’s radiation which results in the photo - dissociation of many molecules, but in particular oxygen (O₂) and methane (CH4)(Heicklen, 1976). The reactive fragments produced, react further forming a whole series of different species that have been observed in the atmosphere (Heicklen, 1976).
 |
| Table 4. [larger size] |
 |
| Table 5. [larger size] |
O₂ + h*frequency(Schumann–Runge continuum) = O(¹D) + O(³P)
h = Planck’s Constant
Oxygen (O₂) photo dissociation in the Schumann–Runge continuum gives a photo dissociation coefficient J(O₂) of 3.7*10^-6 sec-1 at the top of the atmosphere above 120 km altitude, for an overhead sun (Nicolet, 1971 in Heicklen, 1978).
 |
| Figure 1. The Clear Relationship Between the High Methane Photodissociation Layer, 70-100 km Altitude, a Central 7 km thick Ice Layer at the top of which is an Even Integer Multiple of the Methane Destruction Frequency = 2*10^8*13.56 MH = 2.712*10^15 = Wavelength 1105.43 Angstroms. Photodissociation of Methane Produces Nano- Diamonds that form the Nuclei of the Underlying Noctilucent Clouds. Photodissociation Coefficients between O₂ and Methane in the 70-120 km region are for an Overhead Sun. The Contribution to the Total J(O₂) by the Schumann-Runge Continuum (SRC), The Schumann-Runge Bands (SRB), the Lyman-a Line (Ly-a) and the Herberg Continuum (Her) is from Heicklen (1976) after Nicolet (1971). Other data modified directly from Heiklen (1976). [larger size image] |
Atmospheric Methane and Nitrogen
Methane (CH₄) and N₂0 are formed at the Earth's surface and diffuse upwards until they reach an altitude above which removal reaction processes predominate (Heicklen, 1976). Water (H₂O) and methane (CH₄) used to have a fairly constant concentration up to a considerable height, after which they decreased with increasing altitude (Heicklen, 1976). Four and a half decades ago the atmospheric methane concentration averaged about 1.4 ppm (1400 ppb) up to 15 km altitude and then fell to less then 0.4 ppm (400 ppb) up to a height of about 50 km (Heicklen, 1976).
Methane (CH₄) and N₂0 are formed at the Earth's surface and diffuse upwards until they reach an altitude above which removal reaction processes predominate (Heicklen, 1976). Water (H₂O) and methane (CH₄) used to have a fairly constant concentration up to a considerable height, after which they decreased with increasing altitude (Heicklen, 1976). Four and a half decades ago the atmospheric methane concentration averaged about 1.4 ppm (1400 ppb) up to 15 km altitude and then fell to less then 0.4 ppm (400 ppb) up to a height of about 50 km (Heicklen, 1976).
Marked photo–dissociation of methane (CH₄) to CH₃ + H occurs in the Thermosphere between 70 km and 100 km altitude (mean height 85 km)(see Table 11-1, Heicklen 1976). The 85–86 km level also represents the top of Noctilucent Cloud formation (Phillips, 2008). Hence it is very likely that the more photo-reactive methane (CH₄) breaks down entirely to a nano-diamond and 4 hydrogen atoms, which can then combine with free oxygen to form water ice. The close relationship with the top of the Noctilucent Clouds and the mean level of methane photo dissociation at 85–86 km suggests that the nano-diamonds may form the nuclei of the Noctilucent Clouds.
Over the height range of 10 km to 80 km, N₂O photo dissociation to N₂ + O(¹D) extends to wavelengths of 3150 Angstroms (frequency = 9.5172*10^14 Hertz), but most photo dissociation in the Upper Stratosphere occurs at wavelengths less than 2500 Angstroms (i.e. more than a frequency = 1.1992*10^15 Hertz)(Heicklen, 1996).
Over the height range 10 km to 60 km, CH₂O photo dissociates to either H₂ + CO or H + HCO in the wavelength interval of 2900 Angstroms (frequency = 1.0338*10^15 Hertz) to 3600 Angstroms (frequency = 8.3276*10^14 Hertz)(Calvert, 1972 in Heicklen, 1996).
The Safety Factors of Transmitting the Methane Destruction Frequency through the Atmosphere To Produce Abundant Nano-Diamonds
Nano-diamonds have been shown to be non-toxic to the human body and are used as pharmaceutical carriers in the blood stream to transfer vital medicines to diseased parts of the body (Zhu et al. 2012). Nano–diamonds are strongly absorbed by cells in the body, have good biocompatibility and are used widely in biomedical applications (Zhu et al. 2012). Nano–diamonds are now used for high efficiency, low toxicity drug delivery systems which target the diseased parts of the body releasing the drugs slowly (Zhu et al. 2012). Radiofrequency identification (RFID) technology of stored red blood cells using the Methane Destruction Frequency (13.56 MHz), over 49 days was also shown to have no known biological effects on the quality of the red blood cells (Kozma et el. 2011).
 |
| Figure 2. Oxygen, Methane and Nitrogen Absorption and Dissociation Coefficients from beloow 60 km to Atmosphere above 120 km height. A 30 km thick high Dissociation Coefficient Methane Layer occurs between 70 and 100 km associated in its lower half with Noctilucent couds that originally occurred between 76 km and 85 km but now due to Global Warming extend down to a height of 50 km. In the centre of the Methane Layer is aa 7 km thick Ice Layer between 82 km and 89 km with particles som 100 nm across that has near the top (88 km) a Major Oxygen and Methane Dissociation Peak which eaxctly respresents an Even Numerical Mulltiple of the Methane Destruction Frequency = 2.712*10^10^15 Hertz = 1105.43 Anstroms. The disociation of the Methane and Oxygen produces one Nano-diamond and two water ice crystals by the following reaction. CH₄ + h*Even Numerical Multiple Methane Destruction Frequency + O₂ + h*frequency (Schumann-Runge Bands) = Nano-diamonds + 2H₂O (Water ice). The High Refractive Index Nano-diamonds fall to form the seeds of the underlying Noctilucent Clouds. Detailed Photo dissociation data from Heicklen (1976). Absorption coefficiewnts from Watananbe et al. (1963). Noctiluecent Cloud data from Phillips (2008), Simonds (2008), and ScienDaliy (2014). [larger size image] |
It will be shown that the Sun’s total photo dissociation of methane in the Lower Thermosphere (70 km to 100 km) interval forms nano–diamonds, which then settle or diffuse downward to form the nuclei of the Noctilucent Clouds (Figures 1, 2 and 4). These Noctilucent Clouds help reflect the sun’s energy back into space and thus help reverse the massive global warming effect of the build up methane in the atmosphere. The purpose of the Star–Haarp Project is to irradiate the high Thermosphere methane clouds between 70 km and 100 km high with the methane destruction frequency (13.56 MHz) producing abundant nano-diamonds that can then seed the now fast thickening of the Noctilucent clouds which will then blanket the Earth from the sun’s radiation and sharply reduce global warming (Figures 1, 2 and 4). In the same way the Lucy–Alamo Projects will radiate the fast growing Tropospheric (less than 10 km high) Arctic Atmospheric Methane Global Warming Veil with the Methane Destruction Frequency (13.56 MHz) generating nano-diamonds to form the seeds or nuclei of low level clouds. These Tropospheric–Statospheric clouds will progressively thicken upwards until they amalgamate with the base of the Noctilucent Clouds which are now at about 50 km height (Figure 4).
 |
| Figure 3. Concentration increase of Arctic Methane Global Warming Veil between 2013 and 2050 showing 8 degrees C and Permian major extinction zones from IASI MetOp methane data from Carana 2014. Extinction lines from Light 2014. [larger size] |
 |
| Figure 4. Synergetic Satellite and Surface-based Projects (STAR - HAARP and LUCY - ALAMO) that will effectively prevent the Expanding Arctic Atmopheric Methane Global Warming Veil from inducing a Terminal Global Extinction Event within a Decade. Data: Heiklen (1976), Phillips (2008), Simonds (2008), Carana (2014), Light (2014), Science Daily (2014), NIWA (2021). [larger size] |
Airglo
When radiation from the sun is absorbed by an atmospheric molecule, but it is of insufficient energy to cause the particle to photo - dissociate, then a bound, excited electronic state will be produced (Tables 1, 2 and 3 from Heicklen, 1976). These electronic excited states can also be produced from the recombination of the photo - dissociated fragments (Heicklen, 1976). Nitrogen (N₂), Oxygen (O₂) and NO are the most important diatomic molecules in the atmosphere (Table 3). Each of these molecules has many energy levels and they can radiate light in the atmosphere causing Airglo (Heicklen, 1976).
Airglo is generated by less energy than is required for photo-dissociation and consequently the photo-disassociation frequencies have to be higher than those necessary to cause Airglo (Table 3 from Heicklen, 1976). Consequently they will be even further removed to higher frequencies than the Airglo frequencies (1.5*10^14 to 1.66*10^16 Hertz) which lie within the three 3*10^13 to 3*10^16 Bands and include part of the Micrometer and Infra–Red waves, Near Infra Red, Visible Light and Near Ultra Violet and Vacuum Ultraviolet rays (Table 5, Lide and Frederickse, 1995, Heicklen, 1976).
The energy necessary to dissociate Oxygen (O₂), NO-O, HO (Meinel bands), Na D(Doublet) and N (1), between 40 and 100 km altitude in the atmosphere is greater than the Airglo frequencies, which are some 11 million to 1.224 billion times higher in frequency than the Methane Destruction Frequency of 13.56*10^6 Hertz (Tables 3,4 and 5). Consequently the chances of the 13.56 MHz Methane Destruction Frequency generating any hazardous chemicals in the atmosphere is very low to zero.
Oxygen and Methane Photo - Dissociation and Nitrogen Energy Absorption in the Thermosphere
 |
| Figure 5. Enhanced Lucy Transmission System [larger size] |
Above 120 Km altitude, in the upper atmosphere (Thermosphere), the intensity for an overhead sun gives an oxygen, J(O₂) Photo-dissociation coefficient of 3.7*10^-6 (sec-1) for the Schumann–Runge Continuum (Nicolet, 1971 in Heicklen, 1976). In the same region, the photo-dissociation of methane (CH₄ to CH₃ + H) gives a photo-dissociation coefficient, J (CH₄) of 6*10^-6 (sec-1) (Heicklen, 1976, Table 4). Consequently methane photo-dissociates 1.62 times as easily as oxygen (O₂) in the atmosphere above 120 km in the Shuman–Runge continuum (Heicklen, 1976, Table 4). Above an altitude of 120 Km, methane is found to photo-dissociate 50 times as easily as oxygen (O₂) in the energy field of the Schumann-Runge bands (SRB)(Heicklen, 1976, Table 4).
At altitudes greater than 110 km in the Thermosphere, nitrogen absorbs all energy (ultra–violet (UV), x–ray, gamma ray and cosmic rays at wavelengths less than 1000 Angstroms (3*10^15 Hertz)(Figures 1, 2 and 4, Table 3)(Heicklen, 1976).
At a lower altitude than 100 km, methane retains its high photo - dissociation coefficient, J(CH₄) as it had in the upper atmosphere of 6*10^-6 (sec-1), but the oxygen photo dissociation coefficient, J (O₂) is here reduced to 1.2*10^-6 for the Schumann–Runge continuum (Heicklen, 1976, Tables 1, 2 and 4). Hence at an altitude of 100 km methane now photo-dissociates 5 times more easily than oxygen (O₂), and this atmospheric level is at the top of a 30 km thick cloud of methane, which is very photo-reactive (Heicklen, 1976). Consequently by the time the sun’s radiation has penetrated down to 100 km altitude, for every oxygen (O₂) molecule that photo-dissociates, 5 hydrogen atoms will be removed from methane molecules. Thus some of the methane molecules will we entirely photo-dissociated to a nano-diamond (C) and four hydrogen atoms. Two water molecules will then form from four released methane hydrogens as they combine with two photo - dissociated oxygen (O₁) atoms. Additional free hydrogen will also be produced by partial photo–dissociation of some of the methane.
 |
| Figure 6. [larger size] |
Methane photo-dissociation continues to be enhanced compared to oxygen with decreasing altitude within the methane cloud between 100 km and 70 km altitude. At 90 km height, the methane photo-dissociation coefficient J(CH₄) = 5*10^-6 (sec-1), which is 294.112 times larger than the oxygen J(O₂) photo dissociation coefficient = 1.7*10^-8 (sec-1) (Heicklen, 1976, Tables 1, 2 and 4). If we divide this large number by 4 to take account of the photo-dissociation of all four hydrogen atoms in the methane molecule, the ratio of photo-dissociation coefficient of methane molecules (CH₄) to oxygen (O₂) molecules is 73.528 at 100 km altitude. This means that a large number of nano-diamonds are formed in the region between 100 km and 90 km altitude in the thermosphere and are then able to settle or diffuse their way downward, where they most likely form the seeds or nuclei of the Noctilucent Clouds that now develop below 86 km altitude (Simonds, 2008).
 |
| Figure 7. [larger size] |
At the 88 km level in the Thermosphere, in the central zone of the highly photo-reactive methane cloud, the ratio of the methane photo-dissociation coefficient to the oxygen (O₂)(Schumann–Runge continuum) photo-dissociation coefficient is about 555.3. Therefore total photo-dissociation of all four hydrogen atoms from the methane molecule should therefore occur 138.8 times more frequently than the photo dissociation of oxygen (O₂) by the energy of the Schumann–Runge continuum (Heicklen, 1976, Tables 1,2 and 4). The photo dissociation reaction can be represented as below where h = Planck’s Constant:
(CH₄) + h*f (Schumann–Runge continuum) + O₂ + h*f (Schumann–Runge continuum) = nano-diamond (C) + 2*(H₂O)
At 88 km level for oxygen (O₂) photo-dissociaton from energy of the Schumann–Runge bands, the ratio of the methane photo-dissocation to oxygen photo-dissociation is 164, so that on average 41 methane molecules are totally converted into nano-diamonds for each oxygen (O₂) molecule photo-dissociated (Heicklen, 1976, Tables 1, 2 and 3). This photo-dissociation reaction can be represented as below with h = Planck’s Constant:
(CH₄) + h*f (Schumann–Runge bands) + O₂ + h*f (Schumann–Runge bands) = nano-diamond (C) + 2*(H₂O)
At an altitude of 80 km, the photo-dissociation coefficient of methane (J(CH₄)) has decreased to 3.2*10^-6 (sec-1) but the photo-dissociation coefficient of oxygen (J(O₂)) has sharply fallen to 2.0*10^-9 (sec-1) (Heicklen, 1976, Tables 1, 2 and 4). Thus at a height of 80 km, the methane photo-dissocation occurs 1600 times more easily than oxygen (O₂) photo-dissociation in the Schumann–Runge continuum (SRC) and consequently there are about 400 nano-diamonds generated for every oxygen (O₂) molecule that photo-dissociates.
 |
| Figure 8. Inclusion in European Central Bank strategy review [larger size] |
Consequently throughout the entire 30 km altitude range in the photo-reactive methane cloud in the Thermosphere, methane has a very high total photo-dissociation coefficient ranging from 662.5 times that of oxygen at 70 km height to 1.2 that of oxygen at 100 km height. During these photo-dissociation processes, nano-diamonds (C), and water ice (H₂0) are produced in large quantities. The nano-diamonds probably settle or diffuse downward to form the seeds of nuclei of the Noctilucent clouds (86 km to 50 km height), while the water accumulates in the ice layer which has been found to develop between 82 km and 89 km height (Heicklen, 1976, Tables 1,2 and 4). The unusual colours (colourless to light blue) shown by the Noctilucent clouds may result from the high refractive index (2.42) and strong light dispersion of the nano-diamond nuclei of the Noctilucent Cloud particles (Hurlbut, 1959, Thormahlen, Straub and Grigul, 1985).
Noctilucent (“Night–Shining”) Clouds
Noctilucent Clouds require very cold temperatures, dust and water vapour to form high in the Thermosphere (Science Daily, 2014) and they are made up of tiny ice particles around 100 nm, (1000 Angstroms) in diameter (Phillips, 2008, Wales 2020). Noctilucent Clouds were found initially between 76 km and 85 km in height and to be spatially related to the centre zone of the ice layer at an altitude of 82 km and 89 km (Heicklen, 1976, Phillips 2008, Science Daily, 2014).
It has been proposed that the moisture for the Noctilucent Clouds may be lifted through gaps in the Tropopause as well as forming from the reaction of methane with hydroxyl radicals in the Stratosphere (NLC’s 2014).
There is uncertainty about the origin of the dust that forms the nuclei of Noctilucent Cloud, water /ice droplets that originally formed at altitudes of 76 km to 85 km in the Thermosphere and it was assumed to be meteoric dust, volcanic or tropospheric dust (Phillips, 2008, Simonds, 2008, Science Daily, 2014, Heicklen 1976).
Originally Noctilucent Clouds were detected between 76 km and 86 km altitude in the Thermosphere, but over two decades of global warming the base of the “Night Shining” clouds has fallen to 50 km altitude at the base of the Thermosphere while the top has risen to 86 km (Simonds, 2008). This is an increase of 4 times in cloud depth (9 km to 36 km)(Simonds, 2008). Noctilucent Cloud behaviour became even more mysterious over the last two decades of Global Warming because they began to shine more brightly as their base progressively extended downwards from 76 km to 50 km altitude (O’Carrol, 2007, O’Carrol and Steigerwald, 2007; NASA Earth Observatory, 2008).
As the major Global Warming component in the Arctic is the exponentially growing Arctic Atmospheric Methane Global Warming veil which has a global warming potential, 10 to 1000 times that of carbon dioxide, the growth of the Arctic methane cloud is clearly directly linked to the thickening processes of the Noctilucent Cloud at high altitudes as the methane rises upward into the Thermosphere.
According to Heicklen (1976) there is an ice particle layer in the atmosphere between 82 km and 89 km in the Thermosphere which has a mean altitude of 85.5 km. This mean height of the ice layer corresponds almost exactly with the top of the Noctilucent Clouds which has risen from 85 km to 86 km over two decades due to Global Warming (Simonds, 2008). Quite clearly the formation of the ice layer and the top of Noctilucent clouds are closely related to the 70 km to 100 km altitude, high photo dissociation coefficient methane cloud, which they lie in the middle of (Figure 1, 2 and 4) and to low altitude methane cloud induced Global Warming.
Crystal Size Relationships in the Noctilucent Clouds
One molecule of cubic (octahedral) diamond, has a volume of 45.355*10^-30 cubic metres (a = 3.567 Angstroms) (Lide and Frederickse, 1995). One hexagonal molecule of water ice has a volume of 130.41*10^-30 cubic metres (a = 4.5212 Angstroms, c = 7.366 Angstroms) (Lide and Frederickse, 1995).
The size of the particles that make up the Noctilucent Cloud layer, that originally lay between 76 km and 85 km altitude (now 50 km to 86 km high), are estimated at less than 100 nm across (i.e. about 1000 Angstroms in width)(Phillips, 2008). The ice particle size seems consistent with them collecting in bunches whose volume is approximately the multiple of the Methane Destruction Frequency (13.56 MHz = 13.56*10^6 Hertz) times the hexagonal molecular volume of ice = 130.41*10-30 cubic metres (Lide and Frederickse, 1995). The ice particle volume determined here is 1.7683596*10^-21 cubic metres. The volume of a hexagonal tube of side h and of length 2h is 10.39230485*h^3. Consequently we can determine 2h (the width) of a hexagonal bunch of molecular ice crystals of number 13.56*10^6 which is 1108.280175*10^-10 metres = 1108.28 Angstroms = 110.828 nm. This is slightly larger than the less than 100 nm size of ice particles estimated for the Noctilucent Clouds between 86 km and 50 km altitude (Phillips, 2008). It is however remarkably close to the wavelength of the Even Integer Multiple of the Methane Destruction Frequency above 88 km altitude, which equals 2*10^8*13.56*10^6 Hz = 2.712*10^15 Hertz. The calculated wavelength of the Even Integer Multiple of the Methane Destruction frequency = 1105.429417 Angstroms = 110.543 nm.
We can therefore assume that the particles forming the Noctilucent Clouds, each represent a physical manifestation of the 13.56 MHz Methane Destruction Frequency as well as the wavelength of the 88 km, Even Integer Multiple of the Methane Destruction Frequency (1105.43 Angstroms).
This clearly implies that the size of the particles in the Noctilucent Clouds, the top of which lie at some 86 km height, is directly related to the release of hydrogen from the photo-dissociation of methane in the centre of the high photo-dissociation methane layer between 70 km and 100 km altitude. This methane photo–dissociation is caused by the action of the Even Integer Multiple of the Methane Destruction Frequency (2.712*10^15 Hertz) above 88 km and the energy from the Schumann-Runge continuum and bands between 88 km and 70 km height (Figures 1, 2 and 4).
For pure diamond particles constructed by multiplying the Methane Destruction Frequency by the diamond molecule volume (Lide and Frederickse, 1995), the calculated width is 850.5973 Angstroms for a cube and 1055.3669 Angstroms for a sphere giving a mean of 952.9671 Angstroms = 95.29671 nm, similar to the less than 100 nm width estimated for the particles in Noctilucent Clouds (Phillips, 2008).
Conclusions
The most unfortunate circumstances have led me to become the Planet Earth’s undertaker and the Earth’s near-time future looks rather like a giant hole in the ground on Figure 3. It is by all accounts going to become a giant boiling cloud of stardust, following the ancient adage “Ashes to Ashes and Dust to Dust” directly resulting from our total incineration, as a result of the fiery heating of the atmosphere, by the exponentially growing, terminally catastrophic Arctic Atmospheric Methane Global Warming Veil (Light 2014, Carana 2014).
Our last remaining hope as this Arctic Atmospheric Methane Global Warming Veil expands uncontrollably, is to use the Synergetic Satellite and Surface based Atmospheric Methane Destruction Projects (Star–Haarp) and (Lucy–Alamo), to simultaneously destroy the growing Tropospheric and Thermospheric Methane clouds to nano-diamonds and hydrogen with the already well-tested 13.56 MHz methane destruction frequency, which is of such a large wavelength (22.11 metres) that it should have negligible side effects (Table 5, Refs). Not only will this process eliminate the high global warming potential Methane (10 to 1000 times the Global Warming Potential of carbon dioxide (Carana2014)), but will produce nano-diamond seeds that can form the nuclei of water droplets in Noctilucent and Tropospheric clouds which will then blanket the Earth from the sun’s radiation and produce a sharp cooling at the Earth’s surface. We have in this method two atmospheric cooling processes for the price of one.
Simultaneously with the Star–Haarp and Lucy–Alamo Projects, all International major oil and gas corporations should work with Russia, on a war footing extracting methane from the subsea Arctic methane hydrates in the Laptev Sea and East Siberian Arctic Shelf (Angels Project) to totally eliminate the subsea methane hydrate-rich region as a future threat to our Planet during the lives of our children and grandchildren (see enclosed DVD on the Star–Haarp, Lucy–Alamo and Angels Projects).
Mother Nature has given you a simple choice this decade between becoming Planet Earth’s Guardian Angel, or Terminal Global Extinction Stardust. I know what future I would choose.
Acknowledgements
I gratefully thank my wife Valerie for her immense assistance in completing this work in a very short space of time.
Qualifications
Although my degrees are in geology, my parents were both meteorologists in the Royal Air Force. In 1959 at high school I made a moving average rainfall graph, using the 11 year solar cycle and the disastrous effects of global warming were immediately apparent. At the University of Cape Town besides geology, I also studied oceanography, physics, chemistry, mathematics and statistics. I have a Phd. From the University of London. My 20 years experience in oil and high pressure gas exploration qualified me to work at CPOM (Centre for Polar observation and Modeling) at the University of London on the threat of the Arctic subsea methane hydrates. It is 20 years since my first publication on the extreme threat posed by the subsea Arctic methane hydrates. I am a member the Arctic Methane Emergency Group and have subsequently published in Sam Carana’s Arctic News.
Figure References
Figure 3. Concentration increase of Arctic Methane Global Warming Veil between 2013 and 2050. Calculated from IASI MetOp methane data by Sam Carana, 2014.
https://arctic-news.blogspot.com/2014/06/arctic-atmospheric-methane-global-warming-veil.html
References
ACS 2013. Thermal Energy in the Ocean. ACS Climate Science toolkit/Oceans, Ice and Rocks.
http://www.acs.org/content/acs/en/climatescience/oceanicerocks/thermalenergy.html
Allen P.A., and Allen J.R. 1990. Basin Analysis, Principles and Applications. Blackwell Scientific Publications, Oxford. 451 pp.
Anderson D.L., 1989. Theory of the Earth. Blackwell Scientific Publications. Boston 1- 366 pp.
Anderson D.L., Minster B.J., and Cole D., 1974. The Effect of Oriented Cracks on Seismic Velocities. J. Geophys. Res. 79, 4011 - 4015.
Anderson D.L. and Whitcomb J. 1973. The dilatancy - diffusion model of earthquake prediction. In: Proceedings of the Conference on Tectonic Problems of the San Andreas Fault System.(A.M. Nur. ed.) 417 - 426. Stanford U. Publ. Geol. Sci. 13.
Ashton, A., 2001. Harmonograph. A visual guide to the mathematics of music. Wooden Books, Glastonbwy, 58 pp.
Baile L. W. and Braille S.W. 2002. Journey to the Centre of the Earth.
http://web.ics.purdu.ed/~braile/edumod/journey/journey.htm
Baker J.A., MacPherson C.G., Menzies M.A., Thirwall M.F., Al-Kadasi M., Mattey D.P., 1999. Resolving Crustal and Mantle Contributions to Continental Flood Volcanics in Yemen. Constraints from Mineral Oxygen Isotope Data. Jour. of Petrology, Vol 41, Issue 12, pp. 1805 - 1820
Balmaseda M.A., Trenberth K.E., Källén E., 2013. Distinctive climate signals in reanalysis of global ocean heat content. Geophysical Research Letters, Vol. 40, Issue 9, 1754 - 1759.
Boudon V. 2012. Spectroscopy of Methane. Molecular Spectroscopy and Applications. Department of Optics and Matter-Radiation Interaction. Institut Camat de Bourgogne (ICB). UMR5209 CNRS-Universite de Bourgogne, Dijon, France.
http://icb.u-bowgogne.fr/omr/SMA/Methane
Bryden, H.L., 1979. Poleward heat flux and conversion of available potential energy in Drake Passage. J. Marine Res., 37, 1 - 22.
Bunker A.F. 1976. Computations of Surface Energy Flux and Annual Air-Sea Interaction Cycles of the North Atlantic Ocean. Mon. Wea. Rev. 104, 1122 - 1139.
Bunker A.F. 1988. Surface Energy Fluxes in the South Atlantic Ocean. Mon. Wea. Rev. 116, 809 - 829.
Bunker A.F., and Worthington V., 1976. Energy Exchange Charts of the North Atlantic Ocean. Bull. Amer. Meteor. Soc. 57, 670 - 678.
Cactus 2000; Wavelength. Unit Converters.
http://www.cactus2000.de/uk/unit/massway.shtml
Carana, S. 2011a. Runaway Warming 2011. In: Geo-engineering.
https://geo-engineering.blogspot.com/2011/09/runaway-warming.html
Carana, S. 2011b. Runaway global warming 2011. Knol
http://knol.google.com/k/sam-carana/runaway-global-warming/7y50rvz9924j/64
Carana, S. 201lc. Runaway Global Warming. In: Climate Change the Next Generation. https://climatechangepsychology.blogspot.com/2011/04/sam-carana-runaway-global-warming.html
Carana S., 2011h. Light, M.P.R. and Carana, S. 2011c. Knol - A unit of Knowledge - Methane linked to seismic activity in the Arctic.
http://knol.google.com/k/sam-carana/methane-linked-to-seismic-activity-in/7y50rvz9924j/85?collectionId=7y50rvz9924j.39#
Carana, S. 2011i. Potential for Methane Release. In: Arctic-News.
https://arctic-news.blogspot.com/p/potential-for-methane-release
Carana, S. 2012. Runaway Warming. In: Arctic News
https://arctic-news.blogspot.com/p/runaway-warming.html
Carana, S. 2012. Striking increase of methane in the Arctic. In: Arctic News
https://arctic-news.blogspot.com/2012/05/striking-increase-of-methane-in-arctic.html
Carana S., 2012. The accumulating impact of methane releases in the Arctic and how much time there is left to act.
https://arctic-news.blogspot.com/p/how-much-time-is-there-left-to-act.html
Carana S., 2012. How much time is there left to act? Abrupt release of 1 Gt of methane.
https://arctic-news.blogspot.com/p/how-much-time-is-there-left-to-act.html
Carana S., 2012. Potential for Methane Release.
https://arctic-news.blogspot.com/p/potential-for-methane-release.html
Carana, S. 2012. Arctic News. AMEG at Planet under Pressure Conference.
Intergovernmental Panel on Climate Change (IPCC) 1992b. Climate Change in 1992. The Supplementary report to the IPCC Scientific Assessment (Edited by J. J. Houghton, B. A. Callander and S. K. Varney). Cambridge University Press, Cambridge. U.K.
https://www.ipcc.ch/
Intergovernmental Panel on Climate Change (IPCC) 2007a. Fourth Assessment Report on Climate Change 2007. FAO 3.1, Figure 1, WG1, Chapter 3, p. 253.
http://blogs.ei.colombia.edu/wp-content/uploads/2010/12/graph-2-600X422.jpg
http://www.ipcc.ch/pdf/assessment-report/ar4/wg1/ar4-wg1-chapter3.pdf
Intergovernmental Panel on Climate Change (IPCC) 2007b. Synthesis Report
http://www.ipcc.ch/publications_and_data/ar4/syr/en/spms1.html
Intergovernmental Panel on Climate Change (IPCC) 2007b. Fourth Assessment report on Climate Change 2007 - temperature rise projections.
Light M.P.R. 2014. Interview with Malcolm Light dy Dorsi Diaz, September 10, 2014. Edited by Sam Carana. In Arctic-News.
https://arctic-news.blogspot.com/p/malcolmlight.html
Light M.P.R., Hensel H, Carana S. 2014. Arctic Atmospheric Methane Global Warming Veil
https://arctic-news.blogspot.com/2014/06/arctic-atmospheric-methane-global-warming-veil.html
Light M.P.R. 2013. The Non - Disclosed Extreme Arctic Methane Threat. The 2013 Australian above average temperatures set a record of 0.22°C higher than the 12 month period prior to 2013 and confirm a mid - 21st century atmospheric methane - induced global deglaciation and major extinction event.
https://sites.google.com/site/runawayglobalwarming/the-non-disclosed-extreme-arctic-methane-threat
Light M.P.R. 2012e. Further Confirmation of a Probable Arctic Sea Ice Loss by Late 2015. Edited by Sam Carana. In: Arctic-News.
https://arctic-news.blogspot.com/2012/09/further-confirmation-of-a-probable-arctic-sea-ice-loss-by-late-2015-loss.html
Light M.P.R. 2012c. Angels Proposal - A Proposal for the Prevention of Arctic Methane Induced Catastrophic Global Climate Change by Extraction of Methane from beneath the Permafrost/Arctic Methane Hydrates and its Storage and Sale as a Subsidized "Green Gas" Energy Source. LGS. 49 pp. In: Arctic-News.
https://arctic-news.blogspot.com/2012/05/proposal-to-extract-store-and-sell.html
Light M.P.R., 2012b. How much time is there left to act, before methane hydrate releases will lead to human extinction? Edited by Sam Carana. In: Geo-Engineering.
https://geo-engineering.blogspot.com/2012/02/how-much-time-is-there-left-to-act.html
Light M.P.R. 2012a. Global extinction within one human lifetime as a result of a spreading atmospheric Arctic methane heatwave and surface firestorm. Edited by Sam Carana. In Arctic-News.
Bryden, H.L., 1979. Poleward heat flux and conversion of available potential energy in Drake Passage. J. Marine Res., 37, 1 - 22.
Bunker A.F. 1976. Computations of Surface Energy Flux and Annual Air-Sea Interaction Cycles of the North Atlantic Ocean. Mon. Wea. Rev. 104, 1122 - 1139.
Bunker A.F. 1988. Surface Energy Fluxes in the South Atlantic Ocean. Mon. Wea. Rev. 116, 809 - 829.
Bunker A.F., and Worthington V., 1976. Energy Exchange Charts of the North Atlantic Ocean. Bull. Amer. Meteor. Soc. 57, 670 - 678.
Cactus 2000; Wavelength. Unit Converters.
http://www.cactus2000.de/uk/unit/massway.shtml
Carana, S. 2011a. Runaway Warming 2011. In: Geo-engineering.
https://geo-engineering.blogspot.com/2011/09/runaway-warming.html
Carana, S. 2011b. Runaway global warming 2011. Knol
http://knol.google.com/k/sam-carana/runaway-global-warming/7y50rvz9924j/64
Carana, S. 201lc. Runaway Global Warming. In: Climate Change the Next Generation. https://climatechangepsychology.blogspot.com/2011/04/sam-carana-runaway-global-warming.html
Carana S., 2011h. Light, M.P.R. and Carana, S. 2011c. Knol - A unit of Knowledge - Methane linked to seismic activity in the Arctic.
http://knol.google.com/k/sam-carana/methane-linked-to-seismic-activity-in/7y50rvz9924j/85?collectionId=7y50rvz9924j.39#
Carana, S. 2011i. Potential for Methane Release. In: Arctic-News.
https://arctic-news.blogspot.com/p/potential-for-methane-release
Carana, S. 2012. Runaway Warming. In: Arctic News
https://arctic-news.blogspot.com/p/runaway-warming.html
Carana, S. 2012. Striking increase of methane in the Arctic. In: Arctic News
https://arctic-news.blogspot.com/2012/05/striking-increase-of-methane-in-arctic.html
Carana S., 2012. The accumulating impact of methane releases in the Arctic and how much time there is left to act.
https://arctic-news.blogspot.com/p/how-much-time-is-there-left-to-act.html
Carana S., 2012. How much time is there left to act? Abrupt release of 1 Gt of methane.
https://arctic-news.blogspot.com/p/how-much-time-is-there-left-to-act.html
Carana S., 2012. Potential for Methane Release.
https://arctic-news.blogspot.com/p/potential-for-methane-release.html
Carana, S. 2012. Arctic News. AMEG at Planet under Pressure Conference.
https://arctic-news.blogspot.com/2012/03/ameg-at-planet-under-presswe.html
Carana, S. 2012a. Striking increase of methane in the Arctic. In: Arctic News.
Carana, S. 2012a. Striking increase of methane in the Arctic. In: Arctic News.
https://arctic-news.blogspot.com/20l2/05/striking-increase-of-methane-in-arctic.html
Carana, S. 2012b. Record levels of greenhouse gases in the Arctic. Arctic News. Wednesday, May 2, 2012. https://arctic-news.blogspot.com/2012/05/record-levels-of-greenhouse-gases-in.html
Carana S., Oxygenating the Arctic.
Carana, S. 2012b. Record levels of greenhouse gases in the Arctic. Arctic News. Wednesday, May 2, 2012. https://arctic-news.blogspot.com/2012/05/record-levels-of-greenhouse-gases-in.html
Carana S., Oxygenating the Arctic.
https://arctic-news.blogspot.com/p/oxygenating-arctic.html
Carana S., How would you allocate US$ 10 million per year to reduce climate risk?
Carana S., How would you allocate US$ 10 million per year to reduce climate risk?
https://geo-engineering.blogspot.com/2011/04/how-would-you-allocate-us10-million-per.html
Carana S., 2013. Quantifying Arctic Methane.
https://arctic-news.blogspot.com/2013/11/quantifying-arctic-methane.html
Carana S., 2013. Methane - hydrates.
https://methane-hydrates.blogspot.com/2013/04/methane-hydrates.html
Carana S., 2013. Methane up to 2241 ppb at 742 mb on January 23, 2013. In: Carana S., 2013, Dramatic increase in methane in the Arctic in January 2013.
https://arctic-news.blogspot.com/2013/02/dramatic-increase-in-methane-in-the-arctic-in-january-2013.html
Carana S., 2013. Global warming, accelerated warming in the Arctic and runaway global warming. - How much will temperatures rise?.
https://arctic-news.blogspot.com/2013/04/how-much-will-temperatures-rise.html
Carana S., 2013. Methane levels going through the roof.
https://arctic-news.blogspot.com/methane-levels-going-through-the-roof.html
Carana S., 2013. Dramatic increase in methane in the Arctic in January 2013.
https://arctic-news.blogspot.com/dramatic-increase-in-methane-in-the-arctic-in-january-2013.html
Carana S., 2014. Massive methane concentrations over the Laptev Sea.
https://arctic-news.blogspot.com/massive-methane-concentrations-over-the-laptev-sea.html
CDL, 2013. The Oceans, their Physics, Chemistry and General Biology. UC Press E-Books Collection, 1982 - 2004. University of California Press. California Digital Library (CDL)
http://publishing.cdlib.org/ucpressebooks/view?docId=kt167nb66r&chunk.id=d3_5_ch15&toc.id=ch15&toc.depth=1&brand=eschol
Chapelle F.H.; O'Neill K., Bradley P.M., Methe B.A., Clufo S.A., Knobell L.L. and Lovely D.R. 2002. A hydrogen - based subsurface microbial community dominated by methanogens. Nature 415 (6869): 312 - 315. Bibcode: 2002. Nature 415. 312C.doi: 10.1038/415312a. PMID11797006.
Chaplin M., 2012. Water and Microwaves. Water Structure and Science. London South Bank University.
hyperphysics.phy-astr.gsu.edu
Chaplin M., 2020. “Water Structure and Science”. Microwave Ovens. Hyperphysics.
hyperphysics.phy-astr.gsu.edu
Church J.A., White N.J., Konikow L.F., Domingues C.M., Cogley G., Rignot E., Gregory J.M., van den Broeke M.R., Monagham A.J., Velicogna I., 2011. Revisiting the Earth's sea - level and energy budgets from 1961 to 2008. Geophysical Research Letters. Vol. 40, Issue 15, 4066. Article first published online 8 Aug. 2013.
Collett, T.S., 1995. Gas Hydrate Resources of the United States. In Gautier D.L. et al. eds. National assessment of United States oil and gas resources on CD-ROM. U.S. Geological Survey Digital Data Series 30.
Columbia, 2013. Subduction zones.
http://www.columbia.edu/~vjdi/subd_zone_basic.htm
Connor, S. 2011. Shock as retreat of Arctic sea ice releases deadly greenhouse gas. Russian research team astonished after finding fountains of methane bubbling to surface. The Independent.
http://www.independent.co.uk/environment/climate-change/shock-as-retreat-of arctic-sea-ice-releases-deadly-greenhouse-gas-6276134.html
Cook J. 2013. 4 Hiroshima bombs worth of heat per second. In: Skeptical Science.
http://www.skepticalscience.com/4-Hiroshima-bombs-worth-of-heat-per-second.html
Cook M.A., Eying H. and Thomas R.N., 1951. Astrophys. Jour. 113 – 475. “The Physical Theory of Meteors”. L.A. Reaction Rate Approaches to the Rate of Mass Loss in Meteors”. P. 573.
CPOM, 2014. Cryosat finds sharp increase in Antarctica,s ice losses.
http://www.esa.int/OurActivities/Observing_the_Earth/Cryosat/Cryosat_finds_sharp_increase_in_Antarctica_s_ice_losses
Csanady G.T., 2001. Air - Sea Interactions. Laws and Mechanisms. Cambridge University Press. 239 pp.
DATAWeb, 2011. Combined Data Earth Policy Institute.
http://www.earth-policy.org/datacenter/.../update29_5x
http://www.earth-policy.org/datacenter/.../update20_3x
Dawson J.B. 1967. A review of the geology of kimberlite. In: Ultramafic and Related Rocks (Wyllie P.J., ed). Wiley, New York. 269 - 278
Diamond Stability Zone in the Earth. P-T Diagram.
http://geology.gsapubs.org/content/30/10/947/F3expansion.html
Dessus, B., and Laponche B., Herve le Treut, 2008. Global Warming: The Significance of Methane bd-bl-hlt January 2008.
http://www.global-chance.org/IMG/pdf/CH4march2008.pdf
Dziewonski A.M., and Anderson D.L., 1981. Preliminary Reference Earth Model. Phys. Earth Planet. Inter. 25, 297 - 356
Ehret G., 2010. MERLIN: French - German climate satellite to be launched in 2014. Deutches Zentrum fur Luft - und Raumfahrt (DLR), Institut fur Physik der Atmosphare, Lidar Department.
http://www.dir.ge/pa/en/desktopdefault.aspx/tabid-2343/6725_read-26662/
Gapminder, 2012. Yearly Human Carbon Dioxide Emissions
http://www.gapminder.org/world
Gaina C., Medvedev S., Torsvik T.H., Koulakov I., Werner S.C., 2013. 4D Arctic: A Glimpse into the Structure and Evolution of the Arctic. In the light of New Geophysical Maps, Plate Tectonics and Tomographic Models. Surv. Geophys. DOI.10.1007/s10712-013-9254-y. http://earthdynamics.org/papers-ED/2013/2013-Gaina-etal-SurvGeophys.pdf
Garvin, D, and Hampson, R.E., 1974. Nat. Bur. Std. Rep. NBSIR 74 – 430. Chemical Kinetics Data Survey V11. Tables of Rate and Photo Chemical Data for Modelling of the Stratosphere (Revised) pp. 74 – 430.
GEBCO (1979) and IBCAO (2000). Oblique view of the continental shelves of the Eastern Siberian and Laptev Seas.
http://www.ngdc.noaa.gov
Glasby G.P. 2006. Abiogenic origin of hydrocarbons: an historical review. PDF. Reservoir Geol. 56(1) 88 - 96.
Glass J.B. et al. 2013. Geochemical, metagenomic and metaproteomic insights into trace metal utilization by methane - oxidizing microbial consortia in sulfidic marine sediments. Environmental Microbiology 2013.
http://onlinelibrary.wiley.com/doi/10.1111/1162-2920.12314/abstract
Goho A., 2004. Deep Squeeze: Experiments Point to Methane in the Earth's Mantle. Science News.
https://www.sciencenews.org/article/deep-squeeze-experiments-point-methane-earths-mantle.
Greenhow, G. S. and Lovell, A.C.B., 1960. In “Physics of the Upper Atmosphere” (J.A. Ratcliffe, Ed.), Academic Press, New York. The Upper Atmosphere and Meteors” p. 573
Gusev E.A. 2013. The Structure of Gakkel Mid - Ocean Ridge and Laptev Sea Continental Margin Junction.
http://www.evgengusev.narod.ru/gakkel.html
Häkkinen S., and Cavalieri D.J., 1989. A study of oceanic surface heat fluxes in the Greenland, Norwegian and Barents Seas. J. Geophys. Res. 94, 6145 - 6157.
Hansen, J. E. 2011. GISS Surface Temperature Analysis. NASA. Goddard Institute for Space Physics.
http://data.giss.nasa.gov/cgibin/gistemp/do_nmap.py?year_last=2011&month_last=08&sat=4&sst=1&type=anoms&mean_gen=02&year1=2009&year2=2009&base1=1951&base2=1980&radius=1200&pol=pol
Harrison, J.C., St-Onge, M.R., Petrov, O., Streinikov, S., Lopatin, B., Wilson, F., Tella, S., Paul, D., Lyndts, T., Shokalsky, S., Hults, C., Bergman, S., Jepsen, H.F., and Solli, A., 2008. Geological Map of the Arctic, Geological Survey of Canada, Open File 5816, Scale 1:1000 000. 5 sheets.
Heiklen, J. 1976. Atmospheric Chemistry. Academic Press, New York, 406 pp.
Hensel H. pers. com. 2014. Methane Ranges, 26th January, 2014. US Geological Survey, Google Earth.
Höök M., Bardi U., Feng L., Pank X., 2010. Development of oil formation theories and their importance for peak oil. Marine and Petroleum Geology. Volume 27. Issue 9, October 2010, P. 1995 - 2004.
http://www.tsi.u.u.se/uhdsg/Publications/Abiotic_article.pdf
Hovland el al. 2006. Submarine pingoes: Indicators of shallow gas hydrates in a pock - mark at Nyegga, Norwegian Sea. Marine Geology, 228, 15 -23.
http://www.sciencedirect.com/science/article/pii/S0025322705003968
Huebner W.F. (Ed) 1990. Physics and Chemistry of Comets. Springer - Verlag. ISBN978-0-387-51228-0
Hurlbut, C.S., 1959. Dana's Manual of Mineralogy. John Wiley and Sons. New York. pp. 609.
Hutchinson J., 2014. Bond Energies in Polyatomic Molecules. General Chemistry.
http://www.vias.org/geochem/energetics_12592_05.html
Hyperphysics, 2013. Heat of Fusion, Heat of Vaporization.
http://hyperphysics.phy-astr.gsu.ed/hbase/thermo/phase2.html
ICB 2012. Spectroscopy of Methane. Molecular Spectrocopy and Applications. Department of Optics and Matter-Radiation Interaction. Institut Carnat de Bourgogne. UMR5209 CNRS-Universite de Bourgogne, Dijon. France.
http://cb.u-bourgoqne.fr/omr/SMA/Methane
Illingworth V. and Cullerne, J., 2000. The Penguin Dictionary of Physics, 3rd Edition. Market House Books Ltd. Clays Ltd. St Ives, 492 pp.
Intergovernmental Panel on Climate Change (IPCC) 1992a. Climate Change. The IPCC Scientific Assessment (Edited by J. J. Houghton, G. J. Jenkins and J. J. Ephraums). Cambridge University Press, Cambridge. U.K.
https://www.ipcc.ch/
Intergovernmental Panel on Climate Change (IPCC) 1992b. Climate Change in 1992. The Supplementary report to the IPCC Scientific Assessment (Edited by J. J. Houghton, B. A. Callander and S. K. Varney). Cambridge University Press, Cambridge. U.K.
https://www.ipcc.ch/
Intergovernmental Panel on Climate Change (IPCC) 2007a. Fourth Assessment Report on Climate Change 2007. FAO 3.1, Figure 1, WG1, Chapter 3, p. 253.
http://blogs.ei.colombia.edu/wp-content/uploads/2010/12/graph-2-600X422.jpg
http://www.ipcc.ch/pdf/assessment-report/ar4/wg1/ar4-wg1-chapter3.pdf
Intergovernmental Panel on Climate Change (IPCC) 2007b. Synthesis Report
http://www.ipcc.ch/publications_and_data/ar4/syr/en/spms1.html
Intergovernmental Panel on Climate Change (IPCC) 2007b. Fourth Assessment report on Climate Change 2007 - temperature rise projections.
http://ipcc.ch/publications_and_data/ar4/wg1/en/spmsspm-projections-of.html
Ivanov A.V., Demonterova, E.I., Rasskazov S.V., Yasnygina T.A. 2008. Low Ti melts from the South Eastern Siberian Traps - Large Igneous Province: Evidence for a Water - Rich Mantle Source?
J. Earth Syst. Sci. 117, No.1, pp. 1 - 21.
http://www.ias.ac.in/jessci/feb2008/doo47.pdf
Jacchaia I. G., 1955. Astrophys Jour, 121, 521, “The Physical Theory of Meteors”. Fragmentation as the Cause of the Faint Meteor Anomaly. p. 521.
JANAF Tables in Heicklen, 1076. Oxygen Atmospheric Emmisions Table. Tables T I5 to I6
Kaiser, T. R., 1953. Phil. Mag. Suppl., 2, 495. Radio Echo Studies of Meteor Ionization. p. 495.
Kaiser, T. R., 1955. Jour. Atmos. Terrest. Phys. Suppl. 2, 110. “The Incident Flux of Meteors and the Total Meteoric Ionization”. p. 110.
Kennet, J.P., Cannariato, K.G., Hendy, I.L., Behl, R.J., 2003. Methane Hydrates in Quaternary Climate Change. The Clathrate Gun Hypothesis, Washington D.C., American Geophysical Union. ISBN 0875902960
Kenney J.K., Kutcherov V., Bendeliani N., and Alekseev V. 2002. The evolution of multicomponent systems at high pressure: VI. The thermodynamic stability of the hydrogen - carbon system. The genesis of hydrocarbons and the origin of petroleum. Proceedings of the National Academy of Sciences of the United States of America 99(17): 10976 - 10981.
Kestin J. et al. 1984. J. Phys. Chem. Ref. Data 13, 229.
Khain V.E., Geology of Northern Eurasia (Ex - USSR), 1994. Second part of the Geology of the USSR. Phanerozoic fold belts and young platform. Gebrüder Born Traeger. Berlin 404 pp.
Kozma, N., Speletz, H., Reiter, U., Lanzer, G., Wagner, T., 2011. Impact of 13.56 MHz radio frequency identification systems on quality of stored red blood cells. PubMed.gov.,National Library of Medicine. National Center of Biotechnology Information. Transfusion. 2011, Nov; 51, 11, pp 2384 – 2390.
Pubmed.ncbi.nim.nih.gov/21564105/
Krümmel D.O., 1891. Die Nordatlantische Sargasso Sea. Map. Scale 1:31300.000. Gotha: Justus Perthes.
http://www.gc.noaa.gov/images/gcil/1891_SargassoSee_Krummel_Petermanns_lores.jpg
Krupke, W.F., 1986. Charactersistics of Laser Sources. In Handbook of Laser Science and Technology, Vol. 1, Weber, M.J., Ed., CRC Press, Boca Raton, FL.,1986.
Lide R., and Frederickse H.P.R., 1995. CRC Handbook of Chemistry and Physics. 75th Edition. 1-1 to 1-33.
http://203.158.253.140/media/e-Book/Engineers/Chemistry Handbook%20of%20Chemistry%20 and%20Physics/Section%20l0/10_l8_86.pdf
Kvenvolden, K.A., 1988. Methane hydrate - a major reservoir of carbon in the shallow geosphere? - Chemical Geology, v. 71, pp. 41 -51.
Kvenvolden, K.A., 1988. Estimates of the methane content of world-wide gas-hydrate deposits - Methane resources in the Next Future? Panel Discussion. INOC-TRC, Japan, p. 1 - 8.
Kvenvolden, K.A., 1988. A primer on the geological occurence of gas hydrate. In: Henriet, J.P., and J Mienert (Eds.) Gas hydrates, relevance to world margin stability and climate change. Geological Society london. Spec. Pubs. 137, 9 - 30.
Kvenvolden, K.A., and Calypool, G.E., 1988. Gas hydrates in the oceanic sediment. In: U.S. Geol.Surv. Open - file Rep. No. 88 - 216, 50 pp.
Kvenvolden, K.A., Frank, T.J., Golan - Bac, M., 1990. Hydrocarbon gases in Tertiary and Quaternary sediments offshore Peru - results and comparisons. In: Proc. ODP: Sci. Results, 112, E. Suess and R. von Huene (Eds.). Ocean Drilling Program, College Station, Tx, pp. 505 - 516.
Kvenvolden, K.A., and Grantz, A., 1990. Gas hydrates of the Arctic Ocean region. In: The Geology of North America 50, The Arctic Ocean region. Geological Society of America, pp 539 - 549.
Kvenvolden, K.A. and Kastner, M., 1990. Gas hydrates of the Peruvian outer continental margin. In: Proc. ODP: Sci Results, 112, E. Suess and R. von Huene (Eds.). Ocean Drilling Program, College Station, Tx, pp. 517 - 526.
Kvenvolden, K.A., and Lorenson, T.D., 2001. The global occurence of natural gas hydrate. In: C.K. Paul and W.P. Dillon (Eds.). Natural Gas Hydrates. Occurence, distribution and detection, Geophysical Monograph 124, American Geophysical Union, p. 3 - 18.
Lansley S.P., Gaudin, O., Ye, H., Rizvi N., Whitfield, M.D., Mc Keag, R.D., Jackman R.B 2002. Imaging deep UV light with diamond-based systems. Diamond and Related Materials, 11, pp 433 - 436.
Larousse F. and Auge C. 1968. Nouveau Petit Larousse en Couleurs Libraire, Larousse Paris, Georges Lang, Paris, 1662 pp.
Lawver L.A., Dalziel I.W.D., Norton I.O., and Gahagan L.M., 2009. The Plates 2009 Atlas of Plate Reconstruction (750 Ma to Present Day). Plates Progress Report No. 325 - 0509. The University of Texas Technical Report. No. 196, p. 52.
http://www.ig.utexas.edu/research/projects/plates/250.htm
Lecture 5, 2014. Subduction Zones and Island Arcs.
http://www.ie.ac.uk/gl/art/g/209/lecture5/lecture5.html
Lein – Te, W., Wen – Jhy, L., Chuh – Yung, C., Moo – Been, C., Huei – Chuau C., 1998. Converting Methane by using an RF Plasma Reactor. Plasma Chemistry and Plasma Processing. Vol. 18, No.2, pp. 215 – 239.
Levitus et al. 2012. Global Ocean Heat Content. NOAA/NESDIS/NODS Ocean Climate Laboratory. Updated from Levitus et al. 2012. Global Oceanic Heat and Salt Content. In: NOAA National Oceanographic Data Center (NODS), United States Department of Commerce. http://www.nodc.noaa.gov/OCS/3M_HEAT_CONTENT/Index.html
Lide R., and Frederickse H.P.R., 1995. CRC Handbook of Chemistry and Physics. 75th Edition. 1-1 to 1-33.
Light M.P.R. 2016. Warning - Global Omnicide. In: Arctic-News.
Ivanov A.V., Demonterova, E.I., Rasskazov S.V., Yasnygina T.A. 2008. Low Ti melts from the South Eastern Siberian Traps - Large Igneous Province: Evidence for a Water - Rich Mantle Source?
J. Earth Syst. Sci. 117, No.1, pp. 1 - 21.
http://www.ias.ac.in/jessci/feb2008/doo47.pdf
Jacchaia I. G., 1955. Astrophys Jour, 121, 521, “The Physical Theory of Meteors”. Fragmentation as the Cause of the Faint Meteor Anomaly. p. 521.
JANAF Tables in Heicklen, 1076. Oxygen Atmospheric Emmisions Table. Tables T I5 to I6
Kaiser, T. R., 1953. Phil. Mag. Suppl., 2, 495. Radio Echo Studies of Meteor Ionization. p. 495.
Kaiser, T. R., 1955. Jour. Atmos. Terrest. Phys. Suppl. 2, 110. “The Incident Flux of Meteors and the Total Meteoric Ionization”. p. 110.
Kennet, J.P., Cannariato, K.G., Hendy, I.L., Behl, R.J., 2003. Methane Hydrates in Quaternary Climate Change. The Clathrate Gun Hypothesis, Washington D.C., American Geophysical Union. ISBN 0875902960
Kenney J.K., Kutcherov V., Bendeliani N., and Alekseev V. 2002. The evolution of multicomponent systems at high pressure: VI. The thermodynamic stability of the hydrogen - carbon system. The genesis of hydrocarbons and the origin of petroleum. Proceedings of the National Academy of Sciences of the United States of America 99(17): 10976 - 10981.
Kestin J. et al. 1984. J. Phys. Chem. Ref. Data 13, 229.
Khain V.E., Geology of Northern Eurasia (Ex - USSR), 1994. Second part of the Geology of the USSR. Phanerozoic fold belts and young platform. Gebrüder Born Traeger. Berlin 404 pp.
Kozma, N., Speletz, H., Reiter, U., Lanzer, G., Wagner, T., 2011. Impact of 13.56 MHz radio frequency identification systems on quality of stored red blood cells. PubMed.gov.,National Library of Medicine. National Center of Biotechnology Information. Transfusion. 2011, Nov; 51, 11, pp 2384 – 2390.
Pubmed.ncbi.nim.nih.gov/21564105/
Krümmel D.O., 1891. Die Nordatlantische Sargasso Sea. Map. Scale 1:31300.000. Gotha: Justus Perthes.
http://www.gc.noaa.gov/images/gcil/1891_SargassoSee_Krummel_Petermanns_lores.jpg
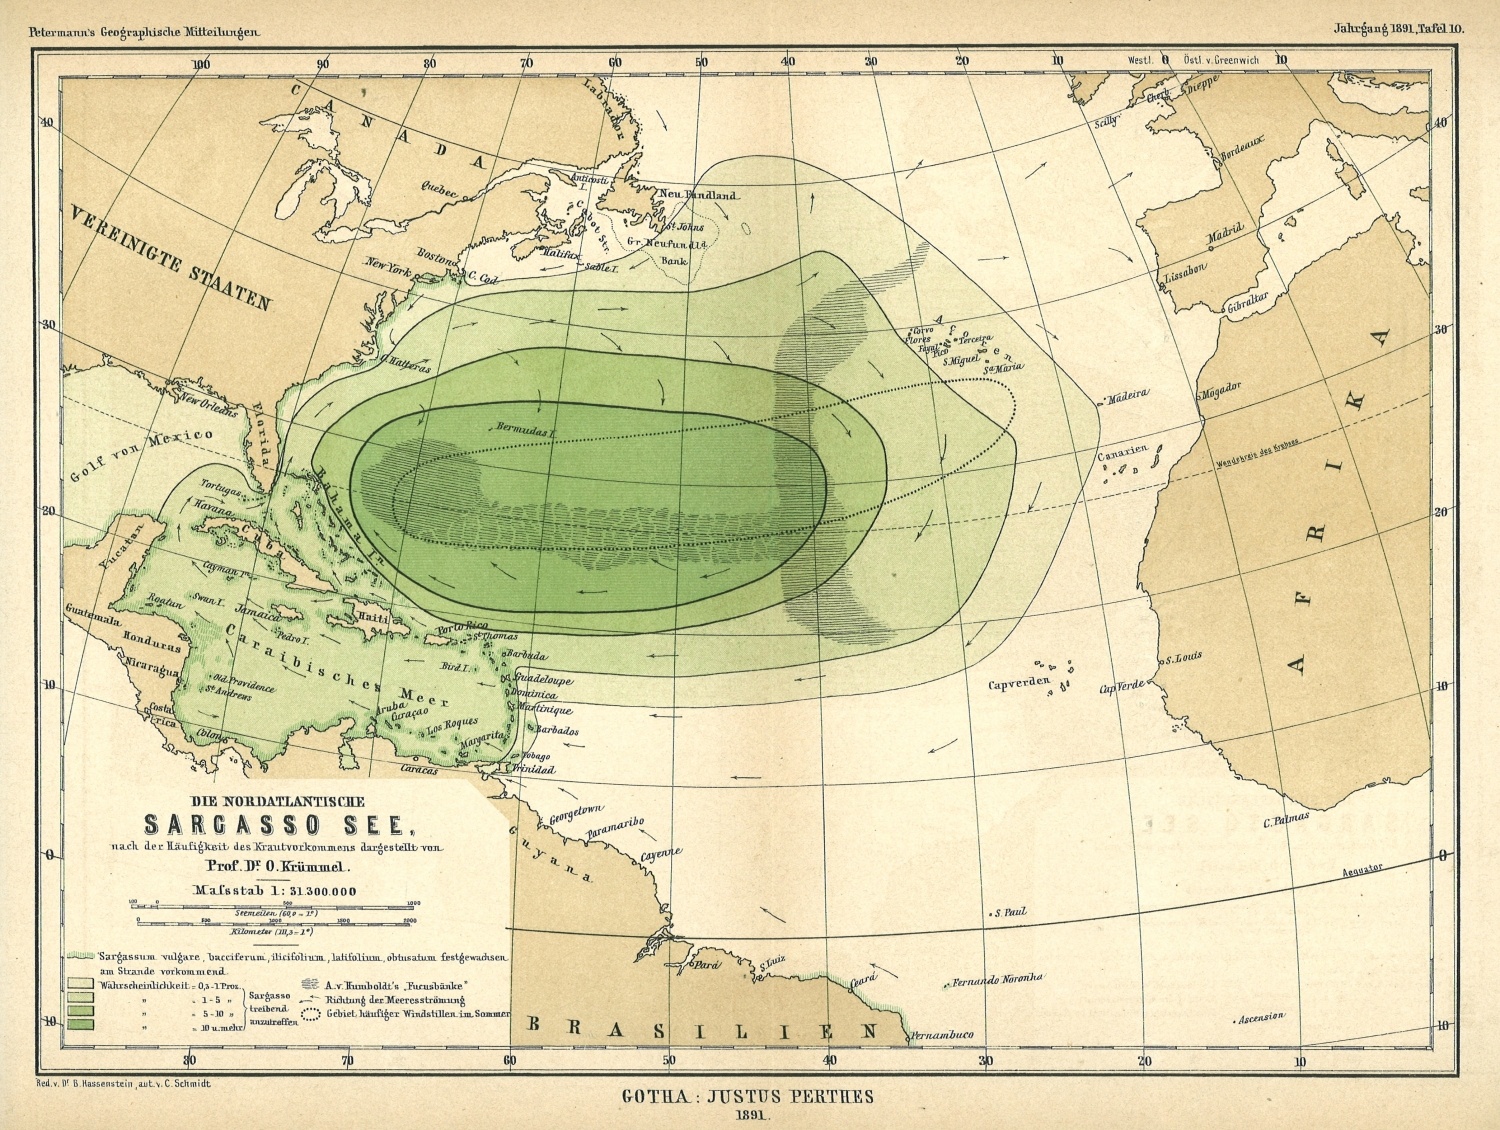
Krupke, W.F., 1986. Charactersistics of Laser Sources. In Handbook of Laser Science and Technology, Vol. 1, Weber, M.J., Ed., CRC Press, Boca Raton, FL.,1986.
Lide R., and Frederickse H.P.R., 1995. CRC Handbook of Chemistry and Physics. 75th Edition. 1-1 to 1-33.
http://203.158.253.140/media/e-Book/Engineers/Chemistry Handbook%20of%20Chemistry%20 and%20Physics/Section%20l0/10_l8_86.pdf
Kvenvolden, K.A., 1988. Methane hydrate - a major reservoir of carbon in the shallow geosphere? - Chemical Geology, v. 71, pp. 41 -51.
Kvenvolden, K.A., 1988. Estimates of the methane content of world-wide gas-hydrate deposits - Methane resources in the Next Future? Panel Discussion. INOC-TRC, Japan, p. 1 - 8.
Kvenvolden, K.A., 1988. A primer on the geological occurence of gas hydrate. In: Henriet, J.P., and J Mienert (Eds.) Gas hydrates, relevance to world margin stability and climate change. Geological Society london. Spec. Pubs. 137, 9 - 30.
Kvenvolden, K.A., and Calypool, G.E., 1988. Gas hydrates in the oceanic sediment. In: U.S. Geol.Surv. Open - file Rep. No. 88 - 216, 50 pp.
Kvenvolden, K.A., Frank, T.J., Golan - Bac, M., 1990. Hydrocarbon gases in Tertiary and Quaternary sediments offshore Peru - results and comparisons. In: Proc. ODP: Sci. Results, 112, E. Suess and R. von Huene (Eds.). Ocean Drilling Program, College Station, Tx, pp. 505 - 516.
Kvenvolden, K.A., and Grantz, A., 1990. Gas hydrates of the Arctic Ocean region. In: The Geology of North America 50, The Arctic Ocean region. Geological Society of America, pp 539 - 549.
Kvenvolden, K.A. and Kastner, M., 1990. Gas hydrates of the Peruvian outer continental margin. In: Proc. ODP: Sci Results, 112, E. Suess and R. von Huene (Eds.). Ocean Drilling Program, College Station, Tx, pp. 517 - 526.
Kvenvolden, K.A., and Lorenson, T.D., 2001. The global occurence of natural gas hydrate. In: C.K. Paul and W.P. Dillon (Eds.). Natural Gas Hydrates. Occurence, distribution and detection, Geophysical Monograph 124, American Geophysical Union, p. 3 - 18.
Lansley S.P., Gaudin, O., Ye, H., Rizvi N., Whitfield, M.D., Mc Keag, R.D., Jackman R.B 2002. Imaging deep UV light with diamond-based systems. Diamond and Related Materials, 11, pp 433 - 436.
Larousse F. and Auge C. 1968. Nouveau Petit Larousse en Couleurs Libraire, Larousse Paris, Georges Lang, Paris, 1662 pp.
Lawver L.A., Dalziel I.W.D., Norton I.O., and Gahagan L.M., 2009. The Plates 2009 Atlas of Plate Reconstruction (750 Ma to Present Day). Plates Progress Report No. 325 - 0509. The University of Texas Technical Report. No. 196, p. 52.
http://www.ig.utexas.edu/research/projects/plates/250.htm
Lecture 5, 2014. Subduction Zones and Island Arcs.
http://www.ie.ac.uk/gl/art/g/209/lecture5/lecture5.html
Lein – Te, W., Wen – Jhy, L., Chuh – Yung, C., Moo – Been, C., Huei – Chuau C., 1998. Converting Methane by using an RF Plasma Reactor. Plasma Chemistry and Plasma Processing. Vol. 18, No.2, pp. 215 – 239.
Levitus et al. 2012. Global Ocean Heat Content. NOAA/NESDIS/NODS Ocean Climate Laboratory. Updated from Levitus et al. 2012. Global Oceanic Heat and Salt Content. In: NOAA National Oceanographic Data Center (NODS), United States Department of Commerce. http://www.nodc.noaa.gov/OCS/3M_HEAT_CONTENT/Index.html
Lide R., and Frederickse H.P.R., 1995. CRC Handbook of Chemistry and Physics. 75th Edition. 1-1 to 1-33.
Light M.P.R. 2016. Warning - Global Omnicide. In: Arctic-News.
Light M.P.R. 2015. Lucy-Alamo Projects - Hydroxyl Generation and Atmospheric Methane Destruction
https://arctic-news.blogspot.com/2015/10/lucy-alamo-projects-hydroxyl-generation-and-atmospheric-methane-destruction.htmland
American Metereological Society 18th Conference on Atmospheric Chemistry, 13 January 2016.
Light M.P.R. 2014. Interview with Malcolm Light dy Dorsi Diaz, September 10, 2014. Edited by Sam Carana. In Arctic-News.
https://arctic-news.blogspot.com/p/malcolmlight.html
Light M.P.R., Hensel H, Carana S. 2014. Arctic Atmospheric Methane Global Warming Veil
https://arctic-news.blogspot.com/2014/06/arctic-atmospheric-methane-global-warming-veil.html
Light M.P.R. 2013. The Non - Disclosed Extreme Arctic Methane Threat. The 2013 Australian above average temperatures set a record of 0.22°C higher than the 12 month period prior to 2013 and confirm a mid - 21st century atmospheric methane - induced global deglaciation and major extinction event.
https://sites.google.com/site/runawayglobalwarming/the-non-disclosed-extreme-arctic-methane-threat
Light M.P.R. 2012e. Further Confirmation of a Probable Arctic Sea Ice Loss by Late 2015. Edited by Sam Carana. In: Arctic-News.
https://arctic-news.blogspot.com/2012/09/further-confirmation-of-a-probable-arctic-sea-ice-loss-by-late-2015-loss.html
Light M.P.R. 2012d. Project Lucy. In: Arctic-News.
Light M.P.R. 2012c. Angels Proposal - A Proposal for the Prevention of Arctic Methane Induced Catastrophic Global Climate Change by Extraction of Methane from beneath the Permafrost/Arctic Methane Hydrates and its Storage and Sale as a Subsidized "Green Gas" Energy Source. LGS. 49 pp. In: Arctic-News.
https://arctic-news.blogspot.com/2012/05/proposal-to-extract-store-and-sell.html
Light M.P.R., 2012b. How much time is there left to act, before methane hydrate releases will lead to human extinction? Edited by Sam Carana. In: Geo-Engineering.
https://geo-engineering.blogspot.com/2012/02/how-much-time-is-there-left-to-act.html
Light M.P.R. 2012a. Global extinction within one human lifetime as a result of a spreading atmospheric Arctic methane heatwave and surface firestorm. Edited by Sam Carana. In Arctic-News.
https://arctic-news.blogspot.com/p/global-extinction-within-one-human.html
Light M.P.R. 2011c. Stratospheric methane global warming veil. Edited by Sam Carana. In: Arctic-News.
https://arctic-news.blogspot.com/p/stratospheric-methane-global-warming.html
Light M.P.R. 2011b. Use of beamed interfering radio frequency transmissions to decompose Arctic atmospheric methane clouds. Edited by Sam Carana. In: Arctic-News.
https://arctic-news.blogspot.com/p/decomposing-atmospheric-methane.html
Light M.P.R. and Carana, S., 2011a. Methane linked to seismic activity in the Arctic. Edited by Sam Carana. In: Arctic News.
https://arctic-news.blogspot.com/p/seismic-activity.html
Light, M.P.R. and Solana, C. , 2002b- Arctic Methane Hydrates: A Potential Greenhouse Gas Hazard
http://adsabs.harvard.edu/abs/2002EGSGA..27.4077L
Light M.P.R. and Solana C., 2002a. Arctic methane hydrates - Mapping a potential greenhouse gas hazard. Abstract and Poster, EGS, Nice - Poster, appendix to Seismic Activity. In: Arctic-News.
https://arctic-news.blogspot.com/p/seismic-activity.html
Light, M.P.R., Posey, H.H., Kyle, J.R., and Price P.E., 1987. Model for the origins of geopressured brines, hydrocarbons, caprocks and metallic mineral deposits; Gulf Coast, U.S.A., In: Lerch, Ian and O'Brien, J.J., Dynamical geology of salt and related structures: Orlando, Florida, Academic Press, pp. 787 - 830.
Light M.P.R., 1985. Structure, facies, continuity and internal properties of the Frio "A" sandstone, N.E. Hitchcock Field, Galveston County, Texas. In: Dorfman, M.H., and Morton R.A., eds., Geopressured - Geothermal Energy, Proceedings of the Sixth U.S. Gulf Coast Geopressured - Geothermal Energy Conference Pergamon, p. 229 - 238.
Li Z., Guo Z., Bai Z., Lin G., 2004. Geochemistry and Tectonic Environment and Reservoir Formation of Mantle - Derived Natural Gas in the Songiliao Basin, Northeastern China. Geotectonica et Metallogenia
Liu B., Wang B.S., Ji W.G., Kern H., Popp T., 2001. Closure of Micro - Cracks in Rock Samples under Confining Pressure. Chinese Journal of Geophysics. Vol 44, No. 3, 2001.
http://www.agu.org/WPS/cig/44/44.03/articles/440316.pdf
LIP, 2013. October 2013 LIP of the Month (Large Igneous Provinces).
http://www.largeigneousprovinces.org
Lopatin, N.V. 1971. Temperature and geologic time as factors in coalification (in Russian). Akad. Nauk SSSR. Izvestiya. Seriya Geologicheskaya, 3, pp.95 - 106.
MacDonald G.J., 1988. Major Questions about Deep Continental Structures. In: A. Bodeń K.G., Eriksson. Deep Drilling in Crystalline Bedrock, v.1. Berlin: Springer Verlag. pp. 28 -48. ISBN 3 -540 - 18995 - 5. Proceedings of the Third International Symposium on Observation of the Continental Crust through Drilling held in Mora and Orso, Sweden, September 7 - 10, 1987.
Marreo T.R. and Mason E. A. 1972. J. Phys. Chem. Ref. Data 1, 1.
Masters. J. 2009. Top Climate Story of 2008. Arctic Sea Ice Loss. Dr Jeff Masters Wunderblog.
http://www.wunderground.com/blog/JeffMasters/comment.html?entrynum=1177
Max, M.D., and Lowrie, A., 1993. Natural gas hydrates, Arctic and North Sea potential. In Vorren, T.O., Bergsager, E., Dahl-Stamnes, A., Holter, E., Johansen, B., lie, e., and Lund, T.B.. Arctic Geology and Petroleum Potential, Proceedings of the Norwegian Petroleum society Conference, 15 - 17 august 1990, tromso, Norway, Norwegian Petroleum Society (NPF), Special Publication 2, Elsevier, Amsterdam, 27 -53.
McCartney E.J. 1983. Absorption and Emission by Atmospheric Gases. John Wiley and Sons.
Merali Z., 2004. Earth's Mantle can Generate Methane. Nature. doi:10.1038/news040913-5.
http://www.nature.com/news/2004/040913/fullnews040913-5.html
Mineral Commodities Survey - Helium. January 2011, USGS.
http://minerals/pubs/commodity/helium/mcs-2011-heliu.pdf
Mitura, S., Mitura, K., Niedzielski, P., Louda R., Danilenko, V., 2006. Nanocrystalline diamond, its synthesis, properties and applications. Journal of Achievements in Materials and Manufacturing Engineering, Vol 16, Issue 1-2, pp 9 -16.
http://journalamme.org/papers_cams05/1244.pdf
Morgan W. J. 1981. Hot Spot tracks and the opening of the Atlantic and Indian oceans. In C. Emiliani (Ed.) The Oceanic Lithosphere. Wiley, New York. pp. 443 - 487.
Murphy D.M., Solomon S., Portmann R.W., Rosenlof K.H., Forster P.M., Wong T., 2009. An obervationally based energy balance for the Earth since 1950. Journal of Geophysical Research: Atmospheres (1984 - 2012), Vol. 114, Issue D17, 16 September 2009.
NASA, 2002. Global Temperature Anomalies in 0.1C. Goddard Institute for Space Studies., NASA Goddard Space Flight Center, Earth Sciences Directorate.
http://www.giss.nasa.gov/data, updated December 2002.
NASA, 2007. "Methane Blast" NASA, May 4, 2007. Test firing of a 7,500 pound thrust LOX/methane engine. Image credit Mike Masseea Aerospace.
http://science.nasa.gov/science-at-nasa/2007/04may-methaneblast/
NASA, 2008. Earth Observatory. Noctilucent Clouds
http://earthobservatory.nasa.gov/images/8366/noctilucent clouds
NASA, 2011, GISS surface temperature data. SBBX.Tsurf250, (18.9MB) suf air temp (1880-present) 250km smoothing.
ftp://data.giss.nasa.gov/pub/gistemp/download/
NASA, 2012. Atmospheric methane levels. AIRS 2006 - 2009 annual mean upper troposphere (359 Hpa) methane concentration (ppm).
http://daac.gsfc.nasa.gov/giovanni/
NASA, 2012. Global temperature data.
http://data.giss.nasa.gov/gistemp/tabledata_v3/GLB.Ts.txt
Nassar, R., Bernath P.F., Boone, C.D., Manney, G.L., McLeod, S.D., Rinsland, C.P., Skelton, R., Walker, K.A., 2005. Stratospheric abundances of water and methane based on ACE-FTS measurements. geophysical Research Letters, Vol.32, L15504, 5 pp.
http://www.atmosp.physics.utoronto.ca/~massar/Publications_pdfs/Nassar_water_methane_2005GL022383.pdf
Nataf H.C., Nakanishi I., Anderson D.L., 1986. Measurements of mantle wave velocities and inversion\ for lateral heterogeneities and anisotropy. Part III. Inversion. J. Geophys. Res., 91, 7261 - 7307.
National Snow and Ice Data center (NSIDC), 2011a. The Polar Vortex.
http://nsidc.org/arcticmet/patterns/polar_vortex.html
National Snow and Ice Data center (NSIDC), 2011b.
Arctic Climatology and Meteorology,
http://nsidc.org/articmet/factors/winds.html
Naumer T., 2012. Triggering permafrost meltdown is closer than we think.
http://climatechangepsychology.blogspot.com/2012/04/triggering-permafrost-meltdown-is.html
Nicolet, M., 1961. in “Mesospheric Models and Related Experiments” (G. Fiocco Ed.) Reidel Publ, Dordrecht, Holland, “Aeronomic Reactions of Hydrogen and Ozone, P.1
NIWA (Nukurangi Taihoro) 2021. Layers of Atmosphere.
niwa.co.nz/education-and-training/schools/layers. 12:33 31/01/2021
NOAA 2011a. Huge sudden atmospheric methane spike Arctic Svalbard (north of - Norway)
NOAA 2011b. Huge sudden methane spike recorded at Barrow (BRW), Alaska, United States. Generated ESRL/GMO – 2011. December 14-17-21 pm
NOAA ESRL (2012). Atmospheric Carbon Dioxide Levels, 2009. NOAA ESRL data. ftp:ftp.cmdl.noaa.gov/ccg/co2/trends/co2_annmean_mlo.txt
NOAA, 1999. Paleoclimatology Program. International Ice Core Data Cooperative. Vostok Ice Core Data.
http://www.ngdc.noaa.gov/palaeo/icecore/antarctica/vostok/vostok.html
NSIDC 2011a. The Polar Vortex. National Snow and Ice Data Center, http://nsidc.org/arcticmet/patterns/polar_vortex.html
Norwegian Polar Institute, 2001. Svalbard, Climate:
http://www.npolar.no/en/the-arctic/svalbard/
Nuccitelli D., Way R., Painting R., Church J., Cook J., 2012. Comment on "ocean heat content and Earth's radiation imbalance.II Relation to climate shifts". Physics Letters A. Vol. 376, Issue 45, 1 October 2012, 3466 - 3468.
O’Carrol C., (2007, June 28). NASA Satellite Captures First View of ‘Night Shining Clouds’. NASA Earth Observatory. Accessed July 4, 2008.
O’Carroll C., Steigerwald B., (2007, December 10). NASA Satellite Reveals Unprecidented View of ‘Night Shining Clouds January’. NASA Earth Observatory. Acessed January 4, 2008.
Olivier, C.P., 1942. Long Enduring Meteor Trains. Proc. Amer. phil. Soc. 35. p.93
Olivier, C.P., 1948. long Enduring Meteor Trains. Proc. Amer. Phil. Soc. 91, p. 315 (second paper).
Paull et al. 2007. Origin of pingo-like features on the Beaufort Sea Shelf and their possible relationship to decomposing methane hydrates. Geophysical Research Letters 34, L01603.
http://www.agu.org/pobs/crossref/2007/2006GL027977.shtml
Penguin Dictionary of Physics, 2000. Third Edition.
Market House Books Ltd. Penguin Books. 504 pp.
Peterson J.B., Helium USGS.
http://minerals.usgs.gov/minerals/pubs/commodity/helium/330495.pdf
Petrology (2013). Composition of the Lithospheric mantle. Location map of Udachnaya Kimberlite Fields. petrology.oxfordjournals.org
Phillips T, (August 25, 2008). “Strange Clouds at the Edge of Space”. NASA Archives from original on February 1, 2010.
Polar View, 2012. Earth Observtion for Polar Monitoring (AIRS data) - DTU Space. Technical University of Denmark -
Zonenshain L.P., Kuzmin M.I., and Natapov L.M., 1990. Geology of the USSR. A Plate Tectonic Synthesis. AGU Geodynam. Ser. Monogr. 21
Zuppero A., US. Department of Energy, Idaho National Engineering Laboratory - Discovery of Water Ice Nearly Everywhere in the Solar System.
Zwart H.J. and Dornsiepen U.F. 1980. The Variscan and pre - Variscan tectonic evolution of the Central and Western Europe: a Tentative Model. In J. Cogne and M. Slansky (Eds), Geology of Europe. B.R.G.M. Orleans. France. pp 226 - 232.
NOAA 2011a. Huge sudden atmospheric methane spike Arctic Svalbard (north of - Norway)
NOAA 2011b. Huge sudden methane spike recorded at Barrow (BRW), Alaska, United States. Generated ESRL/GMO – 2011. December 14-17-21 pm
NOAA ESRL (2012). Atmospheric Carbon Dioxide Levels, 2009. NOAA ESRL data. ftp:ftp.cmdl.noaa.gov/ccg/co2/trends/co2_annmean_mlo.txt
NOAA, 1999. Paleoclimatology Program. International Ice Core Data Cooperative. Vostok Ice Core Data.
http://www.ngdc.noaa.gov/palaeo/icecore/antarctica/vostok/vostok.html
NSIDC 2011a. The Polar Vortex. National Snow and Ice Data Center, http://nsidc.org/arcticmet/patterns/polar_vortex.html
Norwegian Polar Institute, 2001. Svalbard, Climate:
http://www.npolar.no/en/the-arctic/svalbard/
Nuccitelli D., Way R., Painting R., Church J., Cook J., 2012. Comment on "ocean heat content and Earth's radiation imbalance.II Relation to climate shifts". Physics Letters A. Vol. 376, Issue 45, 1 October 2012, 3466 - 3468.
O’Carrol C., (2007, June 28). NASA Satellite Captures First View of ‘Night Shining Clouds’. NASA Earth Observatory. Accessed July 4, 2008.
O’Carroll C., Steigerwald B., (2007, December 10). NASA Satellite Reveals Unprecidented View of ‘Night Shining Clouds January’. NASA Earth Observatory. Acessed January 4, 2008.
Olivier, C.P., 1942. Long Enduring Meteor Trains. Proc. Amer. phil. Soc. 35. p.93
Olivier, C.P., 1948. long Enduring Meteor Trains. Proc. Amer. Phil. Soc. 91, p. 315 (second paper).
Paull et al. 2007. Origin of pingo-like features on the Beaufort Sea Shelf and their possible relationship to decomposing methane hydrates. Geophysical Research Letters 34, L01603.
http://www.agu.org/pobs/crossref/2007/2006GL027977.shtml
Penguin Dictionary of Physics, 2000. Third Edition.
Market House Books Ltd. Penguin Books. 504 pp.
Peterson J.B., Helium USGS.
http://minerals.usgs.gov/minerals/pubs/commodity/helium/330495.pdf
Petrology (2013). Composition of the Lithospheric mantle. Location map of Udachnaya Kimberlite Fields. petrology.oxfordjournals.org
Phillips T, (August 25, 2008). “Strange Clouds at the Edge of Space”. NASA Archives from original on February 1, 2010.
Polar View, 2012. Earth Observtion for Polar Monitoring (AIRS data) - DTU Space. Technical University of Denmark -
http://www.seaice.dk
Pravettoni, R., 2009. WWF Arctic Feedbacks Report. UNEP.GRID Arendal.
http://www.grida.no/graphicslib/detail/annual-temperatures-increases-for-2001-2005-relative-to-1951-1980-6beo
Ramsay J.G. 1967. Folding md Fracturing in Rocks. Mc-Graw Hill. New York. 562 pp.
Rianovosti, 2011. Russian, US scientists set to study methane release in Arctic. ScienceRSS
http://en.rian.ru/science/20110902/166364635.html
Robertscribbler, 2014. Methane monster finding cracks in the Earth's defenses. Is the global methane sink starting to fade.
http://robertscribbler.wordpress.com/2014/04/18/methane-monster-finding-cracks-in-earths-defenses-is-the-global-methane-sink-starting-to-fade
Rutgers, 2013a. Atlantic Ocean Gyre Map.
http://www.i-cool.org/wp-content/uploads/2010/02/ce058700fg0010.gif
Rutgers, 2013b. South Atlantic Gyre. I-Cool. International Coalition of Ocean Observing Laboratories. http://www.i-cool.org/?p=4916
Science Daily, (April 11, 2014). Appearance of Night Shining Clouds has Increased”. Retrieved May 7, 2014.
About NLC’s . Polar Mesospheric Clouds from Atmospheric Optics.
Scott H.P., Hemley R.J., , Mao H.K., Herschbach D.R., Fried L.E., Howard W.M., Bastea H.S., Generation of Methane in the Earth's Mantle. In situ high pressure - temperature mantle measurements of carbonate reduction. PNAS vol. 101, no. 29. pp 14023 - 14026
http://www.pnas.org/content/101/39/14093.full
Sekretov S.H. 1988. Correction. Petroleum Potential of Laptev Sea Basins. Geological, Tectonic and Geodynamic Factors:In: Polarforschung 68. Tessensohn F., Roland N.W., (eds) ICAMIII. International Conference on Arctic Margins. Celle (Germany). 12 - 16
October, 1998. pp 179 - 186.
Semiletov, I. 2011. Quoted from Itar-Tass. Heavy methane emissions found in the Arctic Eastern Sector. Itar-Tass. September 26, 2011.
http://www.itar-tass.com/en/c154/233799.html
Shakel M., 2005. Sustainability: Our Environment.
http://www.earthethicsinstitute.org/facultycurriculum-pdf/sustainability%20exploration20in%Mathematics.pdf
Shakova N., 2013. A thawing ocean floor pours methane into the atmosphere and it's only getting worse. PRI. Science. Tech and Environment.
http://www.pri.org/stories/2013-12-12/thawing-ocean-floor-pours-methane-atmosphere-and-its-only-getting-worse
Shakova N., and Semiletov I., 2012. Methane release from the East - Siberian - Arctic - Shelf and its connection with permafrost and hydrate destabilization. First resuls and potential future development. Geophys. Res. Vol. 14, EGU20l2-3877-1
Shakova N., Semiletov, I., Salyuk, A., and Kosmach, D., 2008. Anomalies of methane in the atmosphere over the East Siberian Shelf. Is there any sign of methane leakage from shallow shelf hydrates? EGU General Assembly 2008. Geophysical Research Abstracts, 10, EGU2008-A-01526
Shakova, N. and Semiletov, I., 2010a. Methane release from the East Siberian Shelf and the potential for abrupt climate change. Presentation in November 30, 2010.
http://symposium2010.serdp-estcp.org/Technical-Sessions/1A
Shakova N., Semiletov, I., Leifer, I., Salyuk, A., Rekant, P., and Kosmach, D. 2010b. Geochemical and geophysical evidence of methane release over the East Siberian Arctic Shelf. Journal Geophys. Research 115, C08007
http://europa.agu.org/?view=article&uri=/journals/jc/jc1008/2009jcoo5602/2009jc005602.xml
Shakova, N., Semiletov, I., Salyuk, A., Yusupov, V., Kosmach, D., and Gustafsson, O., 2010c. Extensive methane venting to the atmosphere from sediments of the East Siberian Arctic Shelf. Science.
http://www.sciencemag.org/content/327/5970/1246.short
Shiryaev , A.A., Lakoubovskii, N., Grambole D. and Dubrovinskaia, N., 2006. Spectroscopic study of defects and inclusions in bulk poly-and nanocrystalline diamond aggregates. Journal of Physics. Condensed Matter 18, No. 40, L493 - L501.
Simonds P., (2008 – 05 – 12). “Mysterious Noctilucent Clouds Span the Heavens”. Times on Line. Retrieved 2008 – 10.
Sloan, E.D., 1998. Clathrate hydrates of natural gas. 2nd ed., Marcel Dekker, New York, 705 pp.
Smith H, J, 1954. Astrophys. Jour. 119,438. “The Physical Theory of Meteors”. The Masses of Meteor Flare Fragments”. P. 438.
Smithson S.B., Wenzel F., Ganchin Y.V., Morozov I.B., 2000. Seismic results at Kola and K.T.B. deep scientific boreholes; velocities, reflections, fluids and crustal composition. Tectonophysics 329 (1-4), 301 - 307.
Bibcode. 2000 Tectp 329. 3015. doi; 10. 1016/50040 - 1951 (00)00200-6.
Smithsonian, 2012. Infrared Spectroscopy Laboratory. Smithsonian Museum of Natural History. Washington.
MineralSciences.si.edu/facilities/ftir.htm
Sohn R.A., et al. 2007. Explosive volcanism on the ultraslow - spreading Gakkel Ridge, Arctic Ocean.
https://darchive.mblwhoilibrary.org/bitstream/handle/1912/2636/2007-12-13258A_text.pdf?sequence=1
Solana, C., and Light, M.P.R., 2002. Can we turn a hazard into a development tool. The case of methane hydrates in the permafrost. Abstract and Poster. EGS, Nice.
Sternowski, R.H., 2012. Lecture 7. Softronics ltd.
http://www.softronicsltd.com
Sverdrup, Johnson and Fleming, 1942. In; introduction to Physical Oceanography.
http://oceanworld.tamu.edu/resources/ocng_textbook/chapter 11/chapter11_04.htm
http://publishing.cdlib.org/ucpressebooks/view?docId=kt167nb66r&doc.view=popup&fig.ent=http://publishing.cdlib.org/ucpressebooks/data/13030/6r/kt167nb66r/figures/kt167nb66r_fig187.gif
Yirka B. 2012. New research explains how diamond rich kimberlite makes its way to Earth's surface. Phys.Org.
http://phys.org/news/2012-01-diamond-rich-kimberlite-earth-surface.html
Table 1. (P - T conditions in) Journey to the Center of the Earth. http://web.ics.purdue.edu/~braile/edumod/journey/journey.htm
Thomas R. N. and Whipple F. I., 1951. Astrophys. Jour. 114, 448. “The Physical Theory of Meteors. I. I. Astroballistic Heat Transfer p. 448.
Thomas R. N., 1952. Astrophys. Jour. 116, 203. @The Physical Theory of Meteors”, III. Conditions of the Meteor Surface. P. 203.
Thomas R. N. and White W. C., 1953. Astrophys. Jour. 118, 555. “The Physical Theory of Meteors” IV, Inquiry into the Radiation Problem. A Laboratory Model. P. 555.
Thomson L.A., 1988. Elastic Anisotropy due to Aligned Cracks. Geophysics.
Thormalen, I., Straub, J., and Grigul U., 1985. Refractive Index of Water and its Dependence on Wavelength, Temperature and Density. Jour. Phys. Chem. Ref. Data.14, p. 933
Trenberth K., 2014. Deep ocean warming is coming back to haunt us: Record Warmth for 2014 likely as Equatorial Heat Rises.
http://robertscribbler.wordpress.com/2014/05/16/deep-ocean-warming-is-coming-back-tohaunt-us-record-warmth-for-2014
Tupolev, 2013. Tu - 155 built to use cyrogenic fuel.
http://www.Tupolev.ru/English/Picture.asp?PubID=1788
Velard G. 2006. Inertial Confinement Nuclear Fusion: A Historical Approach by Pioneers. Lawrence Livermore Laboratory Report. UCRL-Book-218579
Wales J., 2013.Wikipedia.
Wikipedia; Columbia River Basalt Group
http://en.wikipedia.org/wiki/Columbia_River_Basalt_Group
Wikipedia; South Atlantic Gyre
http://en.wikipedia.org/wiki/File:South_Atlantic_Gyre.png
Wikipedia; Sverdrup
http://en.wikipedia.org/wiki/Sverdrup
Wikipedia; Topography of the Arctic Ocean
http://en.wikimedia.org/wikipedia/commons/d/d5/IBCAO_betamap.jpg
Wikipedia; West Spitsbergen Current
http://en.wikipedia.org/wiki/West-Spitsbergen-Current
Wales J. 2012. Wikipedia - Carbon Dioxide
http://en.wikipedia.org/wiki/Carbon_dioxide
Wikipedia - Climate of the Arctic
http://en.wikipedia.org/wiki/Climate_of_the_Arctic
Wikipedia - Chemical Vapour Deposition of Diamond
http://en.wikipedia.org/wiki/Chemical_vapour_deposition_of_diamond
Wikipedia - Chemical Vapor Deposition
http://en.wikipedia.org/wiki/Chemical_vapor_deposition
Wikipedia - Density of Air
http//en.wikipedia.org/wiki/Density_of_air
Wikipedia - Effective Radial Power
http://en.wikipedia.org/wiki/Effective_radial_power
Wikipedia - Enthalpy of Fusion
http://en.wikipedia.org/wiki/Enthalpy_of_fusion_Jason_1
http://en.wikipedia.org/wiki/Jason-1
Wikipedia - HAARP - High Frequency Active Auroral Research Program http://en.wikipedia.org/wiki/High_frequency_active_auroral_research_program
Wikipedia - Methane
http://en.wikipedia.org/wiki/Methane
Wikipedia - Methyl Group
http://en.wikipedia.org/wiki/methyl_group
Wikipedia - Natural Gas
http://en.wikipedia.org/wiki/Natural_gas
Wikipedia - Sea Level
http://en.wikipedia.org/wiki/Sea_level
Wales J. 2020. Wikipedia - Microwave Oven
http://en.wikipedia.org/wiki//Microwave_oven
Wikipedia - Noctilucent Cloud
http://en.wikipedia.org/wiki/Noctilucent_cloud
Weatheronline, 2013.
http://www.weatheronline-co.uk/reports/wxfacts/North-Atlantic-Drift-Gulf-Stream.htm
Whipple, F. L., 1955. Astrophys. Jour. 121, 241. “The Physical Theory of Meteors”, VII. On Meteor Luminosity and Ionization, p. 241.
Whitcomb J.H., Garmany J.D., and Anderson D.L., 1973. Earthquake prediction. Variation of seismic velocities before the San Francisco earthquake, 180, 632 - 635.
Whiticar M.J., 1994. Correlation of Natural Gases and their Sources. Chapter 16, Part IV. Identification and Characterisation, AAPG Special Volumes. Volume M60. The Petroleum System - From Source to Trap. pp 261 - 283.
Wignall P. 2009. Miracle Planet: Episode 4, Part 2. Coproduced by NHK (Japan) and the National Film Board of Canada (NFB).
http://www.youtube.com/watch?v=exfNNDExxic&list=PL0200B1S24E220C5A&feature=playerembedded#!
Windley B.F., 1986. The Evolving Continents. 2nd Edition. John Windley and Sons. 399pp.
Winkler H.G.F., 1976. Petrogenesis of Metamorphic Rocks. Fourth Edidtion. Springer - Verlag, New York, 334 pp.
Wofsy, S.C., 2011 (image:HIPPO-1 flight along the date line, January 2009). HIAPER Pole-toPole Observations (HIPPO). Fine-grained, global-scale measurements of climatically important atmospheric gases and aerosols. Phil. Trans. R. Soc. A (2011) 369, 2073 - 2086. doi:10.1098/rsta.2010.0313. http://rsta.royalsocietypublishing.org/content/369/1943/2073.full.html
Yakovlev A.V., Bushenkova N.A., Koulakov I. Yu., Dobretsov N.L., 2012. Structure of the upper mantle in the Circum - Pacific region from regional seismic tomography. Science Direct. Russian Geology and Geophysics 53, 963 - 971.
https://www.ivan.art.com/sciences/PAPERS/2012_arctic.pdf
Yirka B. 2012. New research explains how diamond rich kimberlite makes its way to Earth's surface. Phys Org.
http://phys.org/news/2012-01-diamond-rich-kimberlite-earth-surface.html
Yurganov, L.,2012a. Atmospheric Infrared Sounder (AIRS) data from NASA's Aqua Satellite. Index of /pub/yurganov/methane/MAPS/
ftp://asl.umbc.edu/yurganov/methane/MAPS/
Yurganov, L. 2012b. Atmospheric Infrared Sounder (AIRS) data from NASA's Aqua Satellite. ftp://asl.umbc.edu/pub/yurganov/methane/AIRS/CH4/2002-2012.jpg
Zhu, Y., Li, J., Li, W., Zhang, Y., Yang, X., Chen, N., Sun, Y., Zhao, Y., Fan, C., Huang, Q., 2012. The Biocompatability of Nanodiamonds and their Application to Drug Delivery Systems. Theranostico, 2, 3, pp. 302 – 312.
Zonenshain L.P., Kuzmin M.I., and Natapov L.M., 1990. Geology of the USSR. A Plate Tectonic Synthesis. AGU Geodynam. Ser. Monogr. 21
Zuppero A., US. Department of Energy, Idaho National Engineering Laboratory - Discovery of Water Ice Nearly Everywhere in the Solar System.
Zwart H.J. and Dornsiepen U.F. 1980. The Variscan and pre - Variscan tectonic evolution of the Central and Western Europe: a Tentative Model. In J. Cogne and M. Slansky (Eds), Geology of Europe. B.R.G.M. Orleans. France. pp 226 - 232.
No comments:
Post a Comment