Wet bulb globe temperatures as high as 93°F or 34°C are forecast for July 28, 2025 18:00 UTC.
 |
| [ Wet bulb globe temperature forecast ] |
The forecast for this location is:

The image below is adapted from NOAA.

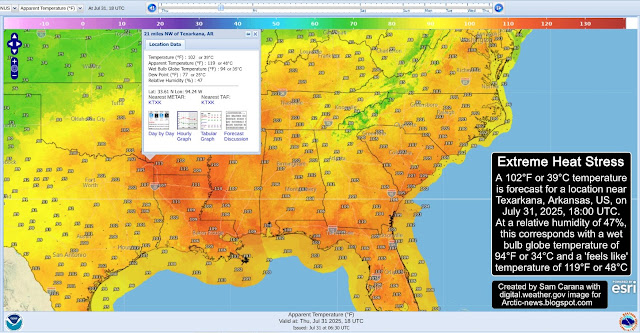
A 102°F or 39°C temperature is forecast for a location near Texarkana, Arkansas, US, for July 31, 2025, 18:00 UTC. At a relative humidity of 47%, this corresponds with a wet bulb globe temperature of 94°F or 34°C and a 'feels like' temperature of 119°F or 48°C, as illustrated by the image below.

Climate Emergency Declaration
The situation is dire and the precautionary principle calls for rapid, comprehensive and effective action to reduce the damage and to improve the situation, as described in this 2022 post, where needed in combination with a Climate Emergency Declaration, as discussed at this group.

Links
• NOAA (National Oceanic and Atmospheric Administration), National Weather Service
https://digital.weather.gov
• NOAA - heat risk graphics
https://www.wpc.ncep.noaa.gov/heatrisk/graphics
• Climate Reanalyzer
https://climatereanalyzer.org
• NOAA Weather Prediction Center, Day 3-7 Heat Index Forecast
https://www.wpc.ncep.noaa.gov/heatindex/heatindex.php
• High feels like temperature forecast (2024)
• Transforming Society
https://arctic-news.blogspot.com/2022/10/transforming-society.html
• Climate Plan
https://arctic-news.blogspot.com/p/climateplan.html
• Climate Emergency Declaration
https://arctic-news.blogspot.com/p/climate-emergency-declaration.html
 |
| [ Extreme heat stress ] |
- Wet bulb globe temperature : 93°F or 34°C
- Temperature : 100°F or 38°C
- Apparent Temperature : 116°F or 47°C
- Dew Point : 77°F or 25°C
- Relative Humidity : 50%
- Forecast for : July 28, 2025 18:00 UTC
- Temperature : 100°F or 38°C
- Apparent Temperature : 116°F or 47°C
- Dew Point : 77°F or 25°C
- Relative Humidity : 50%
- Forecast for : July 28, 2025 18:00 UTC
The image on the right is a same-day forecast for July 28, 2025 18:00 UTC, showing wet bulb globe temperatures as high as 93°F forecast for eight locations on the US East Coast (North and South Carolina and top part of Georgia).
Heat stress
Heat stress is the leading cause of weather-related deaths in the United States, as illustrated by the image below (credit: National Weather Service).

Numbers of heat fatalities may be conservative. Research finds that where heat is being listed as an official cause of death, this likely underestimates the full toll of these events. Extreme heat can trigger heart attacks and strokes. In addition, some heart disease risk factors, such as diabetes—as well as heart medications, such as diuretics and beta blockers—can affect a person’s ability to regulate their body temperature and make it difficult to handle extreme heat. The study finds that extreme heat accounted for about 600-700 additional deaths from cardiovascular disease annually. A study estimates that extreme heat accounted for 12,000 premature deaths in the contiguous U.S. from 2000 to 2010, and an analysis calculates that the summer 2022 heatwave killed 61,000 people in Europe alone.
Wet-bulb temperature
The human body can cool itself by sweating and the stronger the wind, the more one can cool off by sweating. As temperatures and humidity levels keep rising, a threshold can be reached where the wind factor no longer matters, in the sense that wind can no longer provide cooling. This physiological limit was long described as a 35°C wet-bulb temperature. i.e. once the wet-bulb temperature reaches 35°C, one can no longer lose heat by perspiration, even in strong wind, but instead the human body will start gaining heat from the air beyond a wet-bulb temperature of 35°C.
Accordingly, a 35°C wet-bulb temperature (equal to 95°F at 100% humidity or 115°F at 50% humidity) was long seen as the theoretical limit, the maximum a human could endure. A 2020 study (by Raymond et al.) warns that this limit could be regularly exceeded with a temperature rise of less than 2.5°C (compared to pre-industrial). A 2022 study (by Vecellio et al.) finds that the actual limit is lower — about 31°C wet-bulb or 87°F at 100% humidity — even for young, healthy subjects. The temperature for older populations, who are more vulnerable to heat, is likely even lower. In practice the limit will typically be lower and depending on circumstances could be as low as a wet-bulb temperature of 25°C.
High temperatures
The image below shows an image, adapted from Climate Reanalyzer, with maximum temperatures forecast as high as 109°F for the three days from July 26, 2025.
 |
| [ maximum three-day temperature forecast ] |
 |
| [ Maximum daily heat index forecast ] |
A 96°F or 36°C temperature is forecast for a location near Jackson, Mississippi, US, for July 30, 2025, 18:00 UTC. At a relative humidity of 64%, this corresponds with a wet bulb globe temperature of 94°F or 34°C and a 'feels like' temperature of 121°F or 49°C, as illustrated by the image below.

A 102°F or 39°C temperature is forecast for a location near Texarkana, Arkansas, US, for July 31, 2025, 18:00 UTC. At a relative humidity of 47%, this corresponds with a wet bulb globe temperature of 94°F or 34°C and a 'feels like' temperature of 119°F or 48°C, as illustrated by the image below.

A 116°F or 47°C temperature is forecast for a location at Needles, California, US, for August 7, 2025, 00:00 UTC. At a relative humidity of 18%, this corresponds with a wet bulb globe temperature of 93°F or 34°C and a 'feels like' temperature of 121°F or 49°C, as illustrated by the image below.

The above forecasts illustrate the huge difference that the relative humidity percentage can make.
Climate Emergency Declaration
The situation is dire and the precautionary principle calls for rapid, comprehensive and effective action to reduce the damage and to improve the situation, as described in this 2022 post, where needed in combination with a Climate Emergency Declaration, as discussed at this group.

Links
• NOAA (National Oceanic and Atmospheric Administration), National Weather Service
https://digital.weather.gov
https://www.wpc.ncep.noaa.gov/heatrisk/graphics
• Climate Reanalyzer
https://climatereanalyzer.org
• NOAA Weather Prediction Center, Day 3-7 Heat Index Forecast
https://www.wpc.ncep.noaa.gov/heatindex/heatindex.php
• High feels like temperature forecast (2024)
https://arctic-news.blogspot.com/2024/08/high-feels-like-temperature-forecast.html
• Wet Bulb Globe Temperature Tipping Point (2023)
https://arctic-news.blogspot.com/2023/07/wet-bulb-globe-temperature-tipping-point.html
• Wet Bulb Globe Temperature Tipping Point (2023)
https://arctic-news.blogspot.com/2023/07/wet-bulb-globe-temperature-tipping-point.html
• Transforming Society
https://arctic-news.blogspot.com/2022/10/transforming-society.html
• Climate Plan
https://arctic-news.blogspot.com/p/climateplan.html
• Climate Emergency Declaration
https://arctic-news.blogspot.com/p/climate-emergency-declaration.html


