Ocean currents keep pushing heat toward the Arctic Ocean
Arctic sea ice is getting very thin, as temperatures keep rising and ocean currents keep pushing heat toward the Arctic, as illustrated by the NOAA image below that shows sea surface temperatures as high as 33°C or 91.4°F on August 13, 2022.

The Gulf Stream is an ocean current that extends into the Arctic Ocean, as pictured below and discussed at this page. This ocean current is driven by the Coriolis force and by prevailing wind patterns.
 |
| [ from earlier post ] |
This ocean current contributes to the stronger and accelerating warming of the Arctic (compared to the rest of the world), which in turn causes deformation of the Jet Stream that can at times cause strong winds to speed up this ocean current. The image below shows the Jet Stream over the North Atlantic, where the ocean current dives under the sea ice. Sea surface temperature anomalies are much lower over the area where the deformed Jet Stream causes water to evaporate, thus cooling the surface.

The danger is that a cold freshwater lid grows at the surface of the North Atlantic that enables large amounts of salty, warm water to dive under the sea ice and enter the Arctic Ocean, as discussed earlier here, as well as here and at the feedbacks page.


Latent heat
Latent heat is ocean heat that is, or rather was previously consumed by melting of the sea ice underneath the sea surface.
Latent heat is ocean heat that is, or rather was previously consumed by melting of the sea ice underneath the sea surface.
 |
| [ The Latent Heat Buffer ] |
This ice has meanwhile all but disappeared, so without this latent heat buffer further incoming heat must go elsewhere, i.e. the heat will further raise the temperature of the water and it will also cause more evaporation to take place where the sea ice has disappeared altogether, and this in turn will further heat up the atmosphere over the Arctic.
The nullschool.net image below shows sea surface temperature anomalies from 1981-2011. At the green circle, anomalies were 16.1°C or 29°F on August 9, 2022. Back in 1981-2011, the temperature at that spot was 0°C.

Thin layer of sea ice
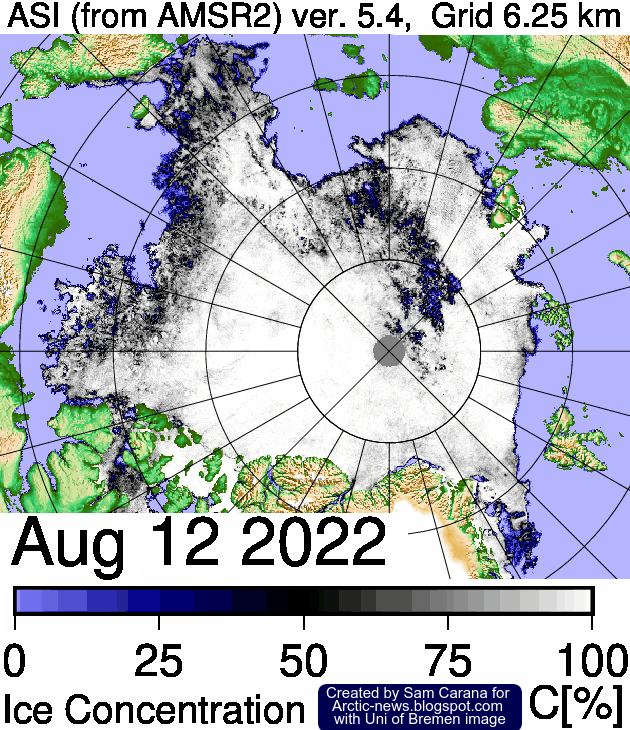
The image below, adapted from University of Bremen, shows Arctic sea ice concentration on August 12, 2022, with concentration in a large area close to the North Pole as low as 0%.
The image below, from NSIDC, also shows sea ice concentration on August 9, 2022.

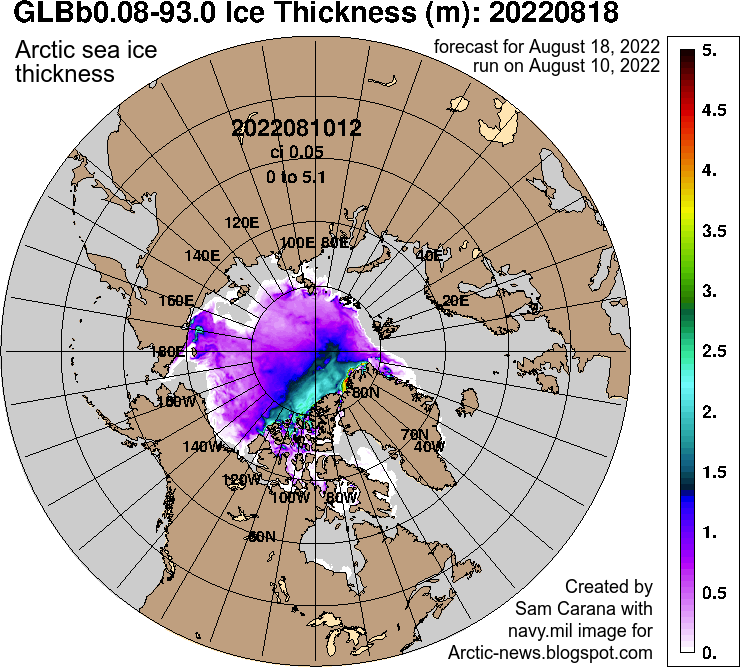
The Naval Research Laboratory image below, a forecast for August 18, 2022, run on August 10, 2022, shows that the sea ice is getting very thin.
Danger of methane eruptions
The navy.mil combination image below has three panels. The left panel shows the sea ice on August 30, 2012, the center panel shows the sea ice on August 30, 2015, and the right panel shows a forecast for the sea ice for August 21, 2022.
The navy.mil combination image below has three panels. The left panel shows the sea ice on August 30, 2012, the center panel shows the sea ice on August 30, 2015, and the right panel shows a forecast for the sea ice for August 21, 2022.
 |
| [ click on images to enlarge ] |
 |
| [ click on images to enlarge ] |
There still is a relatively extensive but very thin layer of sea ice present at the surface. This is also illustrated by the NSIDC image on the right that shows an Arctic sea ice extent of 6.438 million km² on August 11, 2022. This relatively large extent is mainly due to the suppression of air temperatures that comes with the current La Niña (see images further below).
As long as air temperatures are low enough to keep this surface ice frozen and as long as there are no strong winds pushing the ice out of the Arctic Ocean, this thin layer of ice will act as a seal, preventing transfer of heat from the Arctic Ocean to the atmosphere.

The larger the remaining sea ice is in extent, the less ocean heat can be transferred from the Arctic Ocean to the atmosphere, which means that more heat will remain in the Arctic Ocean.
 |
| [ The Buffer has gone, feedback #14 on the Feedbacks page ] |
The danger is that ocean heat keeps arriving in the Arctic Ocean, while the latent heat buffer is gone, causing more of this heat to reach sediments at the seafloor of the Arctic Ocean that threatens to destabilize hydrates in these sediment, resulting in methane eruptions both from these hydrates and from free gas underneath these hydrates.
Record high methane levels

Methane levels are already at record high and growth is accelerating, even without an extra burst of seafloor methane.
NOAA registered a globally averaged marine surface April 2022 mean of 1909.9 ppb, which is 18.7 ppb higher than April 2021, as illustrated by the image on the right. By comparison, the highest annual growth on the NOAA record is 18.31 ppb for 2021.

The MetOp satellite recorded a mean global methane level of 1971 ppb at 293 mb on August 11, 2022 am. When using a 1-year GWP of 200, this translates into 394.2 ppm CO₂e.
As the image underneath also shows, the MetOp satellite also recorded a peak methane level of 3009 ppb at 469 mb on August 9, 2022 pm.

Record high carbon dioxide levels
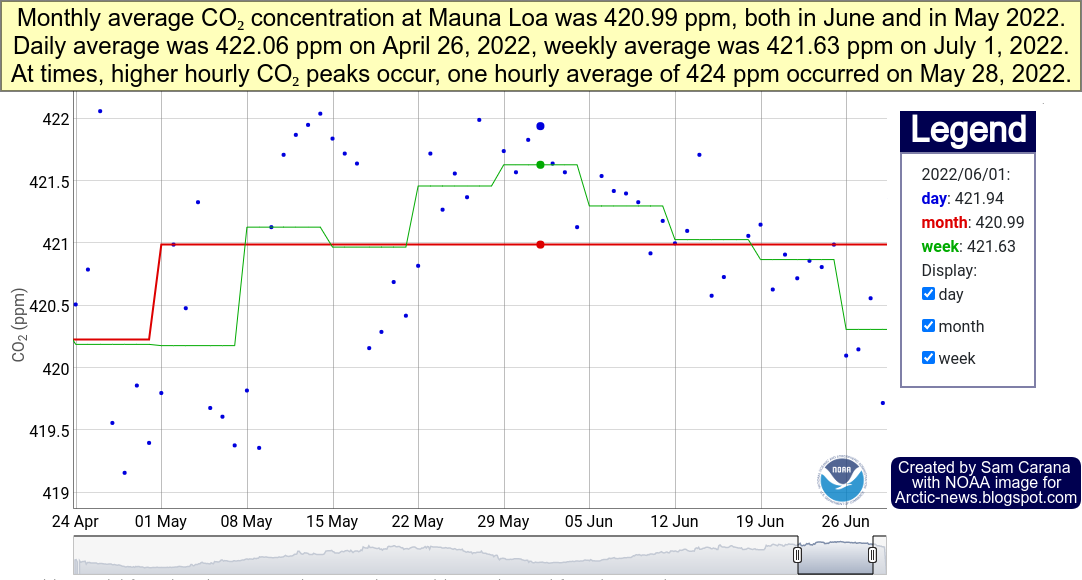
When adding this monthly CO₂ concentration of 420.99 ppm to the above 394.2 ppm CO₂e for methane, that gives a total of 815.19 ppm CO₂e.
Clouds feedback
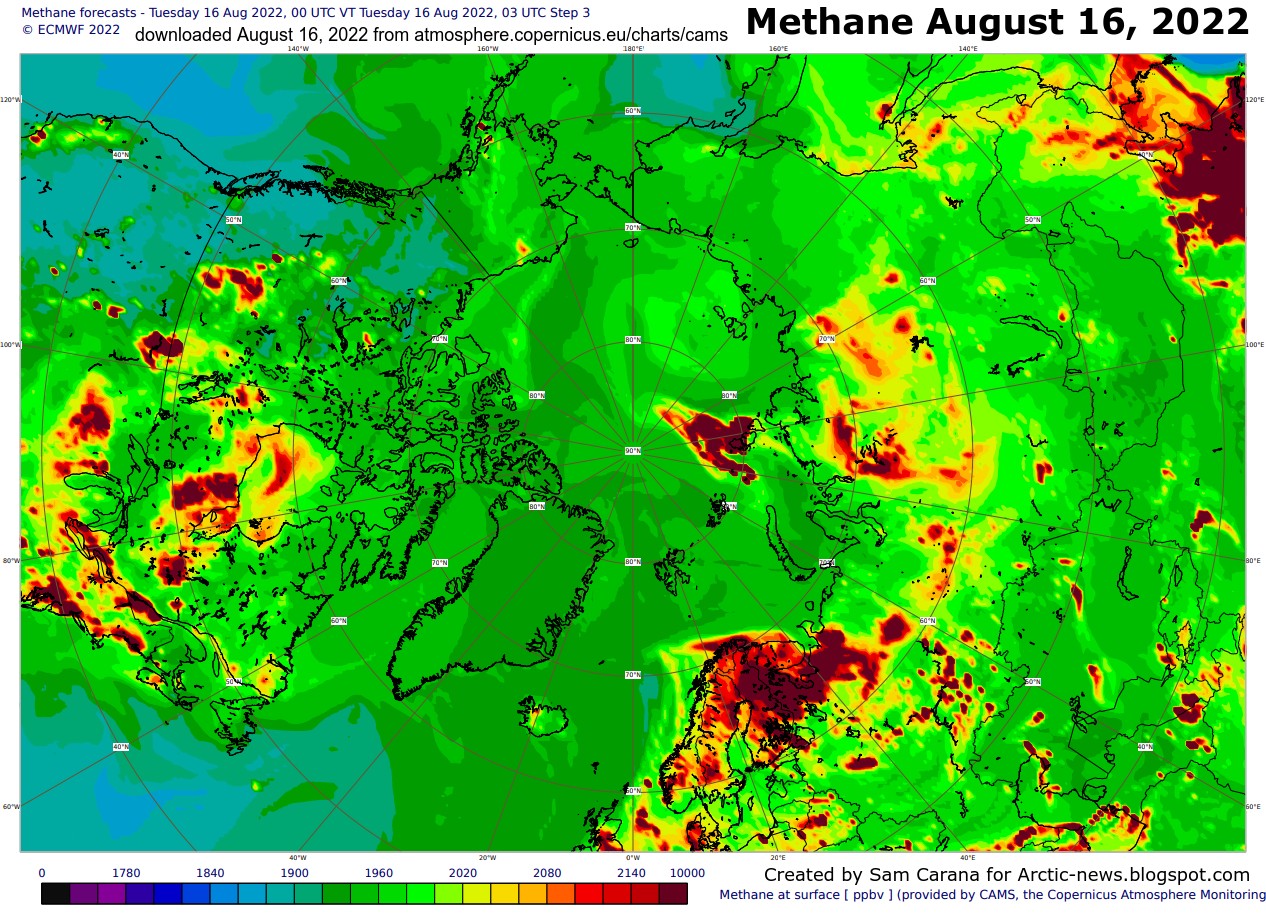
The image below shows methane at surface level, where the scale goes up to 10,000 ppb. At a 1-year global warming potential of 200, this top end of the scale translates into 2000 ppm CO₂e.
 |
| [ click on images to enlarge ] |

What makes the situation in the Arctic very dangerous is that there is very little hydroxyl in the air over the Arctic to break down methane.
Furthermore, the Arctic Ocean in many places is very shallow, especially off the coast of Siberia, as illustrated by the NOAA image on the right. Shallow waters enable hot surface water to be mixed down all the way to the seafloor.
Furthermore, the Arctic Ocean in many places is very shallow, especially off the coast of Siberia, as illustrated by the NOAA image on the right. Shallow waters enable hot surface water to be mixed down all the way to the seafloor.
 |
| [ click on images to enlarge ] |
This threatens to trigger destabilization of methane hydrates contained in sediments at the seafloor and result in eruption of huge amounts of methane from such hydrates as well as from free gas contained in sediments underneath the hydrates, as illustrated by the image on the right, from this page.
Abrupt eruption of an additional 5 Gt of methane from the seafloor of the Arctic Ocean would double the methane in the atmosphere.
Abrupt eruption of an additional 5 Gt of methane from the seafloor of the Arctic Ocean would double the methane in the atmosphere.

On its own, a 5 Gt eruption of seafloor methane could raise the global mean methane concentration by as much as 1971 ppb which, at a 1-year GWP of 200, would translate into another 394.2 ppm CO₂e and when added to the above 815.19 ppm CO₂e, adds up to a total of 1209.39 ppm CO₂e.
 |
| [ from earlier post, click on images to enlarge ] |
So, that would abruptly cause the joint CO₂e of just two greenhouse gases, i.e. methane and CO₂, to cross the 1200 ppm clouds tipping point globally and trigger a further 8°C global temperature rise, due to the clouds feedback alone.
There are further forcers and feedbacks to be taken into account, which means that the clouds tipping point could be crossed globally even with a far smaller abrupt release of seafloor methane. While it would take longer for the clouds tipping points to get crossed that way, the associated temperature rise could be enough to drive humans into extinctions well before the tipping point was even reached. A rise of 3°C above pre-industrial could occur on land and drive humans into extinction by 2025.
La Niña
 |
| [ adapted from NOAA - click on images to enlarge ] |
El Niños typically occur every 3 to 5 years, according to NOAA and as also illustrated by the NOAA image below, so the upcoming El Niño can be expected to occur soon.
The NOAA image below indicates that going from the bottom of a La Niña to the peak of an El Niño could make a difference of more than half a degree Celsius (0.5°C or 0.9°F).

Furthermore, the rise in sunspots from May 2020 to July 2025 could make a difference of some 0.15°C (0.27°F). The next El Niño looks set to line up with a high peak in sunspots, in a cataclysmic alignment that could push up the temperature enough to cause even more dramatic sea ice loss in the Arctic, resulting in runaway temperature rise.
Conclusion
In conclusion, there is a growing risk that methane will erupt from the seafloor of the Arctic Ocean and cause a dramatic rise in temperature.
Even without such eruption of methane from the seafloor of the Arctic Ocean, temperatures look set to rise strongly soon, as we move into an El Niño and face a peak in sunspots. The resulting temperature rise could drive humans extinct as early as in 2025 with temperatures continuing to skyrocket in 2026, making it in many respects rather futile to speculate about what will happen beyond 2026.
At the same time, the right thing to do now is to help avoid the worst things from happening, through comprehensive and effective action as described in the Climate Plan.
Arctic sea ice (previous months)
https://arctic-news.blogspot.com/2022/06/arctic-sea-ice-june-2022-why-situation-is-so-dangerous.html
Further links
• Jet Stream
https://arctic-news.blogspot.com/p/jet-stream.html
https://arctic-news.blogspot.com/p/cold-freshwater-lid-on-north-atlantic.html
• NOAA - ENSO: Recent Evolution, Current Status and Predictions
https://www.cpc.ncep.noaa.gov/products/analysis_monitoring/lanina/enso_evolution-status-fcsts-web.pdf
• NOAA - Monthly Temperature Anomalies Versus El Niño
https://www.cpc.ncep.noaa.gov/products/analysis_monitoring/lanina/enso_evolution-status-fcsts-web.pdf
• NOAA - Monthly Temperature Anomalies Versus El Niño
https://www.ncei.noaa.gov/access/monitoring/monthly-report/global/202207/supplemental/page-4
• University of Bremen
https://seaice.uni-bremen.de/databrowser
• nullschool
https://earth.nullschool.net
• Naval Research Laboratory
https://www7320.nrlssc.navy.mil/GLBhycomcice1-12/arctic.html
• Warning of mass extinction of species, including humans, within one decade
• Cold freshwater lid on North Atlantic
• Albedo, latent heat, insolation and more
https://arctic-news.blogspot.com/p/albedo.html
• Latent Heat Buffer
https://arctic-news.blogspot.com/p/latent-heat.html
• Feedbacks in the Arctic
https://arctic-news.blogspot.com/p/feedbacks.html
• Clouds feedback
https://arctic-news.blogspot.com/p/clouds-feedback.html
• How much time is there left to act?
• University of Bremen
https://seaice.uni-bremen.de/databrowser
• NSIDC - Arctic sea ice concentration
• NSIDC - Chartic, interactive sea ice graph
• NOAA - Trends in Atmospheric Methane
• nullschool
https://earth.nullschool.net
https://www7320.nrlssc.navy.mil/GLBhycomcice1-12/arctic.html
• Understanding the Permafrost–Hydrate System and Associated Methane Releases in the East Siberian Arctic Shelf - by Natalia Shakhova et al. (2019)
https://www.mdpi.com/2076-3263/9/6/251
https://www.mdpi.com/2076-3263/9/6/251
• Warning of mass extinction of species, including humans, within one decade
• Cold freshwater lid on North Atlantic
https://arctic-news.blogspot.com/p/albedo.html
• Latent Heat Buffer
https://arctic-news.blogspot.com/p/latent-heat.html
• Feedbacks in the Arctic
https://arctic-news.blogspot.com/p/feedbacks.html
• Clouds feedback
https://arctic-news.blogspot.com/p/clouds-feedback.html
• How much time is there left to act?
https://arctic-news.blogspot.com/p/how-much-time-is-there-left-to-act.html
• Sunspots
https://arctic-news.blogspot.com/p/sunspots.html
• Cataclysmic Alignment
https://arctic-news.blogspot.com/2022/06/cataclysmic-alignment.html
• Human Extinction by 2025?
https://arctic-news.blogspot.com/2022/07/human-extinction-by-2025.html
• Extinction
https://arctic-news.blogspot.com/p/extinction.html
• Climate Plan
https://arctic-news.blogspot.com/p/climateplan.html