Tuesday, July 28, 2015

Storms Over Arctic Ocean

The image below shows sea surface temperature anomalies over the Arctic on July 27, 2015.

departure from 1961-1990 temperatures, click on image to enlarge ]
The image below shows sea surface temperature anomalies on July 28, 2015.

[ departure from 1971-2000 temperatures, click on image to enlarge ]

There is a growing chance that the sea ice will collapse over the next few weeks, due to heavy melting and storms speeding up the flow of sea ice out of the Arctic Ocean into the Atlantic Ocean.

An example of such storms is shown on the animation below. This is a forecast for July 31, 2015, showing cyclonic winds at the center of the Arctic Ocean, with strong winds moving sea ice down Fram Strait.


The above situation alone is not likely to trigger sea ice collapse. It is more likely to be short-lived. However, there is a growing possibility for such storms to emerge and drive the melting sea ice out of the Arctic Ocean into the Atlantic Ocean.

As the situation in the Arctic further deteriorates, feedbacks can be expected to kick in with growing strength.

One of these feedbacks is the growing amount of heat (due to both latent heat and albedo changes) that will have to be absorbed by the Arctic Ocean as the sea ice disappears, and that will accelerate warming of the water of the Arctic Ocean.

Another feedback is a changing jet stream, as illustrated in above animation. This, in combination with the presence of more open water, can be expected to cause increasingly intense storms over the Arctic to emerge. Such storms can bring more heat into the Arctic Ocean, especially during heatwaves over North America and Russia. Such heatwaves can further cause surface heat to be mixed down to the seafloor, especially in the many places where the Arctic Ocean is very shallow. This can in turn cause destabilization of hydrates, resulting in huge amounts of methane to be abruptly released from the seafloor.

Methane itself is yet another feedback that will accelerate warming in the Arctic, in turn threatening to trigger further methane releases in a spiral of self-reinforcing positive feedback loops.

The situation is dire and calls for comprehensive and effective action as discussed at the Climate Plan.


Sea surface temperatures over the Arctic on July 27, 2015. There is a growing chance that the sea ice will collapse over...
Posted by Sam Carana on Tuesday, July 28, 2015

Saturday, July 25, 2015

Arctic Ocean Temperatures Keep Rising

People's emissions are causing the planet to heat up and more than 93% of this heat goes into the oceans.

People have measured ocean temperatures for a long time. Reliable records go back to at least 1880. Ever since records began, the oceans were colder than they are now. NOAA analysis shows that, on the Northern Hemisphere, the 20th century average for June is 16.4°C (61.5°F). In June 2015, it was a record 0.87°C (1.57°F) higher.

Back in history, there have been times when it was warmer. The last time when it was warmer than today, during the Eemian Period, peak temperature was only a few tenths of a degree higher than today, according to the IPCC. In those days, there was huge melting, accompanied by extreme storms and sea levels that were 5 to 9 m higher than today.


In many ways, the situation now already looks worse than it was in the Eemian. "The warm Atlantic surface current was weaker in the high latitude during the Eemian than today", says Henning Bauch.

Carbon dioxide levels during the Eemian were well under 300 ppm. So, there could well have been more pronounced seasonal differences then, i.e. colder winters that made that the average ocean temperature didn't rise very much, despite high air temperature in summer. By contrast, today's high greenhouse levels make Earth look set for a strong ocean temperature rise.

As illustrated by above image, contained in ocean temperature data from 1880 for the Northern Hemisphere is a polynomial trendline that points at a rise of almost 2°C by 2030. This indicates that temperatures across the Arctic Ocean could soon be even higher than the peak temperature was back in the Eemian Period. Indeed, the Arctic Ocean temperature is rising at a terrifying pace, the more so given that there seems to be no end in sight soon for this rise. 


This rise of almost 2°C by 2030 is not limited to the month of June. As above image shows, it applies to the 12-months period from July 2014 to June 2015 as well.

In some places, the Arctic Ocean is already very warm. Sea surface temperatures around North America have increased to very high levels and they are threatening to further raise the temperature of the Arctic Ocean.

The Arctic sea ice is on the verge of collapse, as discussed in earlier posts such as this one and this one. This dramatic decline of the sea ice in 2015 is the result of a combination of factors, including:
  1. High levels of greenhouse gases over the Arctic Ocean, as illustrated by the screenshot below showing high carbon dioxide concentrations over the Arctic (from NASA video).


    Furthermore, methane levels are very high over the Arctic. An earlier image showed methane levels as high as 2512 parts per billion on July 17, 2015, with high methane levels north of Greenland that also showed up on an earlier image at this post.

  2. High levels of ocean heat in the North Atlantic, as illustrated by the image below showing high sea surface temperatures off the east coast of North America; much of this ocean heat will be carried by the Gulf Stream into the Arctic Ocean over the next few months.


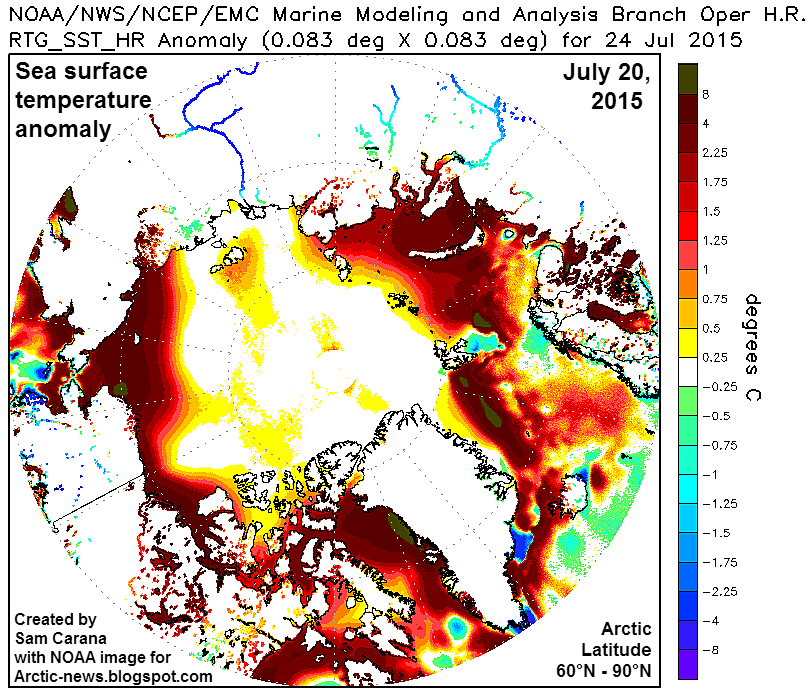
  3. High sea surface temperatures in the Arctic Ocean, as illustrated by the image below.

  4. High air temperatures over North America and Russia extending over the Arctic Ocean, as illustrated by the image below showing a location well inside the Arctic Circle where temperatures as high as 37.1°C (98.78°F) were recorded on July 2, 2015. (green circle).


  5. Wildfires triggered by these heatwaves resulting in darkening compounds settling on snow and ice, making it more prone to melting, as illustrated by the image below showing smoke reaching high up into the Beaufort Sea on July 22, 2015.


  6. Very warm river water running into the Arctic Ocean, as illustrated by the image below, showing sea surface temperatures as high as 19°C (66.2°F) off the coast of Alaska on July 19, 2015. 
The danger is that collapse of the sea ice will further accelerate warming in the Arctic, as sunlight that was previously reflected back into space and heat that previously went into melting then will all be absorbed by the Arctic. Furthermore, more open waters will increase the possibility of storms that can mix surface heat down to the bottom of the seafloor, and destabilize sediments that contain large amounts of methane in hydrates and free gas.

Such feedbacks are further discussed at the feedbacks page, including the danger that further warming of the Arctic Ocean will unleash huge methane eruptions from the Arctic Ocean seafloor, in turn driving temperatures up even higher and causing more intense wildfires, heatwaves and further extreme weather events.

The image below shows a non-linear trend that is contained in the temperature data that NASA has gathered over the years, as described in an earlier post. A polynomial trendline points at global temperature anomalies of over 4°C by 2060. Even worse, a polynomial trend for the Arctic shows temperature anomalies of over 4°C by 2020, 6°C by 2030 and 15°C by 2050, threatening to cause major feedbacks to kick in, including albedo changes and methane releases that will trigger runaway global warming that looks set to eventually catch up with accelerated warming in the Arctic and result in global temperature anomalies of 16°C by 2052.

[ click on image to enlarge ]
The situation is dire and calls for comprehensive and effective action, as discussed at the Climate Plan.


People's emissions are causing the planet to heat up and more than 93% of this heat goes into the oceans. People have...
Posted by Sam Carana on Saturday, July 25, 2015

Friday, July 24, 2015

Thick Sea Ice Dislodged

As the comparison image below shows, the last bit of thick sea ice has become dislodged from its location in the Canadian Archipelago and is forecast to be floating along with the sea ice in the Arctic Ocean. The left panel shows the situation on July 19, 2015, while the right panel shows a forecast for July 31, 2015, run on July 23, 2015.


One reason for this development is of course the heavy melting that has taken place in this area. But what has made this thick sea ice move so strongly? The reason for this is a combination of wind, sea currents and meltwater running off the coasts of North America and Greenland. This has been persistently pushing this thick ice in this direction, as illustrated by the Naval Research Laboratory animation below.


The Naval Research Laboratory animation below shows sea ice thickness over a 30-day timespan, including a forecast up to 31 July, 2015, run July 23, 2015.


The screenshot below from arctic-io shows the sea ice on July 23, 2015, with an inset showing a rotated outcut from a Naval Research Laboratory ice thickness map for that date.
[ click on image to enlarge ]
The animation below shows a 5-day forecast of ice speed and drift up to July 27, 2015, starting from and run on July 23, 2015.


Furthermore, there has been a lot of smoke from wildfires in North America for some time. The image below shows smoke reaching far into the Beaufort Sea on July 22, 2015.


When smoke settles on snow and ice, it decreases albedo and makes it more prone to melting.

Seismic activity could also have contributed to this development. As the snow and ice cover on land disappears, isostatic rebound occurs, i.e. the land moves upward. Furthermore, an earthquake with a magnitude of 3.6 on the Richter scale was registered in Baffin Bay on July 22, 2015.


Above animation shows the last bit of thick sea ice becoming dislodged from its location in the Canadian Archipelago, from July 21, 2015, through to July 24, 2015.


Albert Kallio comments: "The more ice moves, the more heat it can pick up from the ocean - and melt. Also, the overturning of sea water in the ocean increases in the increasingly open sea areas - bringing heat up to the surface - and into contact with ice that then melts faster."

[ hat tip to Patrick McNulty for contributions to this post ] 


The last bit of thick sea ice has become dislodged from its location in the Canadian Archipelago and is forecast to be...
Posted by Sam Carana on Friday, July 24, 2015

Tuesday, July 21, 2015

Ocean Temperatures At Record High

Of all the excess heat that results from people's emissions, 93.4% goes into oceans. Accordingly, ocean heat has strongly increased over the years.

NOAA analysis shows that, for the oceans on the Northern Hemisphere, the June 2015 sea surface temperature was at a record high 0.87°C (1.57°F) above the 20th century average of 16.4°C (61.5°F), as also illustrated by the graph below.


The most recent 12-month period, July 2014–June 2015, also broke the record (set just last month) for the all-time warmest 12-month period in the 135-year period of record. 


As the above image shows, sea surface temperature anomalies around North America are very high, threatening to further raise temperatures of the Arctic Ocean, which already has very high sea surface temperatures, as also illustrated by the image below. 


As the image below shows, sea surface temperatures as high as 19°C (66.2°F) were recorded in the Bering Strait on July 19, 2015.


The snow depth comparison below shows the situation on July 20, 2015, on the left and a forecast for July 27, 2015, on the right. The green lines indicate areas where sea ice is at melting point. Note the decline of snow cover on Greenland and the Himalayas.


As the continued snow decline on Greenland also illustrates, high temperatures can be expected to keep causing further decline of the snow and ice cover for many weeks to come, given that the minimum sea ice extent is typically reached about half September.

As the image below shows, sea surface temperatures as high as 10.1°C (50.1°F) were recorded in Baffin Bay, off the west coast of Greenland, on July 20, 2015.


On July 21, 2015, temperatures as high as 14°C (57.1°F) were recorded east of Svalbard, an anomaly of 9.7°C (17.4°F), as illustrated by the image below, created with nullschool.net images.


The danger is that warm water will enter the Arctic Ocean and cause the Arctic sea ice to collapse, which could make the Arctic Ocean absorb even more heat. This could unleash huge methane eruptions from the Arctic Ocean's seafloor, in turn driving temperatures up even higher and causing more extreme weather events, wildfires, etc.

The situation is dire and calls for comprehensive and effective action, as discussed at the Climate Plan


For the oceans on the Northern Hemisphere, the June 2015 sea surface temperature was at a record high 0.87°C (1.57°F)...
Posted by Sam Carana on Tuesday, July 21, 2015