Thursday, January 10, 2013

Anthropogenic Arctic Volcano can calm climate

by Paul Beckwith
Paul Beckwith, B.Eng, M.Sc. (Physics),
Ph.D. student (Climatology) and
Part-time Professor, University of Ottawa
 

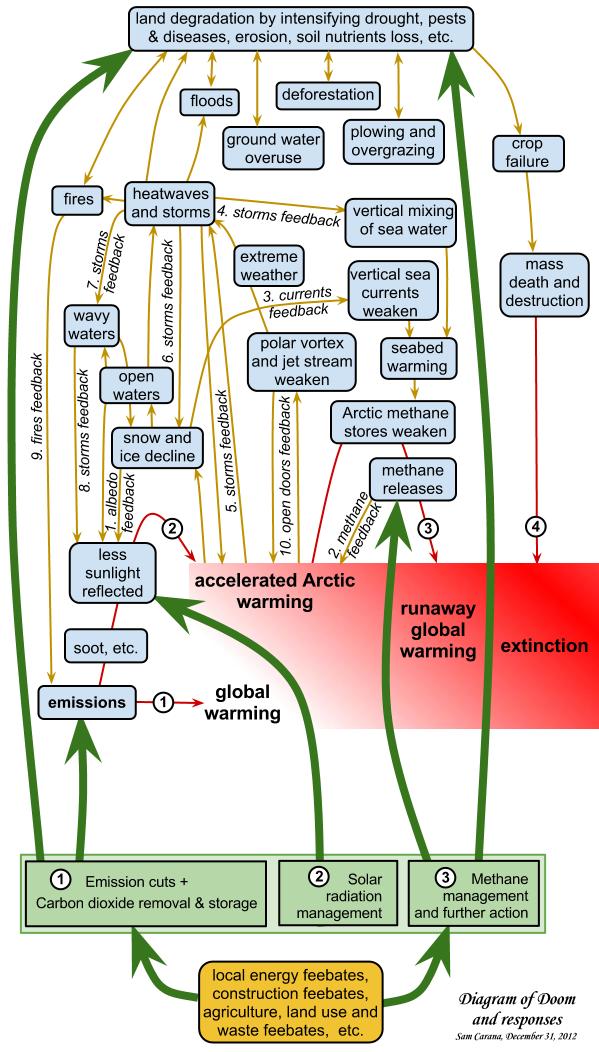
Rational decision making requires realistic risk assessments of alternatives. Humanity is now choosing default door A, which is no change in behavior with fossil fuel energy sourcing and a continuance of rapidly rising anthropogenic greenhouse gas emissions (GHGs).

Abrupt collapse of Arctic albedo due to collapsing terrestrial snow cover (area dropping 17.6% per decade for past three decades) and collapse of sea ice cover (area dropping 49% below 1979 to 2000 long term average) is occurring (NOAA 2012 Arctic Report Card from last week).

The destination is an ice free condition within a few years (by 2015 with PIOMAS volume projections); well before the 30 to 60 year timeframe of the most sophisticated climate change models which are a big FAIL on sea ice. The risk (= probability of occurrence x significance of occurrence) is enormous through door A. Probability of occurrence is 50% within 3 years and significance to human farming, water availability, temperatures and weather extremes is clearly massive.

A recent widely-respected DARA report states that Today climate change is directly/indirectly reducing global GDP by 1.6% and attributing to 400,000 human deaths globally (to increase to 2.6% and 500,000 in about 20 years). A recent UN report is warning of global food shortages in 2013. There is no end in sight to the U.S. drought (climate models predict such droughts can last 20 or 30 years, hopefully they are wrong as they are with sea ice).

I prefer door B - create an Anthropogenic Arctic volcano to calm the climate. Give me two large airplanes with pilots, some sulfur in solution, and a few large nozzles from your local ski hill; they are not needed anyway since the ski industry has estimated losses of $1 Billion over the last decade (about 8% of total revenues); adaptation to zip lining and water parks is possible. With this equipment I will fly into the stratosphere (above the weather) near the North Pole and spread sulfur dust/aerosols to reflect incoming sunlight and rapidly cool the Arctic for several years. This will restore sea ice, straighten the jet streams, and restore a “normal” climate.

Very little sulfur is needed relative to huge emissions from smokestacks into the lower atmosphere from coal burning power plants. It will work; powerful erupting volcanoes that aim upwards (like Pinatubo in 1991) and not sideways (like Mt. St. Helens in 1980) have cooled the climate by a degree or more for 2 to 3 years. They do this by injecting sulfur up into the upper atmosphere, like our aircraft will do.

Door B has two important sub-doors, B-Bad and B-Good. Door B-B is using the sulfur injections to calm climate and continuing the fossil-fuel energy sourcing with rapidly accelerating GHGs. This door will be a false reprieve since the GHGs will continue to rapidly acidify the ocean and destroy the base of the food chain; by the way, ocean phytoplankton levels have dropped 40% since 1950.

Wikipedia image: UN jet with humanitarian relief supplies
Luckily for us, Door B-G exists. Door B-G is using the sulfur injections to calm climate and rapidly slashing fossil-fuel energy sourcing by ramping up conservation, efficiency renewables as fast as is humanly possible; I am talking about retooling on the scale of the Manhattan Project or Apollo Programs. Or even having a U.S. president (or a Chinese one) getting all the CEOs of car manufacturers together in a room and telling them they will produce no cars for 3 years, only wind turbines, geothermal heat exchangers, and solar panels. Is this possible? In WWII the meeting occurred and for the next 3 years only war materials were produced. And keep in mind the industrial revolution of World War Two ushered in one of longest eras of prosperity humanity has known.

Of course there is a caveat with Door B-G. We must start the sulfur injections when the sun rises in the Arctic in the spring in early 2013. Waiting for more sea ice collapse will decrease the odds of success at obtaining Arctic snow cover and sea ice regrowth. Give me a plane, pilot, nozzle, and sulfur and I can calm the climate.

Originally posted January 10, 2013, at Sierra Club Canada; posted here with author's permission

Wednesday, January 2, 2013

Turning forest waste into biochar

Too much biomass waste in tundra and boreal forests makes them prone to wildfires, especially when heatwaves strike. Furthermore, leaving biomass waste in the forest can cause a lot of methane emisions from decomposition.

In order to reduce such methane emissions and the risk of wildfires, it makes sense to reduce excess biomass waste in fields and forests. Until now, this was typically done by controlled burning of biomass, which also causes emissions, but far less than wildfires do. Avoiding wildfires is particularly important for the Arctic, which is vulnerable to soot deposits originating from wildfires in tundra and boreal forest. Such soot deposits cause more sunlight to be absorbed, accelerating the decline of snow and ice in the Arctic.


A team of scientists at University of Washington, sponsored by the National Science Foundation, has developed a way to remove woody biomass waste from forests without burning it in the traditional way. The team has developed a portable kiln that can be assembled around a heap of waste wood and convert it to biochar on the spot, while the biochar can also be burried in the soil on the spot.

Demonstration in Kerby, Oregon,
Nov. 6, 2012, 
 by Carbon Cultures
Credit:
Marcus Kauffman at Flickr
The team initially started testing the effectiveness of a heat-resistant blanket thrown over woody debris.  The team then developed portable panels that are assembled in a kiln around a slash pile.

Students have set up a company, Carbon Cultures, to promote the technology and to sell biochar. CEO of Carbon Cultures is Jenny Knoth, also a Ph.D. candidate in environmental and forest sciences.

The kiln restricts the amount of oxygen that can reach the biomass, which is transformed by pyrolysis into biochar. The woody waste is heated up to temperatures of about 1,100 degrees Fahrenheit (600 Celsius), as the kiln transforms some 800 pounds of wood into 200 pounds of biochar in less than two hours. “We also extinguish with water because it helps keep oxygen out and also activates the charcoal [making it more fertile in soil].”

Currently, the total costs of disposing of forest slash heaps (the collections of wood waste) approximate a billion dollars a year in the United States, according to Knoth.

And of course, adding biochar to the soil is a great way to reduce carbon dioxide levels in the atmosphere. “Biochar is proven to fix carbon for hundreds of thousands of years,” Knoth said.
Demonstration in Kerby, Oregon, November 6, 2012, organized by Carbon Cultures Credit: Marcus Kauffman at Flickr

As said, when biomass waste is left in the open air, methane emissions are produced during its decomposition. Moreover, such waste will fuel wildfires, which produce huge amounts of emissions. The traditional response therefore is to burn such waste. Pyrolyzing biomass produces even less greenhouse gases and less soot, compared to such controlled burning.

Biochar is produced in the process, which can be added to the soil on the spot. This will help soil retain moisture, nutrients and soil microbes, making forests more healthy, preventing erosion and thus reduces the risk of wildfires even further, in addition to the reduction already achieved by removal of surplus waste.

A healthy forest will retain more moist in its soil, in the air under its canopy, and in the air above the forest through expiration, resulting in more clouds that act as sunshades to keep the forest cool and return the moist to the forest through rainfall. Forests reinforce patterns of air pressure and humidity that result in long-distance air currents that bring moist air from the sea inland to be deposited onto the forest in the form of rain. Finally, clouds can reflect more sunlight back into space, thus reducing the chance of heatwaves.

References

Recycling wood waste - The Daily of the University of Washington
Helping Landowners with Waste Wood While Improving Agribusiness and Energy - National Science Foundation

Related

- Biochar
- CU-Boulder gets into biochar


Monday, December 31, 2012

How to avoid mass-scale death, destruction and extinction

The image below shows the FAO Food Price Index (Cereals), updated to October 2012.

[ image from earlier post ]

The above FAO Food Price Index shows that high food prices have been around for the past few years. The FAO, in its recent Cereal Supply and Demand Brief, explains that we can expect prices to rise, as illustrated below.


The Economic Research Service of the U.S. Department of Agriculture mentions, in its Food Price Outlook, 2012-2013, that the "drought has affected prices for corn and soybeans as well as other field crops which should, in turn, drive up retail food prices".

Global food supply is under stress as extreme weather becomes the new norm. Farmers may be inclined to respond to drought by overusing ground water, or by slashing and burning forest, in efforts to create more farmland. Such practices do not resolve the problems; instead, they tend to exacerbate the problems over time, making things progressively worse.

The diagram below shows that there are many climatological feedbacks (ten of which are pictured) that make climate change worse. At the top, the diagram pictures vicious cycles that are responses by farmers that can add to make the situation even worse. Without effective action, the prospect is that climate change and crop failure combine to cause mass death and destruction, with extinction becoming the fourth development of global warming.

How can we avoid that such a scenario will eventuate? Obviously, once we are in the fourth development, i.e. mass-scale famine and extintion, it will be too late for action. Similarly, if the world moves into the third development, i.e. runaway global warming, it will be hard, if not impossible to reverse such a development. Even if we act now, it will be hard to reverse the second development, i.e. accelerated warming in the Arctic.

The most effective action will target causes rather than symptoms of these developments.

Part 1. Since emissions are the cause of global warming, dramatic cuts in emissions should be included in the first part of the responses. In addition, action is needed to remove excess carbon dioxide from the atmosphere and oceans. Storing the carbon in the soil will also improve soil quality, as indicated by the long green arrow on the left.

Part 2. Solar radiation management is needed to cool the Arctic.

Part 3. Methane management and further action is needed, e.g. to avoid that methane levels will rise further in the Arctic, which threatens to trigger further releases and escalate into runaway global warming. Measures to reduce methane can also benefit soil quality worldwide, as indicated by the long green arrow on the right.

Thus, the proposed action tackles the prospect of mass death and extinction by increasing soil fertility, as illustrated by the image below.


As indicated at the bottom of the image, the most effective policies to accomplish the goals set out in both part 1. and part 3. are feebates, preferably implemented locally.

Sunday, December 30, 2012

High methane levels persist in December 2012

The image below was posted earlier at Methane contributes to accelerated warming in the Arctic. As mentioned there, this is a compilation of images produced by Dr. Leonid Yurganov, comparing methane levels between November 21-30, 2008 (below left), and November 21-30, 2012 (below right).


Dr. Yurganov has released two further images this year, i.e. for December 1-10, 2012 (below left), and for December 11-20, 2012 (below right).


The images show that the highest methane levels show up above the water, as opposed to above land, indicating that methane is being released from the seabed across the Arctic. The images further show that high levels of methane persist in December 2012.

Apart from comparing 10-day periods, we can also look at methane levels for individual days. The NOAA image below shows methane levels up to 2167 ppb on December 27, 2012, for the morning set of measurements.

To better see where the high (yellow) levels of methane were measured, a map with empty data is added below, showing the location of the continents more clearly on the map.


Pressure levels at which measurements are taken are displayed in hectopascals (symbol hPa) which are numerically equivalent to millibars (mb). A pressure of 600 mb (or hPa) corresponds with an altitude of 13794.9 ft (4204.7 m). By comparison, air pressure at mean sea level is 1013.25 hPa (millibar), or 29.92 inches of mercury.

The map below, from apocalypse4realmethane2012, shows methane measurements taken on the same day (December 27, 2012, morning set), but at 718 mb, which corresponds with an altitude that is a bit closer down to sea level. The map focuses on the Arctic and shows geographic names. If you like, click on the map to enlarge it.


Methane measurements were taken with the IASI (Infrared Atmospheric Sounding Interferometer) instrument, fitted onto the European Space Agencys (ESA) MetOp series of polar orbiting satellites.


For further analysis, the NOAA image with surface temperature anomalies for December 28, 2012, is added above, showing anomalies up to 20 degrees Celsius. Furthermore, the NOAA image with sea surface temperature anomalies for December 27, 2012, is added below, showing anomalies up to 5 degrees Celsius.

Friday, December 28, 2012

Albedo changes in the Arctic

How global warming and feedbacks are causing huge albedo changes in the Arctic.

Snow cover decline

Decline of the snow cover on land in the northern hemisphere is accelerating, as illustrated by the image below and the image underneath on the right. (1)


Image credit: Rutgers University
Fresh snow can have an albedo as high as 0.85, meaning that up to 85% of the sunlight falling on snow can get reflected back into space. As the snow melts, its structure changes making it less reflective, i.e. its albedo will go down, to as low as 40%. (2)

As a result, more sunlight gets absorbed, accelerating the melting process. Eventually, where snow melts away, spots of bare soil become exposed, and dark wet soil has a very low albedo, reflecting only between 5% and 15% of the sunlight. Thus, even more sunlight gets absorbed and the soil's temperature increases, causing more of the remaining snow to melt. (2)

Changes in vegetation can further accelerate this process. Russia's boreal forest - the largest continuous expanse of forest in the world - has seen a transformation in recent years from larch to conifer trees. Larch trees drop their needles in the fall, allowing the vast, snow-covered ground in winter to reflect sunlight and heat back into space and helping to keep temperatures in the region very cold. But conifers such as spruce and fir retain their needles, which absorb sunlight and increase the forest's ground-level heat retention. (3)

Albedo, from Wikipedia
A conversion from larch to evergreen stands in low-diversity regions of southern Siberia would generate a local positive radiative forcing of 5.1±2.6 W m−2. This radiative heating would reinforce the warming projected to occur in the area under climate change. (4)

Tundra in the Arctic used to be covered by a white blanket of snow most of the year. However, as the landscape is warming up, more trees and shrubs appear. Scientists who studied part of the Eurasian Arctic, found that willow and alder shrubs, once stunted by harsh weather, have been growing upward to the height of trees in recent decades. They now rise above the snowfall, presenting a dark, light-absorbing surface. This increased absorption of the Sun's radiation, combined with microclimates created by forested areas, adds to global warming, making an already-warming climate warm even more rapidly. (5 & 6)

Furthermore, encroachment of trees onto Arctic tundra caused by the warming may cause large release of carbon to the atmosphere, concludes a recent study. This is because tundra soil contains a lot of stored organic matter, due to slow decomposition, but the trees stimulate the decomposition of this material. (7)


Sea ice decline

In the Arctic, sea ice volume has fallen dramatically over the years, as illustrated by the image on the right. The trend points at 2014 as the year when Arctic sea ice will first reach zero volume for some time during that year. (8)

The Arctic Ocean looks set to be ice-free for a period of at least three months in 2015 (August, September and October), and for a period of at least 6 months from the year 2020 (June through to November). (9)

Decline of the Arctic sea ice is accelerating, due to numerous feedbacks. As the Arctic atmosphere warms up, any snow cover on top of the ice will melt away ever quickly, decreasing the surface albedo and thus reinforcing the warm-up. As melt ponds appear on top of the ice, the albedo will drop even further.

Sam Carana's Diagram of Doom pictures ten feedbacks that jointly work to accelerate sea ice decline. (10)

The image below shows the three areas where albedo change will be felt most in the Arctic, i.e. sea ice loss, decline of albedo in Greenland and more early and extensive retreat of snow and ice cover in other areas in the Arctic. (8)

Big changes in the Arctic within years, by Sam Carana


References

1. Northern Hemisphere Snow Cover Anomalies 1967-2012 June, Rutgers University
climate.rutgers.edu/snowcover/chart_anom.php?ui_set=1&ui_region=nhland&ui_month=6

2. Albedo, Albedo Change blog
albedochange.blogspot.com/2009/02/albedo-change.html

3. Shift in Northern Forests Could Increase Global Warming, Scientific American, March 28, 2011
scientificamerican.com/article.cfm?id=shift-northern-forests-increase-global-warming

4. Sensitivity of Siberian larch forests to climate change, Shuman et al., April 5, 2011, Wiley.com
onlinelibrary.wiley.com/doi/10.1111/j.1365-2486.2011.02417.x/abstract

5. Warming turns tundra to forest
ox.ac.uk/media/news_stories/2012/120604.html

6. Eurasian Arctic greening reveals teleconnections and the potential for structurally novel ecosystems, Macias-Fauria et al., 2012
nature.com/nclimate/journal/v2/n8/full/nclimate1558.html

7. Expansion of forests in the European Arctic could result in the release of carbon dioxide, University of Exeter news, June 18, 2012
exeter.ac.uk/news/featurednews/title_214902_en.html

8. Big changes in the Arctic within years, Sam Carana, October 26, 2012, Arctic-News blog
arctic-news.blogspot.com/2012/10/big-changes-in-arctic-within-years.html

9. Getting the Picture, Sam Carana, August 2012, Arctic-News blog
arctic-news.blogspot.com/2012/08/getting-the-picture.html

10. Diagram of Doom, Sam Carana, August 2012, Arctic-News blog
arctic-news.blogspot.com/2012/08/diagram-of-doom.html


Further reading

- Albedo change in the Arctic
arctic-news.blogspot.com/2012/07/albedo-change-in-arctic.html

- Greenland is melting at incredible rate
arctic-news.blogspot.com/2012/07/greenland-is-melting-at-incredible-rate.html

- Albedo change in the Arctic threatens to cause runaway global warming
arctic-news.blogspot.com/2012/10/albedo-change-in-the-arctic-threatens-to-cause-runaway-global-warming.html

Friday, December 21, 2012

Methane contributes to accelerated warming in the Arctic


Above combination image featured earlier in the post Striking increase of methane in the Arctic. The images were produced by Dr. Leonid Yurganov, Senior Research Scientist, JCET, UMBC, who presented his findings at the AGU Fall Meeting 2012. The image below gives an update for 2012, showing an image with methane levels at 600 hPa.


Temperature anomalies on the inset on above image are averages for the full month November, whereas the methane levels displayed on the left are for the first ten days of November only. Using temperature maps for the same periods in such comparisons may result in even more striking simularities between methane levels and temperatures. For a more complete picture, further comparisons between November 2008 and November 2012 are added, for days 11-20 (below),


and for days 21-30 (below).


The images show that the highest methane levels show up above the water, as opposed to above land, indicating that methane is being released from the seabed across the Arctic.

Temperatures have meanwhile changed. In November 2012, there were high temperature anomalies in east Siberia. There now are very low temperatures throughout Siberia, as illustrated by the Wunderground map below, which shows high temperatures. Temperatures as low as -60.5°F (-51.4°C) were recorded in Susuman, east Siberia, both on December 13th and 17th, 2012.


The now hugely deformed polar jet stream and high levels of methane in the Arctic are only two out of numerous feedbacks that contribute to accelerate warming in the Arctic. Without rapid action, we can expect such wild swings in temperature to get even worse, making more extreme weather the new norm.

Thursday, December 20, 2012

Polar jet stream appears hugely deformed


World climate zones used to be kept well apart by jet streams. On the northern hemisphere, the polar jet stream was working hard to separate the Tundra and Boreal climate zones' colder air in the north from the Temperate climate and the Subtropical climate zones' warmer air in the south.

NOAA image
The greater the difference in temperature between north and south, the faster the jet streams spin around the globe, the polar jet stream at about 60°N and the subtropical jet stream at about 30°N, as illustrated on above image. 

NOAA image
The polar jet stream used to move at speeds of up to 140 miles per hour, while following a relatively straight track that was meandering only slightly, i.e. with waves that go up and down only a little bit.

Accordingly, the Northern Temperate Zone used to experience only mild differences between summer and winter weather, rather than the extreme hot or cold temperatures that we've experienced recently.

Accelerated warming in the Arctic is decreasing the difference in temperature between the Arctic and the Northern Temperate Zone. This is causing the polar jet to slow down and become more wavy, i.e. with larger loops, as illustrated by the NASA image further below.
Polar jet stream (blue) & subtropical
jet stream (red) - NOAA image

                   Diagram of Doom, Sam Carana
This is a feedback of accelerated warming in the Arctic that reinforces itself. As the jet stream slows down and its waves become more elongated, cold air can leave the Arctic more easily and come down deep into the Northern Temperate Zone. Conversily, more warm air can at the same time move north into the Arctic.

The 'open doors' feedback further decreases the difference in temperature between the Arctic and the Northern Temperate Zone, in turn further slowing down the jet stream and making it more wavy, and thus further accelerating warming in the Arctic.

The polar jet stream can travel at speeds greater than 100 mph. Here, the fastest winds are colored red; slower winds are blue. View animated version here. Credit: NASA/Goddard Space Flight Center
How does this affect temperatures? If we look at the average surface temperature anomalies for the month November 2012, we see huge differences in temperatures. Areas in the East Siberian Sea and in east Siberia registered average surface temperature anomalies for November 2012 of about 10 degrees Celsius, compared with 1951-1980. At the same time, areas in Alaska and Canada have been experiencing anomalies of about -10 degrees Celsius.


This suggests a hugely deformed polar jet stream, as indicated by the contour lines on above image on the right. This is very worrying, as this is only one out of many feedbacks that come with accelerated warming in the Arctic. There are at least ten such feedbacks, as depicted in the diagram below, from the earlier post Diagram of Doom.

       Diagram of Doom, Sam Carana
One of the most frightening feedbacks is the albedo loss in the Arctic. The speed at which changes are taking place can be illustrated with the image below, from the earlier post Big changes in the Arctic within years.


The urgency to act is perhaps best expressed by means of the two images below, which can constitute a fitting end-of-year message if you like to share them further. The image below highlights that Arctic sea ice minimum volume in 2012 was only 19.3% what it was in 1979. The background image, prepared by Wipneus, shows an exponential trend projecting a 2013 minimum of only 2000 cubic km of sea ice, with a margin of error that allows Arctic sea ice to disappear altogether next year, i.e. nine months from now.

Finally, the image below highlights that, in 2012, Arctic sea ice area fell by 83.7% in just 168 days, again illustrating how fast things can eventuate. 


For more quotes, see the page at http://arcticmethane.blogspot.com/p/quotes.html

Earlier posts:
Opening the Doorways to Doom