Showing posts sorted by relevance for query high methane levels over. Sort by date Show all posts

Friday, November 17, 2023

Arctic Ocean Heatstroke

[ discussed at facebook ]
The above image illustrates how much hotter October 2023 was in the Northern Hemisphere, compared to October in other years. The temperature in October 2023 was more than 2°C above October in 1880-1920, in the Northern Hemisphere, even with 3 years smoothing. Note that 1880-1920 is not pre-industrial, when using a base that is genuinely pre-industrial, the anomaly would be even higher.


The above image, adapted from Climate Reanalyzer, and the image below, adapted from NASA, both use the same 1951-1980 baseline to illustrate the October 2023 temperature anomaly.


Anomalies are very high, especially over the Arctic Ocean, which reflects the enormous amounts of heat that are transferred from the Arctic Ocean to the atmosphere.

There are further reasons behind the very high anomalies over the Arctic, one of which is methane, which has risen very fast over the years.

The image on the right illustrates methane's historic rise, showing IPCC and, more recently, WMO data. Methane (CH₄) reached 1923 parts per billion (ppb) in 2022, 264% of the 1750 level, while carbon dioxide (CO₂) reached 417.9 parts per million (ppm) in 2022, 150% of the 1750 level, and nitrous oxide (N₂O) reached 335.8 ppb, 124% of the 1750 level.

This image below shows some very high hourly average methane levels recently recorded at Barrow, Alaska.


The image below shows high monthly methane levels at Mauna Loa, Hawaii, U.S. 


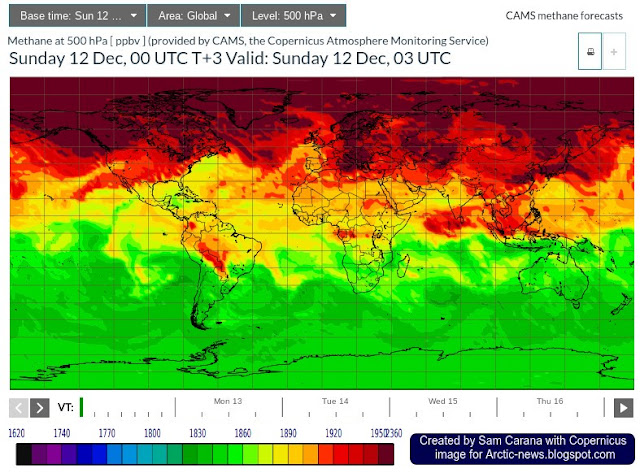
The image below, created with a Copernicus forecast for November 15, 2023 03 UTC, shows very high methane levels over the Arctic at 500 hPa.


The image below shows that the NOAA-20 satellite recorded high methane levels over the Arctic Ocean, especially north of Alaska, on November 15, 2023 AM at 399.1 mb.

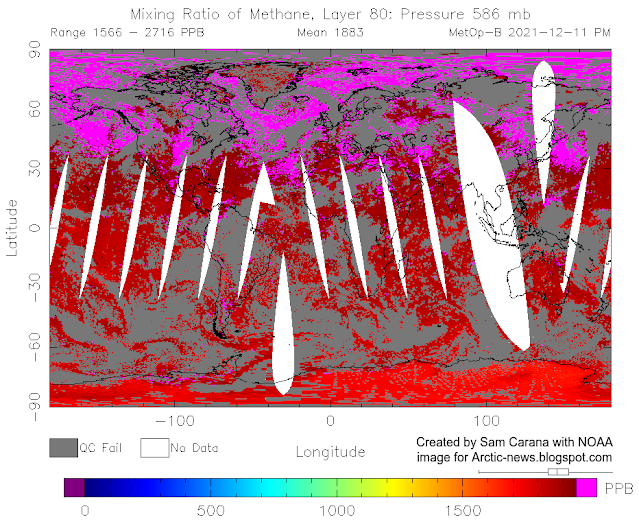
The image below shows methane levels as high as 2700 ppb recorded by the MetOp-B satellite on November 17, 2023 PM at 293 mb.


The image below shows high methane levels over Greenland recorded by the MetOp-B satellite on November 18, 2023 PM at 399 mb.


The image below shows mean methane levels of 1942 ppb recorded by the MetOp-B satellite on November 19, 2023 PM at 399 mb.


The Argo Float 6904087 compilation image below illustrates that the highest water temperatures in the Arctic Ocean can occur at a depth of about 250 meters.

[ click on images to enlarge ]
The Argo Float 6901934 compilation image below illustrates that the highest water temperatures in the Arctic Ocean can occur at a depth of about 250 meters.

[ click on images to enlarge ]
Arctic Ocean surface temperatures are strongly influenced by air temperatures and seasons, ranging from more than 10°C to as low as -1.8°C when there is sea ice.

[ from earlier post ]
By contrast, the water temperature below the surface can remain stable throughout the year at close to 0°C all the way down to 2000 meters without freezing, due to higher salinity. However, the water temperature can be well above 0°C throughout the year at a depth of a few hundred meters, which is worrying since much of the water is less than 200 m deep where the continental shelves extend into the Arctic Ocean (light blue map on the right) and methane hydrates at the seafloor there could instantly be destabilized by a sudden influx of warm water from the North Atlantic. 

Over the next few months, as sea ice keeps growing in extent, this seals off the Arctic Ocean from the atmosphere. This makes it harder for heat to get transferred from the Arctic Ocean to the atmosphere and increases the danger that more heat will reach sediments located at the seafloor and cause methane to be released from hydrates as well as methane that is present in the form of free gas underneath the hydrates.

The danger is illustrated by the image below, adapted from Climate Reanalyzer, which shows a rise in temperature (2 m) by 2100 compared to 1852-1900 using a CMIP6 SSP585 model. 


[ image from the Extinction page ]
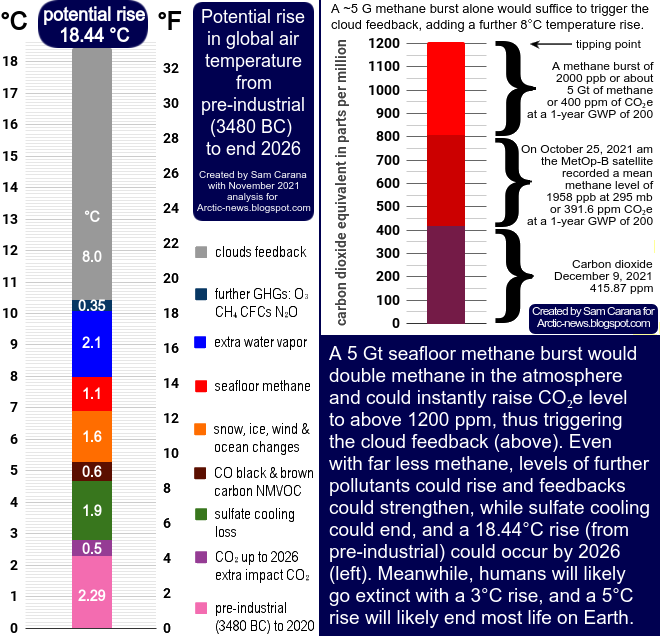
Note that none of the bases used in the above images is pre-industrial, neither 1880-1920, nor 1951-1980, nor 1852-1900. Using a base that is genuinely pre-industrial base would result in even higher anomalies. The image on the right shows a 2.29°C 2020 anomaly from 3480 BC.  

Note also that even a small temperature rise (of less than 1°C) can destabilize a vulnerable methane hydrate, which can cause an eruption that in turn can destabilize neighbouring hydrates, resulting in a self-reinforcing feedback loop of methane releases, including methane in the form of free gas from underneath the hydrates. This can drive up temperatures very rapidly. 

Seafloor methane is only one out of many elements that could jointly cause a temperature rise of over 10°C within a few years, in the process causing the clouds tipping point to get crossed that can push up the temperature rise by a further 8°C, as illustrated by the image on the right, from the extinction page.

Conclusion

The precautionary principle calls for comprehensive and effective action to reduce the damage and to improve the situation, along the lines of this 2022 post in combination with a declaration of a climate emergency.


Links

• Climate Reanalyzer
https://climatereanalyzer.org/research_tools/monthly_maps

• NASA Temperature anomaly October 2023

• WMO Greenhouse Gas Bulletin No. 19 – 15 November 2023

• Copernicus - Methane forecasts


Friday, February 1, 2013

Dramatic increase in methane in the Arctic in January 2013

Below a combination of images produced by Dr. Leonid Yurganov, showing methane levels January 1-10, 2013 (below left), January 11-20, 2013 (below center) and January 21-31, 2013 (below right).

Click on image to enlarge
Above image shows dramatic increases of methane levels above the Arctic Ocean in the course of January 2013 in a large area north of Norway.

Why are these high levels of methane showing up there? To further examine this, let's have a look at where the highest sea ice concentrations are. The image below shows sea ice concentrations for January 2013, from the National Snow and Ice data Center (NSIDC).


Overlaying methane measurements with sea ice concentrations shows that the highest levels of methane coincide with areas in the Arctic Ocean without sea ice. This is shown on the animation below, which is a 1.84 MB file that may take some time to fully load.

Sunday, August 11, 2013

Dramatic rise in methane levels since end July 2013

There has been a dramatic rise in methane levels since end July 2013. The image below pictures methane levels above 1950 ppb on the Northern Hemisphere from 12 p.m. August 9, 2013, to 12 a.m. August 10, 2013.


[ click on image to enlarge ]
Quite suddenly, readings above 1950 ppb have become commonplace since July 31, 2013.


The chart below illustrates the dramatic jump in methane levels that occurred since July 31, 2013. The chart shows the area (square km) with methane readings over 1950 ppb for selected layers, over the period from July 24, 2013, to August 9, 2013. The chart further below shows that peak methane levels have increased dramatically.

Particularly worrying are high levels of methane over the Arctic Ocean, such as on the image below showing methane levels over 1950 ppb in yellow for selected layers on August 5, 2013 (a.m.).
[ click on image to enlarge ]
Methane levels are also very high on the Southern Hemisphere, as illustrated by the image below on the right. High readings have featured over the heights of Antarctica for quite some time, but the high levels of methane over the oceans on the Southern Hemisphere have only shown up recently. They could be caused by one or more methane hydrates getting destabilized in the ocean between Antarctica and South America.
[ click on image to enlarge ]
Peter Carter sent the image below, edited from NOAA Earth System Research Laboratory, showing high (and rising) methane levels in Pallas Sammaltunturi (north Scandinavia), measured with surface flasks.

Peter also added the image below, pointing at high methane levels in Lac La Biche, Northern Alberta, Canada. What to make of it?, Peter adds, It is not far from the Tar Sands - that does have a methane problem, but it is basically wetland peat region vicinity which is why I checked it.

Friday, August 7, 2015

Record High Methane Levels

[ click on images to enlarge ]
As the top image shows, sea surface temperature anomalies in the Bering Strait on August 4, 2015, were as high as 8.7°C (15.6°F). Such high anomalies are caused by a combination of ocean heat, of heatwaves over Alaska and Siberia extending over the Bering Strait, and of warm river water run-off.

As the image on the right shows, sea surface temperatures in the Bering Strait were as high as 20.5°C (69.1°F) on August 4, 2015.

As warm water flows through the Bering Strait into the Arctic Ocean, it dives under the sea ice and becomes harder to detect by satellites that typically measure water temperatures at the surface, rather than below the surface.

The image below shows sea surface temperature anomalies from 1971 to 2000, for August 6, 2015, as visualized by Climate Reanalyzer.


Climate Reanalyzer applies a mask over sea-ice-covered gridcells, reducing anomalies in such cells to zero.

Below is a NOAA image, for August 5, 2015, also with anomalies from 1971 to 2000.


Below is another NOAA image, showing anomalies for August 6, 2015. Because the base period is 1961 to 1990, the anomalies are higher. Nonetheless, the yellow areas that feature around the North Pole on above image do not show up on the image below.


In other words, looking at sea surface temperatures alone may lead to underestimations of the temperatures of the water underneath the sea ice. Keeping that in mind, have a look again at the high anomalies on the image below.


The danger is that further decline of the sea ice will lead to rapid warming of the Arctic Ocean, while the presence of more open water will also increase the opportunity for strong storms to develop that can mix high sea surface temperatures all the way down to the seafloor, resulting in destabilization of sediments and triggering releases of methane that can be contained in such sediments in huge amounts.

The image below shows that global mean methane levels as high as 1840 parts per billion (ppb) were recorded on August 4, 2015. Peak methane levels that day were as high as 2477 ppb.


This peak level of 2477 ppb isn't the highest recorded the year. As the image below shows and as discussed in a previous post, methane levels as high as 2845 ppb were recorded on April 25, 2015. The average of the daily peaks for this year up to now is 2355 ppb. Very worrying about the above image are the high levels of methane showing up over the Arctic Ocean.


As above image also shows, the mean methane level of 1840 ppb is in line with expectations, as methane levels rise over the course of the year, to reach a maximum in September. This mean level of 1840 ppb is higher than any mean level since records began.

The image below shows all the World Meteorological Organisation (WMO) annual means that are available, i.e. for the period 1984 through to 2013.


As above image shows, a polynomial trendline based on these WMO data (for the period 1984 through to 2013) points at a doubling of mean global methane levels by about 2040. The added NOAA data are the highest mean in 2014, i.e. 1839 ppb recorded on September 7, 2014, and the above-mentioned level of 1840 ppb recorded on August 4, 2015.

As said, mean global methane levels last year reached its peak in September and the same is likely to occur this year. In other words, this new record is likely to be superseded by even higher levels soon.

The image on the right shows the steady rise of the highest mean daily methane levels that have been recorded recently, indicating that a continued rise can be expected that would put another highest mean level for 2015 on the trendline of above image soon.

Again, the danger is that a warming Arctic Ocean will trigger further methane releases from the seafloor, leading to rapid local warming that in turn will trigger further methane releases, in a vicious cycle of runway warming.

As illustrated by the image on the right, at a 10-year timescale, the current global release of methane from all anthropogenic sources exceeds all anthropogenic carbon dioxide emissions as agents of global warming.

Over the next decade or so, methane emissions are already now more important than carbon dioxide emissions in driving the rate of global warming, and this situation looks set to get worse fast.

Unlike carbon dioxide, methane's GWP does rise as more of it is released. Higher methane levels cause depletion of hydroxyl, which is the main way for methane to be broken down in the atmosphere.

The situation is dire and calls for comprehensive and effective action as discussed at the Climate Plan.  


The image shows all the World Meteorological Organisation (WMO) annual means that are available, i.e. for the period...
Posted by Sam Carana on Friday, August 7, 2015

Sunday, December 12, 2021

Terrifying Arctic methane levels

A peak methane level of 3026 ppb was recorded by the MetOp-B satellite at 469 mb on December 11, 2021 am.

This follows a peak methane level of 3644 ppb recorded by the MetOp-B satellite at 367 mb on November 21, 2021, pm.


A peak methane level of 2716 ppb was recorded by the MetOp-B satellite at 586 mb on December 11, 2021, pm, as above image shows. This image is possibly even more terrifying than the image at the top, as above image shows that at 586 mb, i.e. much closer to sea level, almost all methane shows up over sea, rather than over land, supporting the possibility of large methane eruptions from the seafloor, especially in the Arctic. 

Also, the image was recorded later than the image at the top with the 3026 ppb peak, indicating that even more methane may be on the way. This appears to be confirmed by the Copernicus forecast for December 12, 2021, 03 UTC, as illustrated by the image below, which shows methane at 500 hPa (equivalent to 500 mb).


Furthermore, very high methane levels have recently been recorded at Barrow, Alaska, as illustrated by the image below, showing monthly averages.


And carbon dioxide levels have also been very high recently at Barrow, Alaska, as illustrated by the image below, showing daily averages. 


What causes these terrifying methane levels?

As the combination image below shows, the sea surface temperature north of Svalbard was as high as 4.3°C (or 39.74°F, green circle in the left panel) on December 12, 2021, i.e. as much as 5°C (or 9°F, green circle in the right panel) higher than 1981-2011.

[ click on images to enlarge ]

As temperatures in the Arctic keep rising faster than elsewhere in the world, the Jet Stream gets ever more distorted. The image on the right shows a heavily distorted Jet Stream covering most of the Northern Hemisphere on December 13, 2021, with sea surface temperatures off the coast of North America as much as 10.7°C (or 19.2°F, at the green circle) higher than 1981-2011.

At times, this can lead to very strong winds that push huge amounts of heat from the North Atlantic into the Arctic Ocean.

The image on the right is a forecast for December 14, 2021, showing strong wind causing waves as high as 8.3 m (or 27.2 ft) off the coast of Norway, speeding up the flow of warm water as it dives underneath the sea ice north of Svalbard. 

Huge amounts of heat can thus move into the Arctic Ocean, driven by ocean currents and temperature differences.

The danger is that warmer water will cause methane to erupt from the seafloor of the Arctic Ocean, as an earlier post warned.

[ The buffer is gone, from earlier post ]

Sea ice used to act as a buffer, by consuming energy in the process of melting, thus avoiding that this energy could raise the temperature of the water of the Arctic Ocean. As above image indicates, the buffer has now virtually disappeared. 

As sea ice gets thinner, ever less sea ice can act as a buffer. This is also illustrated by the 30-day navy.mil animation (up to November 12, the last 8 days are forecasts) on the right, from an earlier post.

Furthermore, huge amounts of heat did get transferred to the atmosphere over the Arctic Ocean, while and as long as sea ice was low in extent.

The image on the right, also from that earlier post, shows the October 2021 temperature anomaly, with anomalies over the Arctic showing up of as much as 9.1°C.

As the sea ice animation also shows, lower air temperatures after September caused the sea ice to grow in extent, effectively sealing off the Arctic Ocean and reducing heat transfer from the Arctic Ocean to the atmosphere.

Heat that was previously melting the ice or that was getting transferred to the atmosphere is now instead heating up the water. Some 75% of ESAS (East Siberian Arctic Shelf) is shallower than 50 m. Being shallow, these waters can easily warm up all the way down to the sea floor, where heat can penetrate cracks and conduits, destabilizing methane hydrates and sediments that were until now sealing off methane held in chambers in the form of free gas in these sediments.

Sealed off from the atmosphere by sea ice, greater mixing of heat in the water will occur down to the seafloor of the Arctic Ocean.

[  From the post September 2015 Sea Surface Warmest On Record ]
There are some further factors that can contribute to the high methane levels over the Arctic. As the sea ice grows in extent, this results in less moisture evaporating from the water, which together with the change of seasons results in lower hydroxyl levels at the higher latitudes of the Northern Hemisphere, in turn resulting in less methane getting broken down in the atmosphere over the Arctic.

Also, as land around the Arctic Ocean freezes over, less fresh water will flow from rivers into the Arctic Ocean. As a result, the salt content of the Arctic Ocean increases, all the way down to the seafloor of the Arctic Ocean, making it easier for ice in cracks and passages in sediments at the seafloor to melt, allowing methane contained in the sediment to escape. Meanwhile, salty and warm water (i.e. warmer than water that is present in the Arctic Ocean) keeps getting carried along the track of the Gulf Stream into the Arctic Ocean.

The threat

[ The Buffer has gone, feedback #14 on the Feedbacks page ]
The threat is that some of the extra heat will reach sediments at the seafloor of the Arctic Ocean that contain huge amounts of methane in currently still frozen hydrates and in pockets of gas underneath.

Cracks and holes in these sediments that are filled with ice can, as the ice melts away, become passageways for heat to destabilize hydrates, causing an eruption of gas as the methane expands to 160 times its frozen volume. The shockwave resulting from such an eruption can then destabilize neighboring hydrates.

This process threatens to result in ever more methane getting released, as illustrated in the image on the right, from an earlier post.


NOAA's most recent global mean methane reading is 1890.9 ppb for August 2021, with a trend of 1894.8 ppb. Meanwhile, NOAA's global mean methane level will have risen further (December levels are typically more than 10 ppb higher than August levels), while NOAA's data are also for marine surface measurements, and more methane tends to accumulate at higher altitudes. 

In other words, the current global mean of methane is now above 1900 ppb. Given that methane's concentration is rising at accelerating pace (see image right), the implication is that in an expanding troposphere, the volume of methane and thus its greenhouse effect will be rising even faster. 

A study published November 2021 in Science Advances finds a continuous rise of the tropopause in the Northern Hemisphere over 1980–2020, resulting primarily from tropospheric warming. 

As illustrated by the image below, methane on December 26 am, 2021, reached a global mean of 1939 ppb between 293 mb and 280 mb, while the highest peak level (2554 ppb) was reached higher in the atmosphere, at 218 mb.


[ click on images to enlarge ]
The animation on the right, showing methane on December 31, 2021 am, may be helpful in analysis of the origin of these terrifying methane levels.

The CO₂ level at Mauna Loa was 415.87 ppm on December 9, 2021. The MetOp-B satellite recorded a mean methane level of 1958 ppb on October 25, 2021 am at 295 mb, and when using a 1-year GWP of 200, this translates into 391.6 ppm CO₂e. Together, that's 391.6 + 415.87 = 807.47 ppm CO₂e.  

Now add an additional 5 Gt of methane from an abrupt eruption of the seafloor, which is only 10% of the 50Gt that Natalia Shakhova et al. warned about long ago, while 50 Gt is in turn only a small fraction of all the methane contained in sediments in the Arctic. Such an eruption of seafloor methane would raise the global mean methane concentration by almost 2000 ppb which, at a 1-year GWP of 200, would translate into 400 ppm CO₂.

So, that would abruptly cause the joint CO₂e of methane and CO₂ to cross the 1200 ppm clouds tipping point, triggering a further 8°C global temperature rise, due to the clouds feedback


A 5 Gt seafloor methane burst would double the methane in the atmosphere and could instantly raise CO₂e level to above 1200 ppm, thus triggering the cloud feedback (panel top right). Even with far less methane, levels of further pollutants could rise and feedbacks could strengthen, while sulfate cooling could end, and a 18.44°C rise (from pre-industrial) could occur by 2026 (left panel). Meanwhile, humans will likely go extinct with a 3°C rise, and a 5°C rise will likely end most life on Earth.


Conclusion

The situation is dire and calls for the most comprehensive and effective action, as described at the Climate Plan.


Links

• NOAA Infrared Atmospheric Sounding Interferometer (IASI) Sounding Products

• CAMS, the Copernicus Atmosphere Monitoring Service
https://atmosphere.copernicus.eu/charts/cams

• Carbon Cycle Gases, NOAA, Barrow Atmospheric Baseline Observatory, United States

• Nullschool.net

• Warning of mass extinction of species, including humans, within one decade


• Human Extinction by 2022?

• The Methane Threat
https://arctic-news.blogspot.com/2017/04/the-methane-threat.html

• High methane levels over the Arctic Ocean on January 14, 2014

• NOAA mean global monthly methane

• The Importance of Methane

• SCRIPPS - The Keeling Curve

• Will COP26 in Glasgow deliver?

• Continuous rise of the tropopause in the Northern Hemisphere over 1980–2020 - by Lingyun Meng et al.

• Frequently Asked Questions

• When Will We Die?