Sunday, November 23, 2014

IPCC too conservative?


Earlier this month, the Intergovernmental Panel on Climate Change (IPCC) released its 5th Assessment Report (AR5), stating that: "Surface temperature is projected to rise over the 21st century under all assessed emission scenarios. It is very likely that heat waves will occur more often and last longer, and that extreme precipitation events will become more intense and frequent in many regions. The ocean will continue to warm and acidify, and global mean sea level to rise. Many aspects of climate change and associated impacts will continue for centuries, even if anthropogenic emissions of greenhouse gases are stopped. The risks of abrupt or irreversible changes increase as the magnitude of the warming increases."

That does sound scary. So, what would happen if the IPCC's projections are too conservative? Could humans, together with many other species, go extinct within the next few decades? What are the risks that this could eventuate? Below follows an assessment using graphics by Sam Carana.


1. Ocean Heat

Below is what the IPCC says:


Below is a graph produced by Sam Carana, based on NOAA data. For more background, see this earlier post.


2. Sea level Rise

The image below shows what the IPCC says.


If ocean heat will continue to rise as pictured in the image by Sam Carana, then thermal expansion alone will cause more sea level rise than foreseen by the IPCC. Furthermore, extensive melting on Antarctica and Greenland can result in additional sea level rise. Below is a sea level rise graph produced by Sam Carana, based on NASA/GSFCs data, as discussed in this earlier post.


3. Arctic Sea Ice

The image below shows what the IPCC says.


If ocean heat will continues to rise as pictured in the image by Sam Carana, then Arctic sea ice will disappear much earlier than anticipated by the IPCC. An exponential trendline based on sea ice volume observations shows that sea ice looks set to disappear in 2019, while disappearance in 2015 is within the margins of a 5% confidence interval, reflecting natural variability.


A linear trend would be inappropriate, given the growing impact of feedbacks that can each be expected to reinforce sea ice decline, while there can also be interaction between these feedbacks, further accelerating sea ice decline. Albedo change is one such feedback, but there are numerous other ones, such as storms that have more chance to grow stronger as the area with open water increases.

In conclusion, an exponential trendline is more appropriate than a linear trendline, as also illustrated by above comparison, which shows that a linear trendline has 9 years fall outside its 95% confidence ionterval, versus 4 years for an exponential trendline, as discussed at the FAQ page.

Rapid decline of the snow and ice cover on the Northern Hemisphere is furthermore supported by rapidly rising surface temperatures over the Arctic, as well as greater intensity of heatwaves. Below is what the IPCC says on this.


Before further discussing surface temperatures, let's look into one of the feedbacks that could hugely increase temperatures, methane.


4. Methane

The IPCC appears to underestimate of the amount of methane that is contained in sediments under the Arctic Ocean and prone to be released as temperatures rise, as discussed in this earlier post and at this page. In an absurd articulation of contradictionary logic, the IPCC writes on the one hand that there is little consensus on the likelihood of abrupt changes over the 21st century, while on the other hand the IPPC declares with 'high confidence' that it is very unlikely that methane from clathrates will undergo catastrophic release during the 21st century, as discussed in this earlier post.

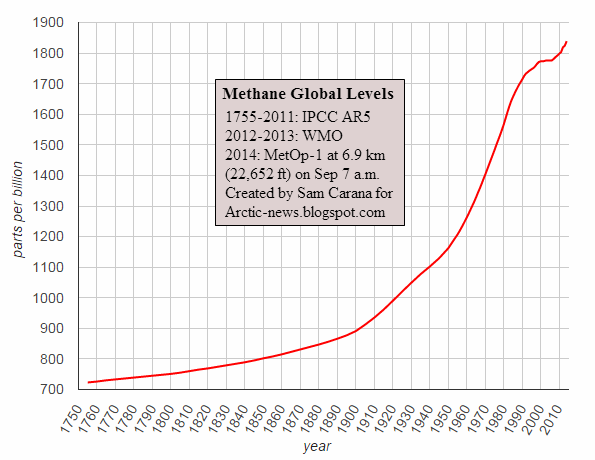
The image below, based on data from the IPCC and the World Metereological Organization (WMO), with an added observation from a NOAA MetOp satellite image, illustrates the recent rise of methane levels and the threat that methane levels will continue to rise rapidly.


When looked at from a longer range of years, above image fits in the black square on the image below.


As ocean heat keeps increasing and warming in the Arctic keeps accelerating due to feedbacks such as Arctic sea ice decline, huge methane eruptions from the seafloor of the Arctic Ocean threaten to push up methane levels even further. The image below shows exponential rise based on data of East Siberian Arctic Shelf (ESAS) releases alone, as discussed in an earlier post.


Non-linear rise is supported by the fact that methane's lifetime increases as more methane enters the atmosphere.


5. Surface Temperatures

The IPCC expects that, worst case, global average temperature could rise by 13 degrees Celsius by 2300, as illustrated by the image below.


The situation could be much worse than foreseen by the IPCC, due to the non-linear way feedbacks can hugely increase temperature rises.


The threat is that such rapid temperature rises will appear at first in hotspots over the Arctic and eventually around the globe, while also resulting in huge temperature swings that could result in depletion of supply of food and fresh water, as further illustrated by the above image, from an earlier post, and the image below, from another earlier post.


The situation is dire and calls for comprehensive and effective action, as described in the Climate Plan.


Links

• Climate Plan
https://arctic-news.blogspot.com/p/climateplan.html

• Frequently Asked Questions (FAQ)
https://arctic-news.blogspot.com/p/faq.html

• Feedbacks in the Arctic
https://arctic-news.blogspot.com/p/feedbacks.html

• Ocean Temperature Rise Continueshttps://arctic-news.blogspot.com/2014/11/ocean-temperature-rise-continues.html

• Just do NOT tell them the monster exists
https://arctic-news.blogspot.com/2013/10/just-do-not-tell-them-the-monster-exists.html

• Quantifying Arctic Methane
https://arctic-news.blogspot.com/2013/11/quantifying-arctic-methane.html

• Near-Term Human Extinction
https://arctic-news.blogspot.com/2014/04/near-term-human-extinction.html

• The Threat of Global Warming causing Near-Term Human Extinctionhttps://arctic-news.blogspot.com/p/threat.html

• How many deaths could result from failure to act on climate change?https://arctic-news.blogspot.com/2014/05/how-many-deaths-could-result-from-failure-to-act-on-climate-change.html

• More than 2.5m Sea Level Rise by 2040?https://arctic-news.blogspot.com/2014/07/more-than-25m-sea-level-rise-by-2040.html


Saturday, November 22, 2014

How melting Arctic ice is driving harsh winters

by Nick Breeze

The very least 'global warming' could do for us is to give us warmer winters, right? Wrong, writes Nick Breeze, who met climate scientist and meteorologist Jennifer Francis in his attempt to understand the complex interactions of jet stream, polar vortex, the melting Arctic, and the extreme snowfall that's hitting the northeast US right now.

"Historic" snowfalls have the US northeast this week, with Buffalo, New York under an astonishing 2.4m (8ft) of snow - enough to cause some roofs to cave in under the pressure.

It's just the latest chapter in 2014 unprecedented range of weather extremes - from persistent storms that battered, and flooded much of the UK at the beginning of the year, before going on to record the hottest October since records began.

And in the US, extremes have ranged from California's record drought, to the early snows now under way in the northeast - and let's not forget the 'polar vortex' that hit much of the US in January, bringing Arctic conditions as far south as Texas and Florida, causing flights to be cancelled in Chicago as aviation fuel froze in the -38.3C (-37F) temperatures.


Scientists now have evidence that these persistent extreme weather patterns are increasing in their frequency, due to the rapid heating up of the Arctic that is changing the behaviour of the jet stream, and in turn, the polar vortex.

And Jennifer Francis of Rutgers University, one of the leading US scientists studying the relationship between Arctic warming and changes in the jet stream, believes that it's thanks to 'global warming' that northern hemisphere weather is becoming more extreme - and it's not about to get any better.

Screenshot from Youtube video further below

The 'vast river of wind' that makes our weather

"The Arctic is generally very cold", she told me, "and the areas farther south are warm, and that difference in temperature between those two areas is really what fuels that vast river of wind moving high over our head that we call the jet stream."

"The jet stream in turn creates most of the weather that we feel all around the northern hemisphere and the middle latitudes, so anything that affects this jet stream is going to affect weather patterns. So as the Arctic warms up much faster than the areas farther south, we're seeing this temperature difference between these two regions get smaller."

The result of that, she explains, is that the atmospheric forces driving the jet stream's circular motion are getting smaller - and that means the winds themselves in the jet stream are getting weaker, and moving more slowly.

"When that happens, the jet stream tends to take a wavier path as it travels around the northern hemisphere and those waves are actually what create the stormy patterns and the nice weather patterns. As those waves get larger because of this weakening of those winds of the jet stream, they tend to move more slowly from west to east."

"That means it feels like the weather patterns are sticking around longer, because those patterns are moving much more slowly and this then makes it more likely to have the kind of extreme events that are related to persistent weather patterns."


Are critical findings influencing policy?

These changes in climate have huge implications. As Dr Francis points out, there are "people who worry about whether there is enough fresh water to supply cities, whether there is enough snowpack on mountains to supply reservoirs, and for agriculture ..."

"Drought and agriculture is a big problem. Storminess in certain areas is another big problem. Yes, it has a huge impact for a whole range of issues that affect the way we live."

It's no wonder then that Dr Francis and her colleagues have attracted the attention of President Obama's chief science advisor, Dr John Holdren.

Dr Holdren has been reporting directly to the President on the real time effects of climate change and is keen to understand what this new research tells us about the future impact of changes to the jet stream.

Asked about this sudden interest in her work from the US Presidency, Francis muses thoughtfully. "Yes, we've had a lot of interest from policy makers", she acknowledges.

"I think we're starting to make a lot of progress now in getting policymakers to understand that this is a big problem they have to face ... I think decision makers and the policymakers at the local level get it much better because they're already seeing effects on their local areas.

"Sea level rise is an obvious one. They're already seeing changes in drought and agricultural problems and dealing with fresh water issues. It is really at the local level that we're having more success."

New research supports the case that Arctic sea ice loss is driving climate changes

So to understand the changes in the jet stream it's important to research how the vast atmospheric river of weather above our heads is connected to other climate mechanisms.

"It appears that over the north Atlantic, and towards Asia, there's a mechanism that appears to be quite robust, and several groups have found this mechanism using completely different analysis techniques", says Francis referring to new research by colleagues at the University of Alaska that has emerged in the last couple of months.

"So what we're finding is that there's an area, north of Scandinavia in the Arctic, where the ice has been disappearing particularly rapidly. When that ice disappears ... there is unfrozen ocean underneath, and that ocean absorbs a lot more energy from the sun through the summertime. So it becomes very warm there."

"Then as the fall comes around, all that heat that's been absorbed all summer long, where the ice has retreated, is put back in the atmosphere and that creates a big bubble of hot air ... over that region where the ice was lost."

And in turn, that goes on to disrupt the circumpolar winds whose behaviour determines much the weather across the northern hemisphere.

The gigantic bubble of warm air "tends to create a northward bulge in the jet stream", and in turn, "that creates a surface high pressure area that circulates in the clockwise direction. That sucks cold air down from the Arctic over northern Eurasia, and that creates a southward dip in the jet stream."


The bulging jet stream disrupts the polar vortex

"So what we're getting is this big northward bulge up over Scandinavia and a southward dip over Asia ... creating, first the tendency for a larger wave in the jet stream, which tends to move more slowly, but also we're seeing this mechanism that creates these colder winters that have been observed over Central Asia."

"Once the jet stream gets into this wavier pattern, it sends wave energy up into the highest levels of the atmosphere, which is called the stratosphere, where we have the polar vortex, which is kind of similar to the jet stream but it's much higher up in the atmosphere and it travels much faster."

"So as that wave energy gets sent up from this larger wave below, up into the stratosphere, it breaks down that polar vortex so that it becomes wavier as well. That wavier polar vortex sends energy back down to the lower atmosphere and it creates an even wavier jet stream in February."

"So we're seeing this connection of mechanisms that starts with Arctic sea ice loss and it makes a wavier jet stream for different reasons all the way through winter."

Will the jet stream continue to cause changes in climate?

By identifying these mechanisms and linking them back directly to loss of the Arctic sea ice, Dr Francis and her colleagues are demonstrating how man-made global warming is creating feedbacks that are changing the climate conditions in the northern hemisphere - and not for the better.

It may be counterintuitive, and it when it first happened it took scientists by surprise - but now it looks like this is one of the most important ways in which 'global warming' is hitting North America. Melting ice in the Arctic Ocean is indirectly pushing frigid Arctic air south across the continent, creating the perfect conditions for massive snowfall.

Which is all very well ... but what's coming next? "We are using these climate models, or computer simulations ... to try and project what we're expecting to see happen in the future, as greenhouse gases continue to increase.

"The early indications are that these large wavy patterns in the jet stream are going to become more frequent in the future, as far as we can tell. It is preliminary research that I haven't published yet but it does look as if they are going to increase."


Nick Breeze is a film maker and writer on climate change and other environmental topics. He has been interviewing a range of experts relating to the field of climate change and science for over four years. These include interviews with Dr James Hansen, Professor Martin Rees, Professor James Lovelock, Dr Rowan Williams, Dr Natalia Shakhova, Dr Michael Mann, Dr Hugh Hunt, among others.

Additional articles can also be read on his blog Envisionation.

Jennifer Francis is a research professor at the Institute of Marine and Coastal Sciences at Rutgers University, where she studies Arctic climate change and the link between Arctic and global climates. She has authored more than 40 peer-reviewed publications on these topics. She was also the co-founder of the Rutgers Climate and Environmental Change Initiative.

Article earlier posted at TheEcologist.org


Related


Thursday, November 20, 2014

Ocean Temperature Rise Continues


Ocean Temperature Rise

Of all the excess heat that results from people's emissions, 93.4% goes into oceans. Accordingly, the temperature of oceans has risen substantially.

NOAA analysis shows that the most recent 12-month period, November 2013–October 2014, broke the record (set just last month) for the all-time warmest 12-month period in the 135-year period of record. The global oceans were the warmest on record for October. For January–October, the average global sea surface temperature was also record high.


The danger is that ocean temperatures will continue to rise, especially in the North Atlantic, and that the Gulf Stream will keep carrying ever warmer water from the North Atlantic into the Arctic Ocean, threatening to unleash huge methane eruptions from the Arctic Ocean's seafloor, in turn causing even higher temperatures and more extreme weather events, wildfires, etc.


High Methane Levels

High methane levels were recorded over the Arctic Ocean in October, as discussed in this earlier post, and were sustained in November, as discussed in this post. Methane levels as high as 2717 ppb were recorded on November 16, 2014, p.m, by the MetOp-1 satellite at 469 mb (i.e. 19,820 ft or 6,041 m altitude), as the image below shows.

Methane levels as high as 2549 ppb were recorded on November 19, 2014, p.m, by the MetOp-2 satellite at 586 mb (i.e. 14,385 ft or 4,384 m altitude), as the image below shows.

Above image further confirms earlier indications that these high methane levels do indeed result from large methane eruptions from the seafloor of the Arctic Ocean.

Greenhouse gas levels in general are very high over the Arctic, as earlier discussed in a recent post and as illustrated by the image below, showing carbon dioxide levels as high as 420 ppm at high latitudes, while the global mean was 403 ppm, on November 19, 2014, p.m., at 945 mb (i.e. 1,916 ft or 584 m altitude).


As said, sustained instances of large abrupt methane eruptions from the seafloor of the Arctic Ocean threaten to strongly accelerate warming in the Arctic even further, in turn resulting in ever more methane being released, as illustrated in the image below, from an earlier post.


Self-reinforcing Feedback Loops


Such methane eruptions are part of a number of self-reinforcing feedback loops that can strongly accelerate warming in the Arctic. Above image, from an earlier post, illustrates two such feedbacks, i.e. albedo changes due to snow and ice demise, and methane releases. Further feedbacks are described in this post and this post, and in the image below.

For a discussion of these and further feedbacks, see this page at the Climate Plan blog 
The threat is that such rapid temperature rises will appear at first in hotspots over the Arctic and eventually around the globe, while also resulting in huge temperature swings that could result in depletion of supply of food and fresh water, as further illustrated by the above image, from an earlier post, and the image below, from another earlier post.
[ click on image at original post to enlarge ]


IPCC warnings not strong enough


In above paragraph, the IPCC warns about the risk of methane eruptions from the seafloor of the Arctic Ocean further accelerating global warming. While the IPCC does model for a temperature rise that could exceed 12 degrees Celsius in a 'business as usual' scenario (i.e. without action taken), the IPCC does not anticipate that such a rise could occur before the year 2250, as illustrated by the image below.


The situation could be much worse than foreseen by the IPCC, due to a number of reasons, including:
  1. The non-linear way feedbacks can hugely increase temperature rises.
  2.  The IPCC's underestimation of the amount of methane contained in sediments under the Arctic Ocean and prone to be released as temperatures rise. Shakhova et al. estimate the accumulated methane potential for the Eastern Siberian Arctic Shelf (ESAS) alone as follows:
    - organic carbon in permafrost of about 500 Gt;
    - about 1000 Gt in hydrate deposits; and
    - about 700 Gt in free gas beneath the gas hydrate stability zone.
    Back in 2008, Shakhova et al. considered release of up to 50 Gt of predicted amount of hydrate storage as highly possible for abrupt release at any time.
    Furthermore, mantel methane could add to our predicament, as discussed in an earlier post.
  3. Back in 2002, Malcolm Light already warned that seismic events could trigger destabilization of methane hydrates. Furthermore, huge temperature swings can combine with pressure swings and storms, and with swings between expansion and contraction of soil and ice, resulting in severe shocks to ecosystems, as described in an earlier post
  4. The IPCC's ignoring of large methane eruptions from the seafloor of the Arctic Oceans and the resulting growth of mean global methane levels at higher altitudes, as discussed in an earlier post.
Steven Sherwood et al. wrote back in 2010 that peak heat stress, quantified by wet bulb temperature, across diverse climates today never exceeds 31 degrees Celsius (see also this update). Some may believe that this doesn't apply to the Arctic and the higher altitudes in mountain regions. However, at the June Solstice the amount of solar radiation received in the Arctic is higher than anywhere else on Earth, An increased occurence and intensity of heatwaves could expose large areas of the Arctic and mountain regions to sustained heatwaves exceeding peak heat stress temperatures. In addition, ocean acidification and oxygen depletion in the Arctic Ocean would make it hard for fish, seals, polar bears and further wildlife to survive. Furthermore, the short growth season combined with a long, cold winter limits vegetation in the Arctic, while ecosystems are also becoming increasingly exposed to wild weather swings and wildfires.


Risk Assessment

When taking above points into acount, an absence of action seems to guarantee human extinction by the year 2050. Little action will be ‘too little, too late’ and will merely delay human extinction by a few years, as illustrated by the graph below.


The graph identifies the years 2030 and 2040 as critical. Beyond the year 2030, the risk that humans will go extrinct grows larger than 1% in the absence of action. By the year 2040, the risk of human extinction will have increased substantially, especially if no action will have been taken, but also if too little action will have been taken up to 2040, while even with the best possible programs put in place by the year 2015, there will be a 2% risk of human extinction by 2040, e.g. due to war over what action to take, or due to political opposition or errors making such programs ineffective or even counter-productive.

In conclusion, it is highly likely that the risk of human extinction already now is intolerably high and rising with every moment passing with little or no action taken to reduce the risk. The situation is dire and calls for comprehensive and effective action, as described in the Climate Plan.


Links

• Intergovernmental Panel on Climate Change (IPCC) WGI Fifth Assessment Report (AR5), Final Draft (7 June 2013), page 168.
http://www.climatechange2013.org/images/uploads/WGIAR5_WGI-12Doc2b_FinalDraft_Chapter02.pdf

• Intergovernmental Panel on Climate Change (IPCC) WGI Fifth Assessment Report (AR5), Final Draft (7 June 2013), Figure 12.5.
http://www.climatechange2013.org/images/uploads/WGIAR5_WGI-12Doc2b_FinalDraft_Chapter12.pdf

• An adaptability limit to climate change due to heat stress - by Steven C. Sherwood & Matthew Huber
http://www.pnas.org/content/early/2010/04/26/0913352107.full.pdf

• Ocean Temperature Rise - by Sam Carana
https://arctic-news.blogspot.com/2014/10/ocean-temperature-rise.html

• Methane release from the East Siberian Arctic Shelf and the Potential for Abrupt Climate Change - by Natalia Shakhova & Igor Semiletov
http://symposium2010.serdp-estcp.org/content/download/8914/107496/version/3/file/1A_Shakhova_Final.pdf

• Anomalies of methane in the atmosphere over the East Siberian shelf: Is there any sign of methane leakage from shallow shelf hydrates? - by Shakhova, Semiletov, Salyuk & Kosmach  http://www.cosis.net/abstracts/EGU2008/01526/EGU2008-A-01526.pdf

• Mantle Methane - by Malcolm Light
https://arctic-news.blogspot.com/2014/02/mantle-methane.html
• Evidence linking Arctic amplification to extreme weather in mid-latitudes - by Jennifer A. Francis and S.J. Vavrus, in: Geophysical Research Letters 39 (6):. doi:10.1029/2012GL051000
http://onlinelibrary.wiley.com/doi/10.1029/2012GL051000/abstract

• Near-Term Human Extinction - by Sam Carana
https://arctic-news.blogspot.com/2014/04/near-term-human-extinction.html

• Warm waters threaten to trigger huge methane eruptions from Arctic Ocean seafloor - by Sam Carana
https://arctic-news.blogspot.com/2014/08/warm-waters-threaten-to-trigger-huge-methane-releases-from-arctic-ocean-seafloor.html

• How many deaths could result from failure to act on climate change? - by Sam Carana
https://arctic-news.blogspot.com/2014/05/how-many-deaths-could-result-from-failure-to-act-on-climate-change.html

• Methane linked to Seismic Activity in the Arctic - by Malcolm P. Light & Sam Carana
https://arctic-news.blogspot.com/p/seismic-activity.html

• Wild Weather Swings - by Sam Carana
https://arctic-news.blogspot.com/2014/10/wild-weather-swings.html

• Four Hiroshima bombs a second: how we imagine climate change - by Sam Carana
https://arctic-news.blogspot.com/2013/08/four-hiroshima-bombs-second-how-we-imagine-climate-change.html

• Polar jet stream appears hugely deformed
https://arctic-news.blogspot.com/2012/12/polar-jet-stream-appears-hugely-deformed.html

• Near-Term Human Extinction
https://arctic-news.blogspot.com/2014/04/near-term-human-extinction.html

• Climate Plan
https://arctic-news.blogspot.com/p/climateplan.html


Sunday, November 2, 2014

Methane Erupting From East Siberian Arctic Shelf

Methane is erupting in huge amounts from the seafloor of the Arctic Ocean, as illustrated by the images below, showing methane over the East Siberian Arctic Shelf on October 31, 2014.

The top image on the right shows methane at an altitude of 19,820 feet (6,041 m), on October 31, 2014, pm, as captured by the MetOp1 satellite.

The middle image shows the location of the seas north of Siberia, and shows methane over the Arctic Ocean close to sea level, for reference.

The bottom image is an animation, starting at an altitude close to sea level and rising over 25 frames to an altitude of 19,820 feet (6,041 m).

As altitude increases, the methane can be seen emerging from the Laptev Sea at first, then spreading over further parts of the Arctic Ocean.

The yellow color indicates that methane is present at levels of 1950 ppb or higher.

High CO2 levels over Arctic Ocean

As in the previous post, an image has been added (below) showing recent carbon dioxide levels. Close to ground level (or rather sea level), mean CO2 level increased to 402 ppm on November 1, 2014 am, as measured by the MetOp-1 satellite.


The image below shows a comparison between CO2 (left) and methane (right).

[ Image added later, Ed. Click on image to enlarge ]
Above images indicate that large amounts of methane are broken down at higher latitudes on the Northern Hemisphere, especially over the Arctic Ocean.

Large methane eruptions from the seafloor of Arctic Ocean continue

The two images below [added later, ed.] further confirm the huge size of the methane erupting from the seafloor of the Arctic Ocean. The image directly below shows that levels as high as 2362 ppb were recorded on November 5, 2014 p.m.by the MetOp-1 satellite at an altitude of 14,385 ft (4,384 m) altitude. The image also shows that the methane is predominantly visible over the Arctic Ocean, further confirming that this is indeed the cause of the continued high methane levels.


The recent methane eruptions from the seafloor of the Arctic Ocean also appear to be pushing up methane levels at Mauna Loa, Hawaii, as measured by NOAA on November 6, 2014, as illustrated by the combination image below showing daily averages (left) and hourly averages (right).


Methane eruptions from Arctic Ocean seafloor look set to continue for months to come

As oceans keep warming, the Gulf Stream
will keep moving ocean heat into the Arctic Ocean, and ever more methane threatens to erupt from the seafloor of the Arctic Ocean.

The image on the right shows the huge sea surface temperature anomalies off the coast of North America and in the Arctic. Heat in the North Atlantic will take some time to travel to the Arctic Ocean, so this heat has yet to arrive there and contribute to cause further methane eruptions.

Nations are ignoring the growing dangers and keep each seeking a bigger share of a 'carbon budget', but in reality there is no carbon budget to divide. Instead, there is a huge debt built up by a joint failure of nations to act on pollution.

Increased methane eruptions from the seafloor of the Arctic Ocean threaten to further accelerate warming in the Arctic, in turn resulting in ever more methane being released, as illustrated in the image below, from an earlier post.

Methane in historic perspective

The image below shows that global methane levels have risen from 723 ppb in 1755 to 1839 ppb in 2014, a rise of more than 254%. Growth did flatten down for a few years in the early 2000s, but the overall rise does not appear to slow down.

The right-end of this graph is shown in greater detail on the image below, which also has a trendline extended to the year 2021, against a background of methane levels measured by the MetOp-1 satellite on November 2, 2014, p.m.

Note that the image used as background in the plot area has different axis labels, i.e. latitude for the vertical axis and longitude for the horizontal axis. The image below gives the levels associated with the colors on the background image, with yellow indicating levels of 1950 parts per billion (ppb) and higher.


Remember that the level of 723 ppb in 1755 was not a paleo-historic low, but instead was the high peak of a Milankovitch Cycle. The image below further illustrates this point.


And so does the image below, by Reg Morrison.


Comprehensive and effective action needed

The situation is dire and calls for comprehensive and effective action. The Climate Plan seeks emission cuts, removal of pollution from soils, oceans and atmosphere, and further action, as illustrated by the image below, from an earlier post.