By Malcolm P.R. Light
August 10, 2012
Abstract
The exponential increase in the Arctic atmospheric methane derived from the destabilization of the subsea Arctic methane hydrates is defined by both the exponential decrease in the volume of Arctic sea ice due to global warming and the exponential decrease in the continent wide reflectivity (albedo) of the Greenland ice cap caused by increasing rates of surface melting which reach minima around 2014, 2015.
The high anomalous atmospheric methane contents recorded this year at Barrow Point Alaska (up to 2500 ppb - Carana 2012b) and the fact that the surface atmospheric methane contents may be linked via a stable partial pressure gradient with increased maximum methane contents in the world encompassing global warming veil (estimated at ca 1460 ppb methane) makes it imperative that the Merlin lidar satellite be launched as soon as is feasibly possible. The Merlin lidar satellite will give us a clear idea of how high the Earth’s stratospheric methane concentrations are in this poorly documented giant methane reservoir formed above the ozone layer at 30 km to 50 km altitude (Ehret, 2010).
Methane detecting Lidar instruments could also be installed immediately on the International Space Station to give early warning of the methane buildup in the stratosphere and act as a back up in case the Merlin satellite fails.
Unless immediate and concerted action is taken by governments and oil companies to depressurize the Arctic subsea methane reserves by extracting the methane, liquefying it and selling it as a green house gas energy source, rising sea levels will breach the Thames Barrier by 2029 flooding London. The base of the Washington Monument (D.C.) will be inundated by 2031. Total global deglaciation will finally cause the sea level to rise up the lower 35% of the Washington Monument by 2051 (68.3 m or 224 feet above present sea level).
Sunday, August 12, 2012
Saturday, August 11, 2012
Huge cyclone batters Arctic sea ice
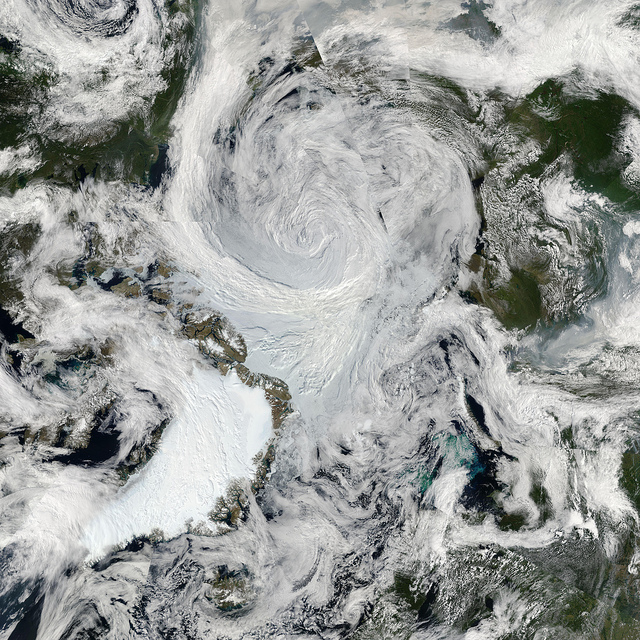
The image below shows an unusually large and powerful cyclone that was churning over the Arctic in early August 2012. Two smaller systems merged on August 5 to form the storm, which at the time occupied much of the Beaufort-Chukchi Sea and Canadian Basin, reports NASA Earth Observatory. On average, Arctic cyclones last about 40 hours; as of August 9, 2012, this storm had lasted more than five days.
This cyclone’s central sea level pressure reached about 964 millibars on August 6, 2012—a number that puts it within the lowest 3% of all minimum daily sea level pressures recorded north of 70 degrees latitude, noted Stephen Vavrus, an atmospheric scientist based at the University of Wisconsin.
NASA’s Aqua satellite captured above natural-color mosaic image on August 6, 2012. The center of the storm at that date was located in the middle of the Arctic Ocean.
The combined screenshots (6 & 8 August) below from Oceanweather Inc give an idea of size of the waves churned up by the cyclone.

The storm came in from Siberia, intensified and then positioned itself over the central Arctic, engendering 20 knot winds and 50 mph wind gusts, reports Skeptical Science.
The Arctic Sea Ice Blog covered the unfolding events well, in a series of posts including:
Such mixing could mean that sediments that have been frozen until now get exposed to warmer water. This could destabilize methane contained in such sediments, either in the form of free gas or hydrates.
John Nissen, Chair of the Arctic Methane Emergency Group (AMEG), comments:

Above image shows a retreat in sea ice area to 3.15521 million km2 on the 221st day of 2012, down from 3.91533 million km2 on the 212th day of 2012, from The Cryosphere Today.
The 30-days animation below, from the Naval Research Laboratory, show the recent ice speed and drift.

The 30-days animation below, also from the Naval Research Laboratory, show recent decline of the thickness of the sea ice.

This cyclone’s central sea level pressure reached about 964 millibars on August 6, 2012—a number that puts it within the lowest 3% of all minimum daily sea level pressures recorded north of 70 degrees latitude, noted Stephen Vavrus, an atmospheric scientist based at the University of Wisconsin.
 |
| Image by By NASA Goddard Photo and Video |
The combined screenshots (6 & 8 August) below from Oceanweather Inc give an idea of size of the waves churned up by the cyclone.
The storm came in from Siberia, intensified and then positioned itself over the central Arctic, engendering 20 knot winds and 50 mph wind gusts, reports Skeptical Science.
The Arctic Sea Ice Blog covered the unfolding events well, in a series of posts including:
- Cyclone warning!
- Arctic storm part 1: in progress
- Arctic storm part 2: the color purple
- Arctic storm part 3: detachment
- Further detachment
- Arctic summer storm open thread 1
Such mixing could mean that sediments that have been frozen until now get exposed to warmer water. This could destabilize methane contained in such sediments, either in the form of free gas or hydrates.
John Nissen, Chair of the Arctic Methane Emergency Group (AMEG), comments:
"There are at least three positive feedbacks working together to reinforce one another - and now a fourth on salinity:
- The albedo flip effect as sea ice is replaced by open water absorbing more sunlight, warming and melting more sea ice.
- As the sea ice gets very thin, it is liable to break up easily and get blown into open water where it will melt more easily.
- The open warmer water is allowing increased strength of storms, which break up the ice to make for more open water.
- The storms are churning up the sea to a depth of 500 metres, producing salinity at the surface that will mean slower ice formation in winter and more open water next year.
These feedbacks are dangerous for methane. AMEG has been warning that, as the sea ice retreats, storms will warm the sea bed, leading to further release of methane. In ESAS, we only need mixing to a depth of 50 metres - so a storm capable of mixing to 500 metres will really stir things up.
These feedbacks are also dangerous for food security, already damaged through climate extremes induced by Arctic warming, hence our piece in the Huffington Post.
The only way to head off catastrophe is to cool the Arctic, which must involve geoengineering as quickly as possible. We must try to remain positive and determined about this, despite the gloomy news."
Above image shows a retreat in sea ice area to 3.15521 million km2 on the 221st day of 2012, down from 3.91533 million km2 on the 212th day of 2012, from The Cryosphere Today.
The 30-days animation below, from the Naval Research Laboratory, show the recent ice speed and drift.
The 30-days animation below, also from the Naval Research Laboratory, show recent decline of the thickness of the sea ice.
