Showing posts with label sea. Show all posts

Tuesday, April 5, 2016

Record Arctic Warming

On April 3rd, 2016, Arctic sea ice extent was at a record low for the time of the year, reports the National Snow and Ice Data Center (NSIDC).

The image below, created with an image from the JAXA site, gives an update on sea ice extent.


Besides sea ice extent, sea ice area is important. For more on what constitutes "ice-covered" and what is sea ice extent (versus sea ice area), see this NSIDC FAQ page.

Another measure is sea ice area. On April 2nd, 2016, Northern Hemisphere sea ice area was at a record low for the time of the year, reports the Cryosphere Today.


In 2015, there still was more sea ice area than there is now when it was half a month later (15 days) into the year. In 2012, there still was more sea ice when it was 25 days later in the year. In other words, sea ice area decline is almost one month ahead compared with the situation in 2012.

NSIDC scientist Andrew Slater has created the chart below of freezing degree days in 2016 compared to other years at Latitude 80°N. See Andrew's website and this page for more on this.

The Arctic has warmed more than elsewhere on Earth. Surface temperatures over the past 365 days were more than 2.5°C or 4.5°F higher than they were in 1981-2010.


The image below compares sea ice thickness on April 3rd for the years 2012, 2015 and 2016 (respectively the left, center and right panel).


Sea ice thickness has fallen dramatically over the years, as illustrated by the image on the right, from NSIDC, showing Arctic sea ice age for the week from March 4 to 10, from 1985 to 2016.

The high temperatures that have hit the Arctic Ocean over the past 365 days make that the outlook for the sea ice in the Arctic this year is not good.

As illustrated by the image on the right, the current El Niño is still going strong, with temperatures above 100°F recorded in three continents.

The year 2016 is already shaping up as the warmest year on record by far.

Temperatures look set to soar over the coming months, over the Northern Hemisphere at large and over the Arctic in particular.

The image below shows that over a 90-day period from January 13, 2016, to April 11, 2016, most of the Arctic Ocean was more than 6°C (10.8°F) warmer than 1981-2011.

The DMI image below shows recent melting in Greenland up to April 11, 2016. Maps in the left panel show areas where melting has taken place on April 10 and April 11, 2016. The chart in the right panel shows 2016 melting (blue line), against the 1990-2013 average (the vertical axis reflects the percentage of the total area of the ice where the melting occurred).

As a recent study confirms, ice sheets can contain huge amounts of methane in the form of hydrates and free gas. Much methane can escape due to melting and fracturing during wild weather swings.


Rapid melting on Greenland looks set to continue. The forecast for April 12, 2016 (0000 UTC), on the right shows temperature anomalies at the top end of the scale (20°C or 36°F) over most of Greenland and Baffin Bay, while the Arctic as a whole is hit by a temperature anomaly of over 5°C (over 9°F), compared to 1979-2000.

Furthermore, ocean temperatures are currently very high. These high temperatures, together with the poor condition of the sea ice, make that chances are that the sea ice will be largely gone by September 2016.

[ click on images to enlarge them ]
The image on the bottom right shows sea surface temperature anomalies above Latitude 60°N on April 4, 2016.

The image below shows that, on April 7, 2016, sea surface in the Barents Sea was as warm as 10.1°C or 50.2°F, an anomaly of 9.4°C or 16.9°F from 1981-2011 (at the location marked by the top right green circle), while there were anomalies as high as 11.3°C or 20.3°F off the coast of North America (green circle bottom left).

The white line shows the approximate path of the cold exit current, while the red line shows the approximate path of the warm entry current.

The high temperatures in the Barents Sea give an indication of the ocean heat traveling toward the Arctic Ocean, while the high temperature anomalies off the east coast of North America give an indication of the heat that is building up there. Much of this heat will make its way to the Arctic Ocean over the coming months
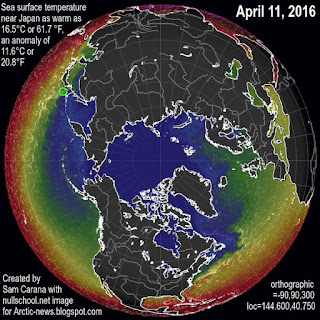

April 11, 2016: SST anomalies as high as 11.6°C or 20.8°F
In the Pacific, sea surface temperature anomalies from 1981-2011 were as high as 11.6°C or 20.8°F near Japan on April 11, 2016 (see image right), giving a further indication of the huge amount of additional heat that there now is in oceans on the Northern Hemisphere. The prospect is that temperatures will rise over the next few months to levels even higher than they were last year (see earlier post on temperatures in June 2015).

Sea ice acts as a buffer, absorbing heat and keeping the temperature of the water at freezing point. Without such a buffer, further heat will instead make that the temperature of the water will rise rapidly. Furthermore, less sea ice means that less sunlight gets reflected back into space and more sunlight instead gets absorbed by the Arctic Ocean.

These are just some of the many feedbacks that accelerate warming in the Arctic. Warm water reaching the seafloor of the Arctic Ocean can penetrate sediments that can contain huge amounts of methane in the form of hydrates and free gas, triggering abrupt release of methane in gigantic quantities, escalating into runaway warming, and subsequent destruction and extinction at massive scale.

On a 10-year timescale, the current global release of methane from all anthropogenic sources already exceeds all anthropogenic carbon dioxide emissions as agents of global warming; that is, methane emissions are more important than carbon dioxide emissions for driving the current rate of global warming.


Above image shows that growth in methane levels has been accelerating recently; a trendline points at a doubling of methane levels by the year 2040. Unlike carbon dioxide, methane's GWP does rise as more of it is released. Methane's lifetime can be extended to decades, in particular due to depletion of hydroxyl in the atmosphere.

The situation is dire and calls for comprehensive and effective action as described at the Climate Plan.

Albert Kallio comments: 
More could have been added from the last National Snow and Ice Data Center (NSIDC) Arctic sea ice report for March, the general outlook for massive sea ice loss because the near-all-time record low marine snow and ice cover is coinciding with near-all-time record low terrestrial snow cover. NSIDC forecast that due to dark surfaces being so high, this easily leads to loss of sea ice. In fact, 2016 situation is even worse that it was previous record loss 2012 when snow cover was much larger. Same in 2007 when the sea ice area was slighly smaller, there was much larger terrestrial snow cover. Furthermore, neither 2007 nor 2012 occurred during strong El Nino like 1998. El Nino 2015-2016 is the strongest ever, also accompanied by the very warm Indian Ocean, Atlantic Ocean, and Southern Ocean around Antarctica. At times Antarctic sea water temperatures were also high leading to second smallest Austral summer sea ice at one point. Sea ice area also around Antarctica has been smaller than average most of time, despite increased melt water and reduced salinity - due to high temperatures. All these additional factors should be added into your conclusions without forgetting to mention that the added heat in the earth system is ripping the Polar Vortex apart as the jet streams have started to blend into other irregular atmospheric wind patters. Note also the increased flow of sea ice through the Fram Strait due to lowered spatial viscosity of sea ice that also results from larger wave action, vertical mixing of ocean by wind, thinner sea ice breaking easier apart and collapsing into pack ice, as well as being mostly seasonal ice (containing trace amounts of salts that make the chemical bounds in ice crystals weaker and fragile and melting easier), May be you can update and rejoice on NSIDC's March 2016 report noting all the points therein..


Thursday, February 18, 2016

Has maximum sea ice extent already been reached this year?

An earlier post wondered whether maximum extent for this year had already been reached, i.e. on February 9, 2016, when sea ice extent was 14.214 million km2.

As illustrated by the image below, extent since has been lower, including on the two most recent days on the image, i.e. on February 16 and 17, 2016, when extent was respectively 14.208 and 14.203 million km2.


Last year (2015), maximum sea ice extent was reached on February 25. That's close to the most recent date on the image of February 17, so with El Nino still going strong, it may well be that the maximum in 2016 will be reached early.

On the other hand, strong winds could spread out the sea ice and speed up its drift out of the Arctic Ocean, which may result in a larger extent, but which won't do much to strengthen the sea ice.

UPDATES: On February 18, 2016 (arrow), Arctic sea ice extent was 14.186 million square km, i.e. less than it was on February 9. In fact, sea ice extent hasn't been higher on any day since February 9, 2016. So, the question is, has this year's maximum extent already passed us by (i.e. on February 9)?

The image below shows the heat is having a huge impact on the sea ice, with some areas (black) showing sea surface temperature anomalies above 8°C (or above 14.4°F).


Ominously, sea surface off the North American east coast was as much as 11.8°C or 21.3°F warmer on February 19, 2016, than it was in 1981-2011 (at the location marked by the green circle in the image below).


Temperatures over the Arctic Ocean are forecast to remain extremely high for the next five days, with anomalies in a large part of the Arctic Ocean at the top end of the scale, i.e. 20°C or 36°F.


As the image below shows, Arctic sea ice area was at a record low for the time of year on February 18, 2016.


The image below shows that Arctic sea ice extent on February 20, 2016, was only 14.166
million km2 (arrow), adding to fears that this year's maximum was already reached on February 9.


The image below shows that Arctic sea ice extent on February 21, 2016, was only 14.160
million km2 (arrow), further fueling fears that this year's maximum was already reached on February 9.


Meanwhile, very high methane levels, as high as 3096 parts per billion, were recorded on February 20, 2016, as shown by the image below.


Further analysis indicates that these high levels likely originated from destabilizing methane hydrates in sediments, from a location about latitude 85°North and longitude +105° (East), on the Gakkel Ridge, just outside the East Siberian Arctic Shelf, at the location of the red marker on the map below.

Below is a comparison map, from grida.no
for large-size image, go to grida.no
Below is a map with sea surface temperature anomalies on February 20, 2016. The green circle marks the likely location of sediment destabilization and subsequent methane plume, at about latitude 85°North and longitude +105° (East), on the Gakkel Ridge, just outside the East Siberian Arctic Shelf.

zoom in and out at nullschool.net
If you like, you can discuss this further at the Arctic News group or below.


On February 18, 2016 (arrow), Arctic sea ice extent was 14.186 million square km, i.e. less than it was on February 9....
Posted by Sam Carana on Friday, February 19, 2016

Monday, February 15, 2016

Arctic sea ice remains at a record low for time of year

For the time of year, Arctic sea ice remains at a record low since satellite records started in 1979, both for area and extent. The image below shows Arctic sea ice area up to February 12, 2016, when area was 12.49061 million square km.


The image below shows Arctic sea ice extent up to February 12, 2016, when extent was 14.186 million square km.


The reason for the record low sea ice is that there is more ocean heat than there used to be. The image below shows that on February 12, 2016, the Arctic Ocean sea surface temperature was as warm as 11.3°C (52.4°F) at a location near Svalbard marked by the green circle, a 10.4°C (18.7°F) anomaly.


The reason for this is that the water off the east coast of North America is much warmer than it used to be.

The Gulf Stream is pushing heat all the way into the Arctic Ocean.

The image below shows that on February 14, 2016, sea surface temperature anomalies (compared to 1981-2011) off the east coast of North America were was as high as 10.1°C or 18.1°F (at the location marked by the green circle).

While sea surface looks cooler (compared to 1981-2011) over a large part of the North Atlantic, an increasing amount of ocean heat appears to be traveling underneath the sea surface all the way into the Arctic Ocean, as discussed at this earlier post.

This spells bad news for the sea ice in 2016, since El Niño is still going strong. Temperatures in January 2016 over the Arctic Ocean were 7.3°C (13.1°F) higher than in 1951-1980, according to NASA data, as illustrated by the graph on the right.

See the Controversy page for discussion
A polynomial trend added to the January land temperature anomaly on the Northern Hemisphere since 1880 shows that a 10°C (18°F) rise could eventuate by the year 2044, as illustrated by the graph on the right. Over the Arctic Ocean, the rise can be expected to be even more dramatic.

As the NASA map below illustrates, the global January 2016 land-ocean temperature anomaly from 1951-1980 was 1.13°C (or over 2°F) and the heat did hit the Arctic Ocean stronger than elsewhere.

In January 2016, it was 1.92°C (3.46°F) warmer on land than in January 1890-1910. Before 1900, temperature had already risen by ~0.3°C (0.54°F), which makes it a joint 2.22°C (4°F) rise. On the Northern Hemisphere, the rise on land was the most profound, with over 10°C (18°F) warming occurring at the highest latitudes.


Meanwhile, methane levels as high as 2539 parts per billion (ppb) were recorded on February 13, 2016, as illustrated by the image below.


The danger is that, as the Arctic Ocean keeps warming, huge amounts of methane will erupt abruptly from its seafloor.

The situation is dire and calls for comprehensive and effective action as described at the Climate Plan.

Update: Arctic sea ice extent keeps falling. Last year (2015), maximum sea ice extent was reached on February 25. Could it be that maximum extent for this year was already reached on February 9, 2016? The image below illustrates this question. discussed further at the Arctic News group.

discuss this further at the Arctic News group


Arctic sea ice extent keeps falling. Last year (2015), maximum sea ice extent was reached on February 25. Could it be...
Posted by Sam Carana on Monday, February 15, 2016

Monday, November 23, 2015

Arctic Ocean Shows New Record Low Sea Ice

by Albert Kallio


Both the sea ice thickness and sea ice area have fallen to new record lows for this time of the year (22.11.2015), even surpassing all of the worst previous years.

From Naval Research Laboratory image - view animation
Immense thrust of fast moving sea ice is pushing through at the full width of the Fram Strait between Norway and Greenland. This amounts to huge transport of latent coldness out of the Arctic Ocean to North Atlantic, while the constantly forming new sea ice (as temperatures are below 0°C) is generating heat to keep the surface air temperatures higher across the Arctic Ocean. Thus, heat is constantly being added to the Arctic Ocean while heat is taken away from the North Atlantic Ocean.


The normal sea ice area for this time of year is 9,625,000 km2, whereas the sea ice covers currently just 8,415,890 km2,, which makes that 1,209,120 km2 sea ice is missing from the normal (22.11) sea ice area.


The combination image below shows the jet stream (November 23, 2015, left panel) and surface wind (November 24, 2015, right panel).


Jet stream is wavy and strong, showing speeds as high as 219 mph or 352 km/h (at location marked by the green circle). Right panel shows cyclonic winds between Norway and Greenland speeding up movement of sea ice into the North Atlantic.

Forecasts indicate that conditions could continue. The 5-day forecast on the right shows strong winds in the North Atlantic. Note also the cyclonic winds outside the Bering Strait.

Temperatures over the Arctic are forecast to remain much higher than they used to be, with anomalies at the far end of the scale over a large part of the Arctic Ocean showing up on the 5-day temperature anomaly forecast below.


[ further updates will follow ]

Monday, November 9, 2015

Ocean Heat

Sea Surface Temperatures

Sea surface temperatures were as high as 15.8°C or 60.4°F near Svalbard on November 7, 2015, a 13.7°C or 24.7°F anomaly. Let this sink in for a moment. The water used to be close to freezing point near Svalbard around this time of year, and the water now is warmer by as much as 13.7°C or 24.7°F.

[ click on image to enlarge ]
Above image further shows that sea surface temperature anomalies as high as 6.7°C or 12.1°F were recorded on November 7, 2015, off the coast of North America, while anomalies as high as 6°C or 10.9°F were recorded in the Bering Strait.

NOAA analysis shows that the global sea surface in September 2015 was the warmest on record, at 0.81°C (1.46°F) above the 20th century average of 16.2°C (61.1°F). On the Northern Hemisphere, the anomaly was 1.07°C (1.93°F).

[ click on image to enlarge ]

How did temperatures get so high near Svalbard? The answer is that ocean currents are moving warm water from the Atlantic Ocean into the Arctic Ocean. The ocean is warmer underneath the sea surface and at that location near Svalbard warm water from below the surface emerges at the surface.

Ocean Heat

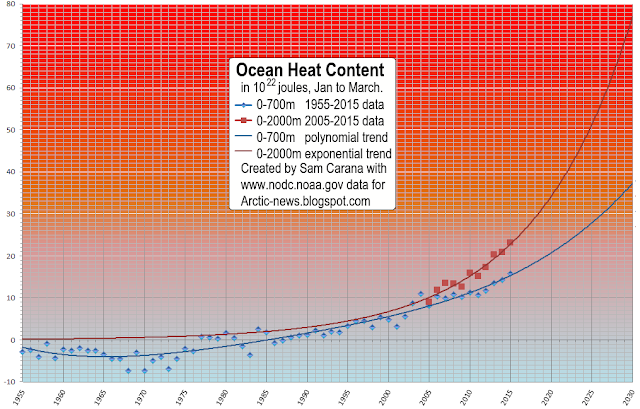
The oceans are warming up rapidly, especially the waters below the sea surface. Of all the excess heat resulting from people's emissions, 93.4% goes into oceans. Accordingly, the temperature of oceans has risen substantially over the years and - without action - the situation only looks set to get worse.

NOAA's ocean heat content figures for 0-2000 m are very worrying, as illustrated by the image below.


The image below was created with data for January through to March, while adding non-linear trendlines for ocean heat at depths of 0-700 m and 0-2000 m. For growth of ocean heat content for 0-700 m, a polynomial trend is added, while for growth of ocean heat content for 0-2000 m an exponential trend is added.

[ click on images to enlarge ]
The image below shows a polynomial trend based on all available quarterly data for ocean heat content from 0 to 2000 m. The trendline shows even faster growth.


The danger is that, as ocean heat continues to grow, ocean currents will keep carrying ever warmer water from the Atlantic and Pacific Oceans into the Arctic Ocean.

Merely watching temperatures at the surface of the ocean may underestimate the warming that is taking place below the sea surface. At the sea surface, evaporation takes place that cools the water. Furthermore, melting of sea ice and glaciers will make that a layer of cold freshwater spreads at the surface, preventing much transfer of heat from the ocean to the atmosphere, as discussed at this earlier post. The blue-colored areas on the Northern Hemisphere on the top image are partly the result of this meltwater. There is another reason why these areas are relatively cool, i.e. sulfates, as further discussed in the section below.

Aerosols

Particulates, in particular sulfate, can provide short-term cooling of the sea surface. Large amounts of sulfate are emitted from industrial areas in the east of North America and in East Asia. On the Northern Hemisphere, the Coriolis effect makes that such emissions will typically reach areas over the nearby ocean to the east of such industrial areas, resulting in the sea surface there being cooled substantially, until the particulates have fallen out of the sky. Since the sulfate is emitted on an ongoing basis, the cooling effect continues without much interruption.

[ click on image to enlarge ]
This sulfate has a cooling effect on areas of the sea surface where ocean currents are moving warm water toward the Arctic Ocean. Because the sea surface gets colder, there is less evaporation, and thus less heat transfer from the ocean to the atmosphere during the time it takes for the water to reach the Arctic Ocean. As a result, water below the sea surface remains warmer as it moves toward the Arctic Ocean.


Similarly, as illustrated by above image, sulfur dioxide emitted in industrial areas in North America and East Asia can extend over the oceans, cooling the surface water of currents that are moving water toward the Arctic Ocean.

Methane

The image below shows that atmospheric methane levels in 2014 were 1833 parts per billion (WMO data) or 254% the pre-industrial level. WMO data are for 1984-2014 and are marked in red, while IPCC data (AR5) are for the years 1755-2011 and are marked in blue.


The image below shows the rise of methane levels from 1984 created with World Metereological Organization (WMO) data. The square marks a high mean 2015 level, from NOAA's MetOp-2 satellite images, and it is added for comparison, so it does not influence the trendline, yet it does illustrate the direction of rise of methane levels and the threat that global mean methane levels will double well before the year 2040.


The image below illustrates the danger that large amounts of methane will erupt from the Arctic Ocean, particularly in East Siberian Arctic Shelf, where the sea is quite shallow, so much of the methane can reach the atmosphere without being broken down by microbes on the way up through the water column.


The video below shows how methane concentrations start to rise close to sea level, and how concentrations strengthen at higher altitudes, and to eventually get lower at even higher altitudes.


The Threat

Ocean heat threatens to increasingly reach the seafloor of the Arctic Ocean and unleash huge methane eruptions from destabilizing clathrates. Such large methane eruptions will then warm the atmosphere at first in hotspots over the Arctic and eventually around the globe, while also causing huge temperature swings and extreme weather events, contributing to increasing depletion of fresh water and food supply, as further illustrated by the image below, from an earlier post.

[ click on image at original post to enlarge ]

The image below gives an indication of the ocean heat that is pushed by the Gulf Stream toward the Arctic Ocean. Note that this image shows the situation on November 15, 2015. Water off the east coast of North America is even warmer at the peak of the Northern Hemisphere summer and it is this water that is now arriving in the Arctic Ocean.


Below is a radio version of this post, roughly as read by Debba Kale Earnshaw at this episode and the next episode of extinctionradio.org


Malcolm Light comments:
To a geologist-oceanographer, the increasing rate of heat gain in the deep water seems obvious. Massive quantities of heat are generated in the earth's interior by radioactivity and find their way to the surface in rising convection systems to erupt along mid-ocean ridges as basaltic lava flows, pushing the plates apart. Under normal circumstances, prior to the arrival of civilized man, the plates cooled as they expanded by passing their heat into the oceans, which then was radiated into space.

Now, with the fast evolving atmospheric greenhouse Arctic methane global warming veil. the heat is simply being reflected back into the oceans and onto the land. Therefore, just like a pressure cooker, the Earth's interior heat is becoming trapped more and more and of course the end result will be a final blow-out. The more than 400 thousand years of ice core data show that we can expect a massive atmospheric methane peak caused by destabilization of the Arctic subsea methane hydrates very soon (8 to 16 years away) and it will produce a Permian style extinction event with a temperature increase of some 8 to 10 degrees C.


Climate Plan

The situation is dire and calls for comprehensive and effective action, as discussed at the Climate Plan.

Sea surface temperatures were as high as 15.8°C or 60.4°F near Svalbard on November 7, 2015, a 13.7°C or 24.7°F anomaly....
Posted by Sam Carana on Monday, November 9, 2015