Note: there is a similar page at:
That debate page replaces this older controversy page and it also includes more recent debate.
For comments on either pages, click on the facebook box at the bottom of each page.
Contributors to the Arctic-News Blog each express their own view. While all contributors share a deep concern about the way climate change is unfolding in the Arctic, there can be strong differences in views between contributors on some issues.
This page discusses some of the issues where there appear to be opposing views among contributors.
Names of contributors are typically added at the top of posts, sometimes accompanied by descriptions with further background on contributors. Posts without the name of one or more specific contributors are written by Sam Carana. For more background on contributors, see the About page.
1. What kind of actions should be taken
Sam Carana was a founding member of the Arctic Methane Emergency Group (AMEG). In January 2013, persistent differences in view as to what action should be taken prompted Sam Carana to leave the group and to articulate the action proposed by Sam Carana in the Climate Plan, a comprehensive plan that advocates several lines of action to be implemented in parallel.
Differences in view on this issue continue to exist among contributors. Other contributors may advocate other action or may prefer to remain silent as to the specifics of some action. Nathan Currier has articulated the action he proposes at the site 1250now. Nick Breeze writes at Envisionation.
2. Non-linear trendlines (polynomial and exponential growth)
Paul Beckwith has expressed concerns that the use of polynomial trendlines, given their focus on recent data, are not appropriate in climate change projections. Paul therefore believes that, as a climate scientist, he needs to take distance from graphs using polynomial trendlines.
While acknowledging Paul's point, Sam Carana does use polynomial trendlines in graphs, arguing that polynomial trendlines do show scenarios that could eventuate in the near term and therefore constitute important warnings to reduce the risk of abrupt climate change.
Sam Carana as editor argues that the Arctic-news blog should alert readers when dangerous situations threaten to develop in the Arctic. Important in this regard is how the precautionary principle is interpreted. Risk is a combination of both the probability that something will eventuate and the severity of the consequences. The consequences of large amounts of methane escaping from the Arctic Ocean seafloor could be so severe that even a small chance that this will eventuate constitutes a huge risk and therefore deserves serious attention. Accordingly, argues Sam Carana, the precautionary principle therefore should lead to comprehensive and effective action to reduce the risk.
One characteristic of polynomial trendlines is that they can amplify relatively small recent rises or falls, making the trendline go through the roof when extended far into the future. This can be avoided by limiting the plot area of the graph.
 |
| NASA image |
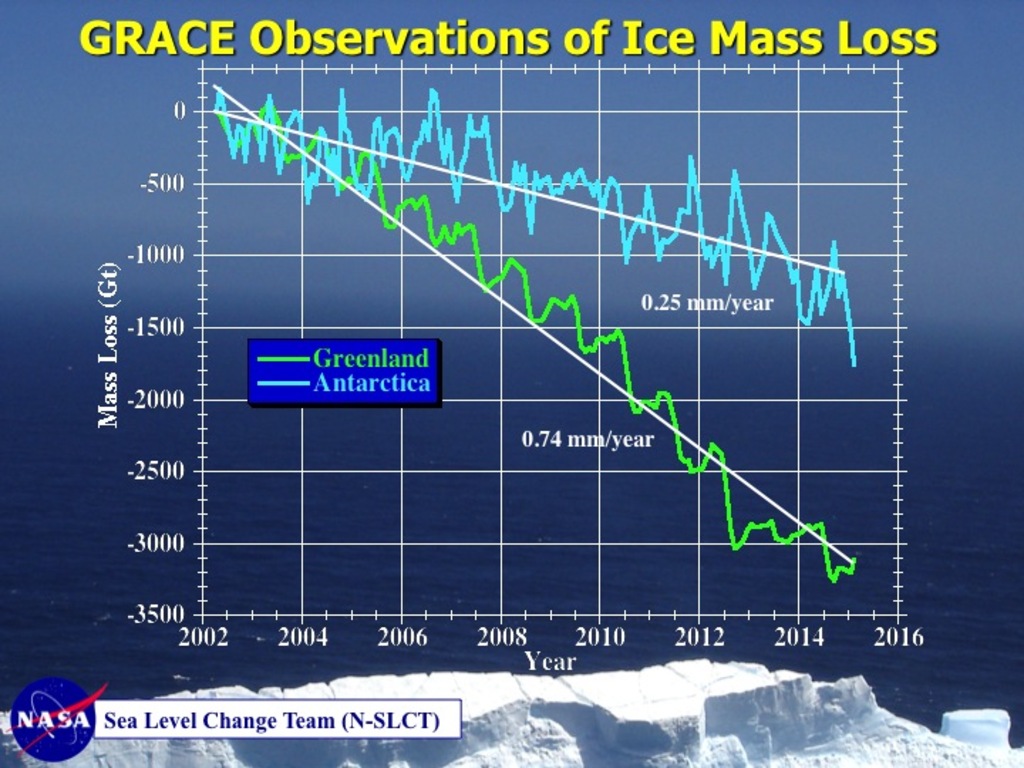
 Polynomial trendlines are not the only way to warn about accelerating developments. The image on the right shows ice mass loss on Greenland and Antarctica. The Grace satellites were launched in March 2002, so we only have these data from 2002 to 2015. The baseline can be put anywhere between 2002 and 2015, without changing the shape of graphs. Putting the baseline at 2002, as in the top image right, could create the false impression that no melting had occurred prior to 2002. Putting the baseline halfway in between 2002 and 2015, as in the image on the right below, therefore makes more sense.
The baseline is thus put halfway in between the years for which data are available, which shows that the ice mass has fallen more steeply on Greenland than on Antarctica. It also makes it easier to spot acceleration of ice loss. Acceleration of ice loss on Antarctica is relatively minor, starting at about +1000 Gt and ending at about -1000 Gt It was actually somewhat below -1000 Gt for a while in 2014. Anyway, ice loss on Greenland was not only more, the loss is also speeding up, starting at +1500 Gt and ending at far below -1500 Gt, i.e. at about -2000 Gt. This way, the graph shows more clearly that Greenland's ice loss is speeding up in a non-linear way, without resorting to polynomial trendlines to show this.
Nonetheless, a polynomial trendline is much stronger in making this point, when extending the trend into the future, as illustrated by the graph below.
 |
| Dramatic ice mass loss on Greenland looks set to get even worse. |
 |
| INSET: while a polynomial trendline captures the rise from 2000 and extends it into the future, a linear trendline doesn't project temperature anomalies to rise above 1°C before 2020, even though the January 2016 value was 1.82°C |
The comparison image below, from the FAQ page, illustrates that - in some cases - an exponential trendline can be more appropriate than a linear trendline. In this case, a linear trendline has 9 years fall outside its 95% confidence interval, versus only 4 years for an exponential trendline.

Furthermore, there are many feedbacks that can be expected to reinforce sea ice decline. Two such feedbacks are:
- albedo change, i.e. less sea ice means that more sunlight will be absorbed by the Arctic Ocean, rather than being reflected back into space as before; and
- storms that have more chance to grow stronger as the area with open water increases.
3. How much change in ice has there been on Antarctica and Greenland over the years and why is this a problem?
Above graph illustrates the threat of sea level rise, while the graph is also useful in the discussions as to how much change in ice there has been on Antarctica and Greenland over the years, e.g. in studies such as at
http://www.nasa.gov/feature/goddard/nasa-study-mass-gains-of-antarctic-ice-sheet-greater-than-losses Lead author Jay Zwally concludes: "If the 0.27 millimeters per year of sea level rise attributed to Antarctica in the IPCC report is not really coming from Antarctica, there must be some other contribution to sea level rise that is not accounted for.”
Sam Carana comments that it may well be that more sea level rise than previously thought is actually coming from Greenland, especially from its interior. As the above graph shows, ice loss on Antarctica is relatively minor compared to Greenland, where there was not only more ice loss, this loss is also speeding up, from +1500 Gt in 2002 to about -2000 Gt in 2014, with a trendline pointing at -7500 Gt in 2025.
Melting on Greenland (and North-East Canada) is enlarging the cold freshwater lid over the North Atlantic. This speeds up warming of the Arctic Ocean seafloor, threatening to unleash huge amounts of methane from destabilizing hydrates, as discussed at many posts at the Arctic-news blog, such as this one:
http://arctic-news.blogspot.com/2015/10/september-2015-sea-surface-warmest-on-record.html
4. Origin, accuracy and significance of high methane readings over the Arctic Ocean
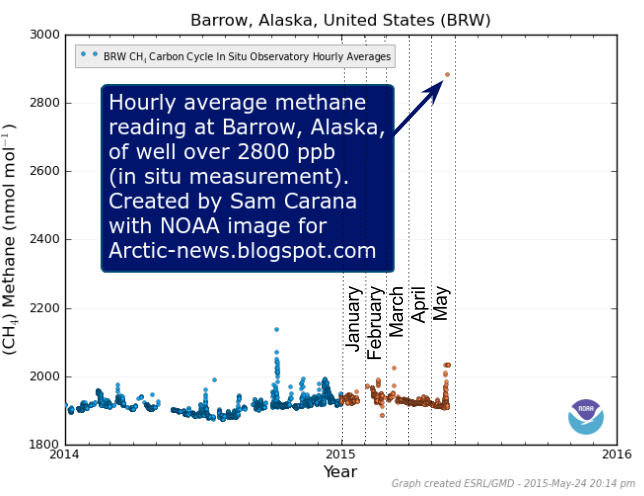
Nathan Currier has concerns about an image showing a high methane reading being posted at the Arctic-news blog (see image below).

Sam Carana, on the other hand, sees no good reason not to post such a reading. Sam Carana points at a more recent Barrow, Alaska, methane reading that confirms that methane levels as high as the above 2845 ppb are indeed recorded (image below). The veracity of both above image and the image below was confirmed by Harold Hensel who independently downloaded these images from the NOAA websites.

Sam Carana further argues that the reading is noteworthy as it is an additional indication that large abrupt methane releases from the seafloor of the Arctic Ocean constitute a threat that should be acted upon. As the post adds, the big danger is that the combined impact of these feedbacks will accelerate warming in the Arctic to a point where huge amounts of methane will erupt abruptly from the seafloor of the Arctic Ocean.
The image below shows high methane concentrations over the Arctic Ocean on October 11, 2015, pm, at 840 mb, i.e. relatively close to sea level. Note that methane concentrations over most of the Arctic Ocean are approaching 2000 ppb.

The image below shows high levels of methane over the Arctic Ocean at higher altitude (469 mb) on October 28, 2015, pm, when methane levels were as high as 2345 ppb.

Note that the above two images have different scales. The data are from different satellites.
The video below shows images from the MetOp-2 satellite, October 31, 2015, p.m., at altitudes from 3,483 to 34,759 ft or about 1 to 11 km (241 - 892 mb).
Peak methane levels were as high as 2450 ppb on November 1, 2015. Above images and video were part of the post at http://arctic-news.blogspot.com/2015/10/methane-vent-hole-in-arctic-sea-ice.html That post also covers another controversial issue, i.e. what could be the reason why spots appear in the sea ice?
Below follows (parts of) discussions on the origin of methane, in relation to methane levels as high as 3096 parts per billion on February 20, 2016, am, as recorded by the MetOp-1 satellite (image below).
 Question: Doesn't the image indicate that this high reading did result from methane releases in Baffin Bay or in East Asia?
Response: At first glance, the image may appear to indicate that, but read on (see paragraph below and further below under other responses).
Question: Could such a reading have a biological origin, such as wetlands in Siberia?
Response: Similarly, emissions from wetlands in Asia can be high, but methane with a biological origin will typically already cover a large area at lower altitudes, while it will typically also result in in prolonged high readings over days, starting a low altitudes and spreading out before reaching higher altitudes.
Methane eruptions from destabilizing hydrates at the seafloor of the Arctic Ocean will typically show up prominently over the Arctic at altitudes between about 4.4 and 6 km (14,400 and 19,800 ft), because such releases occur in plumes, i.e. the rise is very concentrated inside the area of the plume, while little or no increase in methane levels is taking place outside the plume. This makes that such a plume doesn't show up well at lower altitudes on satellite images, because the plume will cover less than half the area of one pixel. The methane will show up better at higher altitudes as it spreads out over larger areas. At higher altitudes, methane will follow the tropopause (see image below), i.e. the methane will rise in altitude while moving closer to the equator. (from FAQ).
To remain stable, hydrates need to remain under sufficiently high pressure in combination with sufficiently low temperature. In the Arctic, due to the relatively low temperatures there, hydrates can be present at shallower depth, even though this means there is lower pressure. Sufficiently low temperatures can thus keep the hydrate stable, but a small rise in temperature could be enough to destabilize it, resulting in expansion to 160x the earlier volume. The explosive character of the destabilization can in turn destabilize neighboring hydrates. Furthermore, it can create a conduit in the sediment for free gas to escape as well. Thus, a relatively small temperature rise (say, 1 or 2 degrees C) in a relatively small area can trigger a large abrupt release. Because it's a large abrupt release, the methane release is very concentrated, in a plume, and also since the water is shallow, there's less opportunity for microbes to break down the methane before it reaches the surface. Furthermore, once the methane does enter the atmosphere, there's little hydroxyl to break the methane down over the Arctic, extending the lifetime of methane there. (from facebook comment).
Question: Could such a high reading have resulting from methane released in Siberia (either from wetlands, wildfires, leaking pipelines or other industrial leaks), that was subsequently carried by winds over the Arctic Ocean?
Response: Prevailing winds that day were toward to coast of Siberia, according to this map with wind flow direction at that time in the area.
There are some further indications that these high methane levels likely originated from destabilizing methane hydrates in sediments of the East Siberian Arctic Shelf (ESAS).
The MetOp satellites are polar-orbiting satellites that each make two orbits around Earth a day.
The image on the right shows that, later that day at the same altitude, methane had spread out more over the ESAS, particularly toward to coast of Siberia (in line with prevailing winds), with generally less methane showing up elsewhere.
Further analysis indicates that these high levels likely originated from destabilizing methane hydrates in sediments, from a location about latitude 85°North and longitude +105° (East), on the Gakkel Ridge, just outside the East Siberian Arctic Shelf, at the location of the red marker on the map below.
Question: Could the high methane readings have resulted from seismic events (earthquakes and/or resulting underwater landslides or shock pulses, or volcano eruptions)?
Response: Seismic activity can trigger methane hydrate destabilization, but in this case no such activity appears to have been detected in the Arctic Ocean (as yet), see maps of recent activity and earthquakes over the past year. Isostatic rebound and seismic activity in general are less likely to occur in this area at this time of year.
More likely, the release was triggered by warmer water reaching the seafloor of the Arctic Ocean in that area. Below is a map with sea surface temperature anomalies on February 20, 2016, indicating that the water was warmer than it used to be across the Arctic Ocean. The green circle marks the likely location of sediment destabilization and subsequent methane plume, at about latitude 85°North and longitude +105° (East), on the Gakkel Ridge, just outside the East Siberian Arctic Shelf.
Question: If it did originate from the Arctic Ocean, why didn't microbes break down the methane in the water?
Response: There often are enough microbes to break down (most of the) methane in the water, but there are many factors that are not helpful in this case, such as:
- low temperatures, little sunlight, low nutrients and oxygen levels do not encourage microbes to grow;
- currents are long, so if microbes drift away, they are unlikely to return to a location with lots of methane;
- the methane is very concentrated and rises in plumes, making that much of the methane can reach the surface before microbes get it;
- shallow seas further make that the methane can rise to the surface before microbes get it;
- once methane enters the atmosphere, there's very little hydroxyl in the atmosphere over the Arctic to decompose the methane
Plenty of microbes will be around in case of stable temperatures and gradual methane releases that are more or less continuous, as this will enable the microbes to keep feeding on the methane and thus grow in quantity. The danger is that ocean heat will suddenly penetrate sediments down cracks and fractures, and down conduits formed by previous releases. In case the heat suddenly reaches hydrates, abrupt releases can take place of methane rising in plumes that are very concentrated. The concentrated and abrupt nature of such releases makes that few microbes will be around, while depletion of oxygen and metal ions will further make that much of the methane will reach the surface, the more so in the shallow seas that are so common in the Arctic. Depletion of oxygen and metal ions is a problem below the surface of the sea, hydroxyl depletion is a problem once such plumes enter the atmosphere, while - as said - hydroxyl levels over the Arctic are already very low.
Part of the above discussion is still visible at the Arctic News group. Further contributions to this discussion are welcome.
Sam Carana comments that it may well be that more sea level rise than previously thought is actually coming from Greenland, especially from its interior. As the above graph shows, ice loss on Antarctica is relatively minor compared to Greenland, where there was not only more ice loss, this loss is also speeding up, from +1500 Gt in 2002 to about -2000 Gt in 2014, with a trendline pointing at -7500 Gt in 2025.
Melting on Greenland (and North-East Canada) is enlarging the cold freshwater lid over the North Atlantic. This speeds up warming of the Arctic Ocean seafloor, threatening to unleash huge amounts of methane from destabilizing hydrates, as discussed at many posts at the Arctic-news blog, such as this one:
http://arctic-news.blogspot.com/2015/10/september-2015-sea-surface-warmest-on-record.html
4. Origin, accuracy and significance of high methane readings over the Arctic Ocean
Nathan Currier has concerns about an image showing a high methane reading being posted at the Arctic-news blog (see image below).
Sam Carana, on the other hand, sees no good reason not to post such a reading. Sam Carana points at a more recent Barrow, Alaska, methane reading that confirms that methane levels as high as the above 2845 ppb are indeed recorded (image below). The veracity of both above image and the image below was confirmed by Harold Hensel who independently downloaded these images from the NOAA websites.
Sam Carana further argues that the reading is noteworthy as it is an additional indication that large abrupt methane releases from the seafloor of the Arctic Ocean constitute a threat that should be acted upon. As the post adds, the big danger is that the combined impact of these feedbacks will accelerate warming in the Arctic to a point where huge amounts of methane will erupt abruptly from the seafloor of the Arctic Ocean.
The image below shows high methane concentrations over the Arctic Ocean on October 11, 2015, pm, at 840 mb, i.e. relatively close to sea level. Note that methane concentrations over most of the Arctic Ocean are approaching 2000 ppb.

The image below shows high levels of methane over the Arctic Ocean at higher altitude (469 mb) on October 28, 2015, pm, when methane levels were as high as 2345 ppb.

Note that the above two images have different scales. The data are from different satellites.
The video below shows images from the MetOp-2 satellite, October 31, 2015, p.m., at altitudes from 3,483 to 34,759 ft or about 1 to 11 km (241 - 892 mb).
Peak methane levels were as high as 2450 ppb on November 1, 2015. Above images and video were part of the post at http://arctic-news.blogspot.com/2015/10/methane-vent-hole-in-arctic-sea-ice.html That post also covers another controversial issue, i.e. what could be the reason why spots appear in the sea ice?
Below follows (parts of) discussions on the origin of methane, in relation to methane levels as high as 3096 parts per billion on February 20, 2016, am, as recorded by the MetOp-1 satellite (image below).

Response: At first glance, the image may appear to indicate that, but read on (see paragraph below and further below under other responses).
Methane can accumulate under the sea ice and be carried by currents into Baffin Bay, where it then enters the atmosphere. If so, however, it would be more likely result in prolonged high readings over Baffin Bay, rather than a sudden peak. Read on below for more considerations.
Question: Could such a reading have a biological origin, such as wetlands in Siberia?
Response: Similarly, emissions from wetlands in Asia can be high, but methane with a biological origin will typically already cover a large area at lower altitudes, while it will typically also result in in prolonged high readings over days, starting a low altitudes and spreading out before reaching higher altitudes.
Methane eruptions from destabilizing hydrates at the seafloor of the Arctic Ocean will typically show up prominently over the Arctic at altitudes between about 4.4 and 6 km (14,400 and 19,800 ft), because such releases occur in plumes, i.e. the rise is very concentrated inside the area of the plume, while little or no increase in methane levels is taking place outside the plume. This makes that such a plume doesn't show up well at lower altitudes on satellite images, because the plume will cover less than half the area of one pixel. The methane will show up better at higher altitudes as it spreads out over larger areas. At higher altitudes, methane will follow the tropopause (see image below), i.e. the methane will rise in altitude while moving closer to the equator. (from FAQ).
To remain stable, hydrates need to remain under sufficiently high pressure in combination with sufficiently low temperature. In the Arctic, due to the relatively low temperatures there, hydrates can be present at shallower depth, even though this means there is lower pressure. Sufficiently low temperatures can thus keep the hydrate stable, but a small rise in temperature could be enough to destabilize it, resulting in expansion to 160x the earlier volume. The explosive character of the destabilization can in turn destabilize neighboring hydrates. Furthermore, it can create a conduit in the sediment for free gas to escape as well. Thus, a relatively small temperature rise (say, 1 or 2 degrees C) in a relatively small area can trigger a large abrupt release. Because it's a large abrupt release, the methane release is very concentrated, in a plume, and also since the water is shallow, there's less opportunity for microbes to break down the methane before it reaches the surface. Furthermore, once the methane does enter the atmosphere, there's little hydroxyl to break the methane down over the Arctic, extending the lifetime of methane there. (from facebook comment).
Question: Could such a high reading have resulting from methane released in Siberia (either from wetlands, wildfires, leaking pipelines or other industrial leaks), that was subsequently carried by winds over the Arctic Ocean?
Response: Prevailing winds that day were toward to coast of Siberia, according to this map with wind flow direction at that time in the area.
 |
| [ click on image to enlarge ] |
There are some further indications that these high methane levels likely originated from destabilizing methane hydrates in sediments of the East Siberian Arctic Shelf (ESAS).
The MetOp satellites are polar-orbiting satellites that each make two orbits around Earth a day.
The image on the right shows that, later that day at the same altitude, methane had spread out more over the ESAS, particularly toward to coast of Siberia (in line with prevailing winds), with generally less methane showing up elsewhere.
Further analysis indicates that these high levels likely originated from destabilizing methane hydrates in sediments, from a location about latitude 85°North and longitude +105° (East), on the Gakkel Ridge, just outside the East Siberian Arctic Shelf, at the location of the red marker on the map below.

 |
| for large-size image, go to grida.no |
Response: Seismic activity can trigger methane hydrate destabilization, but in this case no such activity appears to have been detected in the Arctic Ocean (as yet), see maps of recent activity and earthquakes over the past year. Isostatic rebound and seismic activity in general are less likely to occur in this area at this time of year.
More likely, the release was triggered by warmer water reaching the seafloor of the Arctic Ocean in that area. Below is a map with sea surface temperature anomalies on February 20, 2016, indicating that the water was warmer than it used to be across the Arctic Ocean. The green circle marks the likely location of sediment destabilization and subsequent methane plume, at about latitude 85°North and longitude +105° (East), on the Gakkel Ridge, just outside the East Siberian Arctic Shelf.
 |
| zoom in and out at nullschool.net |
Response: There often are enough microbes to break down (most of the) methane in the water, but there are many factors that are not helpful in this case, such as:
- low temperatures, little sunlight, low nutrients and oxygen levels do not encourage microbes to grow;
- currents are long, so if microbes drift away, they are unlikely to return to a location with lots of methane;
- the methane is very concentrated and rises in plumes, making that much of the methane can reach the surface before microbes get it;
- shallow seas further make that the methane can rise to the surface before microbes get it;
- once methane enters the atmosphere, there's very little hydroxyl in the atmosphere over the Arctic to decompose the methane
Plenty of microbes will be around in case of stable temperatures and gradual methane releases that are more or less continuous, as this will enable the microbes to keep feeding on the methane and thus grow in quantity. The danger is that ocean heat will suddenly penetrate sediments down cracks and fractures, and down conduits formed by previous releases. In case the heat suddenly reaches hydrates, abrupt releases can take place of methane rising in plumes that are very concentrated. The concentrated and abrupt nature of such releases makes that few microbes will be around, while depletion of oxygen and metal ions will further make that much of the methane will reach the surface, the more so in the shallow seas that are so common in the Arctic. Depletion of oxygen and metal ions is a problem below the surface of the sea, hydroxyl depletion is a problem once such plumes enter the atmosphere, while - as said - hydroxyl levels over the Arctic are already very low.
Part of the above discussion is still visible at the Arctic News group. Further contributions to this discussion are welcome.
3 comments:
The Climate Plan calls for comprehensive action through multiple lines of action implemented across the world and in parallel, through effective policies such as local feebates. The Climate Plan calls for a global commitment to act, combined with implementation that is preferably local. In other words, while calling for a global commitment to take comprehensive and effective action to reduce the danger of catastrophic climate change, and while recommending specific policies and approaches as to how this can best be achieved, the Climate Plan at the same time invites and encourages local communities to decide what each works best for them, provided they each do indeed make the progress necessary to reach agreed targets. This makes that the Climate Plan optimizes flexibility for local communities and optimizes local job and investment opportunities.
Click for more on multiple lines of action, on recommended policies, and on the advantages of feebates.
Sam - RE: Methane readings
Could we not look for enrichment of 84Kr and 132Xe gasses? From papers I have read it seems to be an indicator of hydrate gas.
Do we have anyone who collects samples in the area run those sorts of tests?
Yes, isotopic signatures and noble gas ratios can be used to trace back gas releases to methane hydrates. Furthermore, acoustic and electrical properties can be measured to detect methane hydrates. Measuring electrical conductivity is a promising method to detect methane hydrates. Electrical resistance of methane hydrates is higher than seawater, so this can help detect methane hydrates even when they are not releasing methane.
New comments are not allowed.