Showing posts with label melting. Show all posts

Monday, October 8, 2018

What Does Runaway Warming Look Like?

The forcing caused by the rapid rise in the levels of greenhouse gases is far out of line with current temperatures. A 10°C higher temperature is more in line with these levels, as illustrated by the image below.


Carbon dioxide levels have been above 400 ppm for years. Methane levels above 1900 ppb were recorded in September 2018. Such high levels are more in line with a 10°C higher temperature, as illustrated by the above graph based on 420,000 years of ice core data from Vostok, Antarctica, research station.

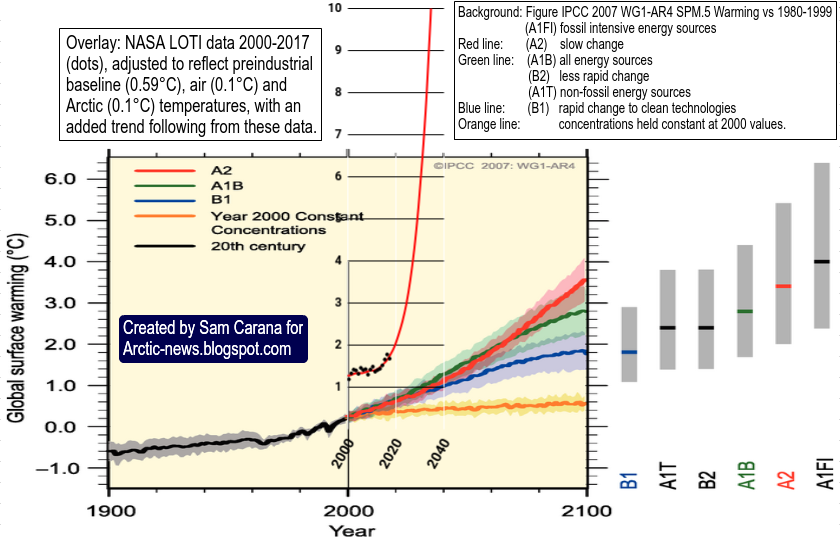
How fast could such a 10°C temperature rise eventuate? The image below gives an idea.


Such runaway warming would first of all and most prominently become manifest in the Arctic. In many ways, such a rise is already underway, as the remainder of this post will show.

High Arctic Temperatures

Why are Arctic temperatures currently so high for the time of year?


As warmer water enters the Arctic Ocean from the Atlantic and Pacific Oceans, there is no thick sea ice left to consume this heat. Some of this heat will escape from the Arctic Ocean to the atmosphere, as illustrated by above dmi.dk  image showing very high temperatures for the time of the year over the Arctic (higher than 80°C latitude).


Above dmi.dk image shows that Arctic temperatures are increasingly getting higher during Winter in the Northern Hemisphere.


Similarly, above NASA image shows that Arctic temperatures are increasingly getting higher during Winter in the Northern Hemisphere.


As the Arctic warms up faster than the rest of the world, the Jet Stream is becoming more wavy, allowing more hot air to move into the Arctic, while at the same time allowing more cold air to move south.

Above image shows that the air over the Beaufort Sea was as warm as 12.8°C or 55°F (circle, at 850 mb) on October 2, 2018. The image also illustrates that a warmer world comes with increasingly stronger cyclonic winds.


The images above and below shows that on October 2 and 7, 2018, the sea surface in the Bering Strait was as much as 6°C or 10.7°F, respectively 6.4°C or 11.6°F warmer than 1981-2011 (at the green circle).


As temperatures on the continent are coming down in line with the change in seasons, the air temperature difference is increasing between - on the one hand - the air over continents on the Northern Hemisphere and - on the one hand - air over oceans on the Northern Hemisphere. This growing difference is speeding up winds accordingly, which in turn can also speed up the influx of water into the Arctic Ocean.

[ The Buffer has gone, feedback #14 on the Feedbacks page ]
Start of freezing period

Here's the danger. In October, Arctic sea ice is widening its extent, in line with the change of seasons. This means that less heat can escape from the Arctic Ocean to the atmosphere. Sealed off from the atmosphere by sea ice, greater mixing of heat in the water will occur down to the seafloor of the Arctic Ocean, while there is little or no ice buffer left to consume an influx of heat from the Atlantic and Pacific Oceans, increasing the danger that warm water will reach the seafloor of the Arctic Ocean and destabilize methane hydrates. 

Rising salt content of Arctic Ocean

It's not just the influx of heat that is the problem. There's also the salt. Ice will stay frozen and will not melt in freshwater until the temperature reaches 0°C (or 32°F). Ice in saltwater on the other hand will already have melted away at -2°C (or 28.4°F).

The animation of the right shows salty water rapidly flowing through the Bering Strait.

With the change of seasons, there is less rain over the Arctic Ocean. The sea ice also seals the water of the Arctic Ocean off from precipitation, so no more fresh water will be added to the Arctic Ocean due to rain falling or snow melting on the water.

In October, temperatures on land around the Arctic Ocean will have fallen below freezing point, so less fresh water will flow from glaciers and rivers into the Arctic Ocean. At that time of year, melting of sea ice has also stopped, so fresh water from melting sea ice is no longer added to the Arctic Ocean either.

Pingos and conduits. Hovland et al. (2006)
So, the Arctic Ocean is receiving less freshwater, while the influx of water from the Atlantic and Pacific Oceans is very salty. This higher salt content of the water makes it easier for ice to melt at the seafloor of the Arctic Ocean. Saltier warm water is causing ice in cracks and passages in sediments at the seafloor of the Arctic Ocean to melt, allowing methane contained in the sediment to escape.

[ click on images to enlarge ]
The image on the right, from a study by Hovland et al., shows that hydrates can exist at the end of conduits in the sediment, formed when methane did escape from such hydrates in the past. Heat can travel down such conduits relatively fast, warming up the hydrates and destabilizing them in the process, which can result in huge abrupt releases of methane.

Heat can penetrate cracks and conduits in the seafloor, destabilizing methane held in hydrates and in the form of free gas in the sediments.

Methane

peak methane levels as high as 2859 ppb
On October 2 and 7, 2018, peak methane levels were as high as 2838 ppb, respectively 2859 ppb, as the images on the right shows. Methane levels over the Beaufort Sea have been high for some time, and have remained high at very high altitudes.

The threat is that a number of tipping points are going to be crossed, including the buffer of latent heat, loss of albedo as Arctic sea ice disappears, methane releases from the seafloor and rapid melting of permafrost on land and associated decomposition of soils, resulting in additional greenhouse gases (CO₂, CH₄, N₂O and water vapor) entering the Arctic atmosphere, in a vicious self-reinforcing cycle of runaway warming.

A 10°C rise in temperature by 2026?


Above image shows how a 10°C or 18°F temperature rise from preindustrial could eventuate by 2026 (from earlier post).

The situation is dire and calls for comprehensive and effective action, as described at the Climate Plan.


Links

• Temperature Rise
https://arctic-news.blogspot.com/2017/08/temperature-rise.html

• Mean Methane Levels reach 1800 ppb
https://arctic-news.blogspot.com/2013/06/mean-methane-levels-reach-1800-ppb.html

• Why are methane levels over the Arctic Ocean high from October to March?
https://arctic-news.blogspot.com/2015/01/why-are-methane-levels-over-the-arctic-ocean-high-from-october-to-march.html

• Blue Ocean Event
https://arctic-news.blogspot.com/2018/09/blue-ocean-event.html

• Feedbacks
https://arctic-news.blogspot.com/p/feedbacks.html

• The Threat
https://arctic-news.blogspot.com/p/threat.html

• Extinction
https://arctic-news.blogspot.com/p/extinction.html

• Aerosols
https://arctic-news.blogspot.com/p/aerosols.html

• How extreme will it get?
https://arctic-news.blogspot.com/2012/07/how-extreme-will-it-get.html

• Climate Plan
https://arctic-news.blogspot.com/p/climateplan.html


Friday, July 10, 2015

Arctic Sea Ice Collapse Threatens

The image below compares the Arctic sea ice thickness on July 14, 2012 (left panel) and on July 14, 2015 (right panel), using Naval Research Laboratory images.


The Naval Research Laboratory's 30-day animation below shows how this situation developed, ending with a forecast for July 17, 2015, run on July 9, 2015.


The dramatic decline of the sea ice, especially north of North America, is the result of a combination of factors, including:

  • very high levels of greenhouse gases over the Arctic Ocean
  • very high levels of ocean heat 
  • heatwaves over North America and Siberia extending high air temperatures over the Arctic Ocean
  • wildfires triggered by these heatwaves resulting in darkening compounds settling on snow and ice
  • very warm river water running into the Arctic Ocean, as illustrated by the image below.  


With still two months of melting to go before the sea ice can be expected to reach its minimum for 2015, the threat of sea ice collapse is ominous. The Arctic-News Blog has been warning for years about the growing chance of a collapse of the sea ice, in which case huge amounts of sunlight that previously were reflected back into space, as well as heat that previously went into melting the ice, will then instead have to be absorbed by the water, resulting in a dramatic rise of sea surface temperatures.

The image below shows the already very high sea surface temperature anomalies as at July 10, 2015.


More open water will then come with an increased chance of storms that can cause high sea surface temperatures to be mixed down all the way to seafloor of the Arctic Ocean, which in many cases is less than 50 m (164 ft) deep.

Meanwhile, ocean heat is accumulating off the coast of North America, as illustrated by the image below showing sea surface temperature as high as 31.8°C (89.24°F) on July 8-9, 2015.


Massive amounts of ocean heat will be carried by the Gulf Stream into the Arctic Ocean over the next few months. The combined result of high sea surface temperatures being mixed down to the seafloor and the ocean heat entering the Arctic Ocean from the Atlantic and Pacific Oceans can be expected to result in dramatic methane eruptions from the Arctic Ocean seafloor by October 2015.

Currently, methane levels are high, especially north of Greenland, as illustrated by the image below showing that on July 10, 2015 (am), levels as high as 2416 parts per billion were recorded at 6,041 m (19,820 ft) altitude, while mean methane levels also reached 1831 parts per billion at this altitude.


The situation is dire and calls for comprehensive and effective action, as discussed at the Climate Plan.


ARCTIC SEA ICE COLLAPSE THREATENSThis image compares the Arctic sea ice thickness on July 14, 2012 (left panel) and on...
Posted by Sam Carana on Friday, July 10, 2015

Wednesday, January 28, 2015

Rain Storms Devastate Arctic Ice And Glaciers

by Veli Albert Kallio


The Norwegian Svalbard Islands are located just few hundred miles from the North Pole. It is a unique environment for glaciers: Here glaciers can survive almost at sea level. This means that ice is constantly brushed by thick low-altitude air, which also dumps increasinlgy rain instead of snow.

As a result of high ocean temperatures and of precipitation nowadays falling as rain for months, the melting of these glaciers now occurs 25 times faster than just some years ago.

This also spells bad news for Northern Greenland's low lying glaciers, which will face increasing summertime flash floods as the Arctic Ocean becomes ice free and warms up, and as precipitation falls in the form of rain, rather than snow.

Sea surface temperature of 17.5°C, west of Svalbard
click on image to enlarge
Last summer, for example, sea water west of the Svalbard reached +18C, which is perfect for swimming - but extremely bad for the cold glaciers on shore which mop up the warm moisture and rainfall from the warmed up ocean.

Flash floods falling on glacier soften the compacted snow very rapidly to honeycombed ice that is exceedingly watery and without any internal strength.

Such ice can collapse simply under its own weight and the pulverised watery ice in the basin forms a near frictionless layer of debris.

Darkening of the melting ice also hastens its warming and melting.

Aggressively honeycombed glacier ice floating on meltwater lake in nearby Iceland.   Image credit: Runólfur Hauksson


click on image to enlarge

Changes to the Jet Streams

As the Arctic continues to warm, the temperature difference between the equator and the Arctic declines. This slows down the speed at which the polar vortex and jet streams circumnavigate the globe and results in more wavier jet streams that can enter and even cross the Arctic Ocean and can also descend deep down over the continents, rather than staying between 50 and 60 degrees latitude, where the polar jet streams used to be (as discussed in a recent post).

Such deep descent over continents can cause very low temperatures on land, while at the same time oceans remain warm and are getting warmer, so the temperature difference between land and ocean increases, speeding up the winds between continents. On January 9, 2015, jet streams reached speeds between continents as high as 410 km/h (255 mps), as shown on above image. Also note the jet stream crossing the Arctic Ocean.

Faster winds means more water evaporation, and warmer air holds more water vapor, so this can result in huge rainstorms that can rapidly devastate the integrity of the ice.

[image and text in yellow panels by Sam Carana]


I suspect that climatically-speaking we are currently entering a methane-driven Bøllinger warming state with the Northern Cryosphere now entering a phase of rapid warming and melting of anything frozen (snow, sea ice, permafrost and sea bed methane clathrates).

This will be rapidly followed by a Heindrich Iceberg Calving event when the warmed and wet ice sheet in Greenland gives away to its increased weight (due to excessive melt water accumulation within and beneath the ice sheet).

This dislodges the ice sheet’s top, due to accumulation of “rotten ice” (honeycombed, soft ice with zero internal strength) at the ice sheet’s base and perimeters.

A huge melt water pulse to the ocean ensues with Jōkullhaups and ice debris loading the ocean with vast amounts of cold fresh water.

Within weeks an immense climatological reversal then occurs as the ocean gets loaded up with ice debris and cold water leading to the Last Dryas cooling and to world-wide droughts.

This loading of the ocean with ice and water leads to severe climatic flop, as the ocean and atmosphere cool rapidly and as falling salinity and sea water temperature briefly reverse all of the current Bøllinger warming, until the climatic forcing of the greenhouse gases again takes over the process, in turn leading to a new melt water pulse as another ice sheet or shelf disintegrates by the next warming.

Today’s rapid melt water lake formation in Greenland and the ultra-fast melting of glaciers are suggestive of near imminent deglaciation process in the Arctic.

Germany’s and Japan’s recent decisions to remove all their nuclear reactors from the sea sides may prove their worth sooner than many think in the far more conservative US and UK where “glacial speed” still means “eons of time”. Good luck UK/US!

I think cold 'Dryases' are not real Ice Ages, but hiatuses in a progressive melting process which results from changes in sea water salinity and temperature due to increases of meltwater and ice debris runoff from continental snow and ice that melt. As ocean gets less saline and colder the sea ice and snow cover temporarily grows.

But in the long run the greenhouse gas forcing and ocean wins and the warmth and melting resumes until the next big collapse of ice shelf and/or ice sheet. Hence there are meltwater pulses (such as 1a, 1b, 1c) and Heindrich Ice Berg Calving surges (2, 1, 0 - the last one being also called "Younger Dryas" as the Arctic Dryas octopetala grew in South once again after Ice Ages).

The next cooling from collapse of Greenland ice dome would be Heindrich Minus One as the zero has already been allocated to Younger Dryas ice berg surge. Here is an article worth reading on this risk. In Antarctica we see currently (already) a sea ice growth hiatus driven by increased runoff of melt water and ice debris from the continent and its surrounding ice shelves that are rapidly disintegrating.


Abrupt climate change happened in just one year

A 2008 study by Achim Brauer et al. of lake sediments concluded that abrupt increase in storminess during the autumn to spring seasons, occurring from one year to the next at 12,679 yr BP. This caused abrupt change in the North Atlantic westerlies towards a stronger and more zonal jet, leading to deglaciation.

A 2009 study by Jostein Bakke et al. confirmed that increased flux of fresh meltwater to the ocean repeatedly resulted in the formation of more extensive sea ice that pushed the jet south once more, thus re-establishing the stadial state. Rapid oscillations took place until the system finally switched to the interglacial state at the onset of the Holocene.

References

- An abrupt wind shift in western Europe at the onset of the Younger Dryas cold period, Brauer et al.
http://www.nature.com/ngeo/journal/v1/n8/abs/ngeo263.html

- Rapid oceanic and atmospheric changes during the Younger Dryas cold period, Bakke et al.
http://www.nature.com/ngeo/journal/v2/n3/abs/ngeo439.html


Monday, June 16, 2014

Warming of the Arctic Fueling Extreme Weather

Extreme weather

Heavy rains and floods hit Serbia and Bosnia in May 2014, as discussed in an earlier post.

Later in May, further flooding hit central Europe. From May 30 to June 1, 2014, parts of Austria received the amount of rain that normally falls in two-and-half months: 150 to 200 mm (5.9 to 7.9"), with some parts experiencing 250 mm (9.8").

What is fueling this extreme weather? Have a look at the image below.


The image shows a number of feedbacks that are accelerating warming in the Arctic. Feedback #14 refers to (latent) heat that previously went into melting. With the demise of the snow and ice cover, an increasing proportion of this heat gets absorbed and contributes to accelerated warming in the Arctic.

As the sea ice heats up, 2.06 J/g of heat goes into every degree Celsius that the temperature of the ice rises. While the ice is melting, all energy (at 334J/g) goes into changing ice into water and the temperature remains at 0°C (273.15K, 32°F). 

Once all ice has turned into water, all subsequent heat goes into heating up the water, at 4.18 J/g for every degree Celsius that the temperature of water rises.

The amount of energy absorbed by melting ice is as much as it takes to heat an equivalent mass of water from zero to 80°C. The energy required to melt a volume of ice can raise the temperature of the same volume of rock by 150º C.

Currently, the energy equivalent of 1.5 million Hiroshima bombs goes into melting of the Arctic sea ice each year, according to calculations by Sam Carana.

As the ice disappears, this energy will instead be absorbed elsewhere and cause temperatures in the Arctic to rise further, indicated as feedback #14.

This comes on top of the albedo feedback #1 that can on its own more than double the net radiative forcing resulting from the emissions caused by all people of the world, according to calculations by Prof. Peter Wadhams.

Further feedbacks include changes to the polar vortex and jet stream that are in turn causing more extreme weather, as also described in the earlier post Feedbacks in the Arctic.


Global Warming

Higher levels of greenhouse gases are trapping more heat in the atmosphere, resulting in more intense heatwaves in some places, while stronger winds and greater evaporation of water from the sea lead to stronger rainfall in other places. Global warming thus contributes to more extreme weather around the globe.

The Arctic is hit not only by the warming resulting from greenhouse gas emissions, but also by emissions of soot, dust and other compounds that settle on the snow and ice cover and speed up its demise.

As illustrated by the image below, by Nuccitelli et al., most heat goes into the oceans. A substantial amount of heat also goes into the melting of ice.

A lot of ocean heat is transported by the Gulf Stream into the Arctic Ocean. The North Atlantic is hit particularly strongly by pollution from North America, as illustrated by the image below.

[ screenshot from Perdue University's Vulcan animation ]
Heat carried by the Gulf Stream into the Arctic Ocean contributes to high sea surface anomalies in the Arctic, as illustrated by the image below. Arctic sea ice is under threat from heat from the North Atlantic, while heat from the Pacific Ocean that was in part caused by pollution from east-Asia is now threatening to enter the Arctic Ocean through the Bering Strait, as illustrated by the image below that shows areas with sea surface temperature anomalies well over 8 degrees Celsius. 

[ click on image to enlarge ]
Warmer water in the Arctic Ocean in turn causes methane to be released from the seafloor of the Arctic Ocean, as discussed further below. 


Accelerated Warming in the Arctic

As said, warming hits the Arctic particularly strongly due to feedbacks such as albedo changes caused by the demise of the snow and ice cover in the Arctic. Another feedback is a changing jet stream. The jet stream used to circumnavigate the globe at high speed, separating climate systems that used to be vastly different above and below the jet stream. Accelerated warming in the Arctic is decreasing the temperature difference between the Arctic and the Equator, in turn causing the jet stream to slow down and become wavier. As a result, air can more easily move north to south and visa versa, especially when the jet stream's waves expand vertically and take a long time to move from west to east (i.e. a blocking pattern).

These changes to the jet stream are fueling extreme weather events. In the May/June event, a large loop had developed in the jet stream over Europe and got stuck in place, making a strong southerly wind carry moisture-laden air from the Mediterranean Sea over Central Europe, clashing with colder air flowing down from the north as the jet stream was stuck in such a blocking pattern.

Record May heat hit northern Finland and surrounding regions of Russia and Sweden. Earlier in May (on May 19) an all-time national heat record was set of 91.4°F (33.0°C) in St. Petersburg, Russia, slashing the previous record by a wide margin. This temperature was unprecedented in records in St. Petersburg that started in 1881 and show a previous May record set in 1958 of 87.6°F (30.9°C).

The compilation below shows the jet stream on three days (May 24, 25 and 27), on top of surface temperature anomalies for those days.

[ click on image to enlarge ]

Further illustrating the event is the animation below, showing the jet stream from May 26 to June 11, 2014. Note that this is a 14.5 MB file that may take some time to fully load.

[ click on image to enlarge ]
Methane

Huge methane emissions took place from the seafloor of the Arctic Ocean from September 2013 to March 2014. These emissions have meanwhile risen up higher in the atmosphere and have moved closer to the equator.


Compared to June 2013, mean methane levels at higher altitudes are now well over 10 ppb higher at higher altitudes while there has been only little change closer to the ground. Since these mean levels are global means, the difference is even more pronounced at specific locations on the Northern hemisphere, where clouds of methane originating from the Arctic are contributing to the occurence of heat waves.

The contribution of methane to such heatwaves depends on the density of the methane at the time in the atmosphere over the location during such events.

Highest global mean methane levels varied from 1907 ppb to 1812 ppb for the period June 6 to 15, 2014, as illustrated by the image on the right, and peak methane concentration varied a lot from day to day. On June 6, 2014, peak readings as high as 2516 ppb were recorded.

Indicative for what can be the result is the temperature anomaly on May 19, when temperatures went up as high as 91.4°F (33.0°C) in St. Petersburg, Russia, slashing the previous record by a wide margin, of more than 2°C, as described above


Conclusion

The situation is the Arctic is threatening to escalate into runaway warming and urgently requires comprehensive and effective action as discussed at the Climate Plan blog.


References

- May 2014 Global Weather Extremes Summary

- Extreme Jet Stream Pattern Triggers Historic European Floods
http://www.wunderground.com/blog/JeffMasters/extreme-jet-stream-pattern-triggers-historic-european-floods


Related posts

- The Biggest Story of 2013
http://arctic-news.blogspot.com/2013/12/the-biggest-story-of-2013.html

- Climate Plan
http://climateplan.blogspot.com
- More extreme weather can be expected
http://arctic-news.blogspot.com/2014/05/more-extreme-weather-can-be-expected.html

- Extreme weather strikes around the globe - update
http://arctic-news.blogspot.com/2014/02/extreme-weather-strikes-around-the-globe-update.html

- Escalating extreme weather events to hammer humanity (by Paul Beckwith)
http://arctic-news.blogspot.com/2014/04/escalating-extreme-weather-events-to-hammer-humanity.html

- Our New Climate and Weather (by Paul Beckwith)
http://arctic-news.blogspot.com/2014/01/our-new-climate-and-weather.html

- Our New Climate and Weather - part 2 (by Paul Beckwith)
http://arctic-news.blogspot.com/2014/01/our-new-climate-and-weather-part-2.html

- Changes to Polar Vortex affect mile-deep ocean circulation patterns
http://arctic-news.blogspot.com/2012/09/changes-to-polar-vortex-affect-mile-deep-ocean-circulation-patterns.html

- Polar jet stream appears hugely deformed
http://arctic-news.blogspot.com/2012/12/polar-jet-stream-appears-hugely-deformed.html


Monday, April 7, 2014

Permafrost thawing could accelerate global warming


"If the permafrost melts entirely, there would be 5x the amount of carbon in the atmosphere than there is now" - Jeff Chanton

Jeff Chanton, the John Widmer
Winchester Professor of
Oceanography at Florida State.
A team of researchers lead by Florida State University have found new evidence that permafrost thawing is releasing large quantities of greenhouse gases into the atmosphere via plants, which could accelerate warming trends.

The research is featured in the newest edition of the Proceedings of the National Academy of Sciences.

“We’ve known for a while now that permafrost is thawing,” said Suzanne Hodgkins, the lead author on the paper and a doctoral student in chemical oceanography at Florida State. “But what we’ve found is that the associated changes in plant community composition in the polar regions could lead to way more carbon being released into the atmosphere as methane.”

Permafrost is soil that is frozen year round and is typically located in polar regions. As the world has gotten slightly warmer, that permafrost is thawing and decomposing, which is producing increased amounts of methane.

Relative to carbon dioxide, methane has a disproportionately large global warming potential. Methane is 33 times more effective at warming the Earth on a mass basis and a century time scale relative to carbon dioxide.

Changes in plant community composition in the polar regions could lead to way more carbon being released into the atmosphere as methane

As the plants break down, they are releasing carbon into the atmosphere. And if the permafrost melts entirely, there would be five times the amount of carbon in the atmosphere than there is now, said Jeff Chanton, the John Widmer Winchester Professor of Oceanography at Florida State.

“The world is getting warmer, and the additional release of gas would only add to our problems,” he said.

Chanton and Hodgkins’ work, “Changes in peat chemistry associated with permafrost thaw increase greenhouse gas production,” was funded by a three-year, $400,000 Department of Energy grant. They traveled to Sweden multiple times to collect soil samples for the study.

The research is a multicontinent effort with researchers from North America, Europe and Australia all contributing to the work.

Wednesday, February 19, 2014

High methane levels over the Arctic Ocean on February 17, 2014


Above image shows IASI methane readings over the last day or so, when levels as high as 2223 ppb were recorded.

Where does the methane come from?

On above image, methane shows up prominently along the faultline that crosses the Arctic Ocean from the northern tip of Greenland to the Laptev Sea. This indicates that the methane originated from the depths of the Arctic Ocean, where sediments contain large amounts of methane in the form of free gas and hydrates, which have become destabilized.

High methane concentrations have persistently shown up over the Arctic Ocean since October 1, 2013. On January 19, 2014, levels as high as 2363 ppb were recorded over the Arctic Ocean, as illustrated by the image below, from an earlier post.

[ from earlier post, click on image to enlarge ]
Below is a comparison of methane readings for the week from February 9 to 16, 2014, compared to the same period in 2013.

[ from earlier post, click on image to enlarge ]
The above comparison shows that there is a lot of methane over the Arctic Ocean that wasn't there last year. 

Furthermore, high methane readings show up where currents move the sea ice out of the Arctic Ocean, in areas such as Baffin Bay. This indicates that methane that is released from the seafloor of the Arctic Ocean appears to be moving underneath the ice along with exit currents and entering the atmosphere where the sea ice is fractured or thin enough to allow the methane to pass through. 

Also note that more orange areas show up on the southern hemisphere in 2014, indicating that more methane from the northern hemisphere is now spreading south beyond the equator. This in addition to indications that more methane is rising and building up at higher altitudes, as discussed in an earlier post.

Causes

What made these high releases from the seafloor of the Arctic Ocean persist for so long? At this time of year, one might have thought that the water in the Arctic Ocean would be much colder than it was, say, on October 1, 2013.

Actually, as the combination image below shows, sea surface temperatures have not fallen much at the center of the Arctic Ocean between early October, 2013 (left) and February 17, 2014 (right). In the area where these high methane concentrations occured, sea surface temperatures have remained the same, at about zero degrees Celsius.

[ click on image to enlarge ]
The above comparison image shows that, while surface temperatures in the Atlantic Ocean may have fallen strongly with the change of seasons, surface temperatures in the Arctic Ocean have changed only little.

In this case of course, what matters more than surface temperatures are water temperatures at greater depth. Yet, even here temperatures in the Arctic Ocean will have decreased only slightly (if at all) compared to early October 2013, since the Gulf Stream has continued to push warmer water into the Arctic, i.e. water warmer than the water in the Arctic Ocean, so the heating impact of the Gulf Stream continues. Also, sea surface temperature anomalies along the path of the Gulf Stream continue to be anomalously high, as the image below shows.


The situation looks even more grim on the Climate Reanalyzer image below, showing sea surface temperature anomalies that are far more profound in the Arctic Ocean.


Note also that, as the sea ice extent increased, there have been less opportunities for the heat to evaporate on the surface and for heat to be transferred from the Arctic Ocean to the air.

Finally, what matters a lot is salinity. The combination image below compares salinity levels between October 1, 2013 (left), and February 17, 2014 (right).

[ click on image to enlarge ]
Salinity levels were low on October 1, 2013, as a lot of ice and snow had melted in the northern summer and rivers had carried a lot of fresh water into the Arctic Ocean. After October 1, 2013, little or no melting took place, yet the Gulf Stream continued to carry waters with higher salt levels from the Atlantic Ocean into the Arctic Ocean.

Annual mean sea surface salinity
Seawater typically has a salinity level of over 3%; it freezes and melts at about −2°C (28°F). Where more saline water from the Atlantic Ocean flows into the Arctic Ocean, the water in the Arctic Ocean becomes more saline. The freezing and melting point of fresh water (i.e. zero salinity) is 0°C (or 32°F). More salinity makes frozen water more prone to melting, i.e. at temperatures lower than 0°C, or as low as −2°C.

As the salinity levels of the water on the seafloor of the Arctic Ocean increased, the ice that had until then held the methane captive in hydrates on the seafloor of the Arctic Ocean started to melt. Indeed, the areas in the Arctic Ocean where the high methane releases occurred on January 14, 2014 (top image) show several practical salinity units (psu) increase since October 1, 2013.

Higher salinity levels are showing up closer to the faultline that runs through the Arctic Ocean from the top of Greenland to the Laptev Sea.

Thursday, January 16, 2014

High methane levels over the Arctic Ocean on January 14, 2014

[ click on image to enlarge - note that 'level' is the peak reading for the respective altitude ]
Above image shows IASI methane levels on January 14, 2014, when levels as high as 2329 ppb were recorded. This raises a number of questions. Did these high methane levels originate from releases from the Arctic Ocean, and if so, how could such high methane releases occur from the seafloor of the Arctic Ocean at this time of year, when temperatures in the northern hemisphere are falling?

Location

Let's first establish where the methane releases occurred that caused these high levels. After all, high methane concentrations are visible at a number of areas, most prominently at three areas, i.e. at the center of the Arctic Ocean, in Baffin Bay and over an area in Asia stretching out from the Taklamakan Desert to the Gobi Desert.

Closer examination, illustrated by the inset, shows that the highest methane levels were recorded in the afternoon, and at altitudes where methane concentrations over these Asian deserts and over Baffin Bay were less prominent, leading to the conclusion that these high methane levels did indeed originate from the seafloor of the Arctic Ocean.

The image below, showing 1950+ ppb readings over the past few days, illustrates the magnitude of the methane concentrations over the Arctic Ocean.


High concentrations persist over the Arctic Ocean

High methane concentrations have persistently shown up over the Arctic Ocean from October 1, 2013, through to January 2014. On January 19, 2014, levels as high as 2363 ppb were recorded over the Arctic Ocean, as illustrated by the image below.

[ click on image to enlarge ]
Causes

What caused these high releases from the seafloor of the Arctic Ocean to persist for so long? At this time of year, one may have thought that the water in the Arctic Ocean would be much colder than it was, say, on October 1, 2013.

Actually, as the combination image below shows, sea surface temperatures have not decreased much at the center of the Arctic Ocean between early October, 2013 (left) and January 14, 2014 (right). In the area where these high methane concentrations occured, sea surface temperatures have remained the same, at about zero degrees Celsius.

[ click on image to enlarge ]
Furthermore, as the above image shows, surface temperatures in the Atlantic Ocean may have fallen dramatically with the change of season, but temperatures in the Arctic Ocean have changed only little.

In this case of course, what matters more than surface temperatures are water temperatures at greater depth. Yet, even here temperatures in the Arctic Ocean will have decreased only slightly since early October 2013, as the Gulf Stream has continued to push warmer water into the Arctic, i.e. water warmer than the water in the Arctic Ocean. In other words, the heating impact of the Gulf Stream has continued.

Furthermore, as the sea ice extent increased, there have been less opportunities for the heat to evaporate on the surface and for heat to be transferred from the Arctic Ocean to the air.

Finally, what matters a lot is salinity. The combination image below compares salinity levels between October 1, 2013 (left), and January 14, 2014 (right).

[ click on image to enlarge ]
Salinity levels were low on October 1, 2013, as a lot of ice and snow had melted in the northern summer and rivers had carried a lot of fresh water into the Arctic Ocean. After October 1, 2013, little or no melting took place, yet the Gulf Stream continued to carry waters with higher salt levels from the Atlantic Ocean into the Arctic Ocean.

Annual mean sea surface salinity
Seawater typically has a salinity level of over 3%; it freezes and melts at about −2°C (28°F). Where more saline water from the Atlantic Ocean flows into the Arctic Ocean, the water in the Arctic Ocean becomes more saline. The freezing and melting point of fresh water (i.e. zero salinity) is 0°C (or 32°F). More salinity makes frozen water more prone to melting, i.e. at temperatures lower than 0°C, or as low as −2°C.

As the salinity levels of the water on the seafloor of the Arctic Ocean increased, the ice that had until then held the methane captive in hydrates on the seafloor of the Arctic Ocean started to melt. Indeed, the areas in the Arctic Ocean where the high methane releases occurred on January 14, 2014 (top image) show several practical salinity units (psu) increase since October 1, 2013.

Higher salinity levels are now reaching the faultline that runs through the Arctic Ocean from the top of Greenland to the Laptev Sea, where major releases are taking place now, as illustrated by the image below, with faultlines added on the insets.

[ click on image to enlarge ]
Above image shows methane levels recorded on the evening of January 16, 2014 (main image). The top left inset shows all methane readings of 1950 ppb and higher on January 15 and 16, 2014, while the bottom left inset shows methane readings of 1950 ppb and higher on January 16, 2014, p.m. only and for seven layers only (from 469 to 586 mb), when levels as high as 2353 ppb were reached (at 469 mb).

Quantities

These high levels of methane showing up over the Arctic Ocean constitute only part of the methane that did escape from the seafloor of the Arctic Ocean. Where these high concentrations did show up, the ocean can be thousands of meters deep, giving microbes plenty of opportunity to decompose methane rising through the water first. Furthermore, the methane has to pass through sea ice that is now getting more than one meter thick in the area where these high levels of methane showed up on satellite records. In conclusion, the quantities of methane that were actually released from the seafloor must have been huge.

Importantly, these are not one-off releases, such as could be the case when hydrates get destabilized by an earthquake. As the Arctic-news blog has documented, high releases from the seafloor of the Arctic Ocean have been showing up persistently since early October 2013, i.e. three months ago. This blog has warned about the threat for years. This blog has also described in detail the mechanisms that are causing these releases and the unfolding climate catastrophe that looks set to become more devastating every year.

Given that a study submitted in April 2013 concluded that 17 Tg annually was escaping from the East Siberian Arctic Shelf alone, given the vast quantity of the releases from hydrates that show up on IASI readings and given the prolonged periods over which releases from hydrates can persist, I put the methane being released from hydrates under the seafloor of the Arctic Ocean in the highest category, rivaling global emissions from fossil fuel, from agriculture and from wetlands. As said, the amounts of methane being released from hydrates will be greater than the methane that actually reaches the atmosphere. To put a figure on the latter, my estimate is that emissions from hydrates and permafrost currently amount to 100 Tg annually, a figure that is growing rapidly. This 100 Tg includes 1 Tg for permafrost, similar to IPCC estimates.


This is vastly more than the IPCC's most recent estimates, which put emissions from hydrates and permafrost at 7 Tg annually, a mere 1% of the total annual methane emissions globally, as illustrated by the image below.


Impacts and Response

Huge releases from the seafloor of the Arctic Ocean have occurred persistently since early October 2013, even when releases like this may show up for one day in one area without showing up in that same area the next day on satellite images.

This apparent 'disappearance' can be due to the Coriolis effect that appears to move the methane, whereas it is in fact the Earth that is spinning underneath the methane. This doesn't mean that the methane had disappeared. Actually, much of this methane will persist over the Arctic for many years to come and will continue to exercize its very high initial warming potential over the Arctic for years.

Furthermore, even if less methane may show up on satellite images the next day, that doesn't necessarily mean that releases from the seafloor has stopped. Instead, it looks like methane is being released continuously from destabilizing hydrates. The methane may accumulate underneath the sea ice for some time, to burst through at a moment when fractures or ruptures occur in the sea ice, due to changes in wind and wave height.


The threat here is that methane will further warm up the air over the Arctic, causing further weakening of the Jet Stream and further extreme weather events, particularly extreme warming of water all the way along the path of the Gulf Stream from the Atlantic Ocean into the Arctic Ocean, in turn triggering further releases from hydrates at the seafloor of the Arctic Ocean and escalating into runaway global warming. This threat calls for comprehensive and effective action, such as described at the ClimatePlan blog.