Both the sea ice thickness and sea ice area have fallen to new record lows for this time of the year (22.11.2015), even surpassing all of the worst previous years.
From Naval Research Laboratory image - view animation
Immense thrust of fast moving sea ice is pushing through at the full width of the Fram Strait between Norway and Greenland. This amounts to huge transport of latent coldness out of the Arctic Ocean to North Atlantic, while the constantly forming new sea ice (as temperatures are below 0°C) is generating heat to keep the surface air temperatures higher across the Arctic Ocean. Thus, heat is constantly being added to the Arctic Ocean while heat is taken away from the North Atlantic Ocean.
The normal sea ice area for this time of year is 9,625,000 km2, whereas the sea ice covers currently just 8,415,890 km2,, which makes that 1,209,120 km2 sea ice is missing from the normal (22.11) sea ice area.
The combination image below shows the jet stream (November 23, 2015, left panel) and surface wind (November 24, 2015, right panel).
Jet stream is wavy and strong, showing speeds as high as 219 mph or 352 km/h (at location marked by the green circle). Right panel shows cyclonic winds between Norway and Greenland speeding up movement of sea ice into the North Atlantic.
Forecasts indicate that conditions could continue. The 5-day forecast on the right shows strong winds in the North Atlantic. Note also the cyclonic winds outside the Bering Strait.
Temperatures over the Arctic are forecast to remain much higher than they used to be, with anomalies at the far end of the scale over a large part of the Arctic Ocean showing up on the 5-day temperature anomaly forecast below.
In October 2015, an area appeared in the Arctic sea ice where the temperature of the ice was a few degrees Celsius higher and where ice concentration and salinity levels were substantially lower than the surrounding ice. The image below pictures the situation on October 11, 2015.
[ click on image to enlarge ]
Could this have been an iceberg? If so, ice concentration should have been higher, rather than lower. More likely is that this is a vent hole with methane rising through cracks in the sea ice.
Malcolm Light comments: "The whole of the Arctic seabed is covered with methane hydrates and NASA satellites should have long ago defined where the major plumes were coming out. It is clearly a surface methane vent hole in the ocean ice analogous to the large methane vent holes that appeared all over northern Siberia this year. It means we have overheated the Arctic seafloor to the extent where the methane hydrates are now unstable and we could have further major releases at any time. We have already lit the fuse on a giant methane subsea permafrost bomb in the Arctic which can go off at any moment." Roger Caldwell responds: "I think it's upwelling warm water. There is a ridge right below the spot. I can see warm spots through the ice on the nullschool program. The warm water comes through the Bering Strait and sinks to the mid levels. When it gets to the ridge it flows upward, making a temporary polynya."
The image below shows warm water entering the Arctic Ocean from the Pacific Ocean (through the Bering Strait) and the Atlantic Ocean, with the dark-red color of many areas in the Arctic Ocean indicating warm waters, including an area close to the North Pole marked by the red circle. So, the spot could indeed be a polynya caused by upwelling of warm water. Alternatively to the Pacific Ocean, the warm water could have originated from the Atlantic Ocean. In the Fram Strait, near Svalbard, sea surface temperatures as high as 11.9°C or 53.5°F were recorded on October 28, 2015, i.e. 9.6°C or 17.2°F warmer than 1981-2011 (at the location marked by the green circle).
[ click on image to enlarge ]
Of course, with water this warm reaching the center of the Arctic Ocean, the threat that this will cause (further) destabilization of methane hydrates at the seafloor of the Arctic Ocean is equally ominous. The more recent image below shows warm waters in the Arctic Ocean in a different way, partly because the anomaly is calculated from the period 1961 to 1990.
The image below shows that sea surface temperatures as high as 12°C or 53.5°F were recorded near Svalbard on October 31, 2015, i.e. 9.7°C or 17.4°F warmer than 1981-2011 (at the location marked by the green circle).
[ click on image to enlarge ]
On the image below, Malcolm Light added the Gakkel Ridge, i.e. the fault line that extends on the seafloor of the Arctic Ocean from the northern tip of Greenland to Siberia (red line), and the location of explosive volcanoes (lilac spot), with content from Sohn et al., 2008.
A zone of increased heat near the North Pole which may be related to large quantities of gas released from a group of extremely pyroclastic carbon dioxide-rich volcanoes located at the Gakkel Ridge
The table below shows the height that emerging carbon dioxide plumes can be expected to reach for a given carbon dioxide volume fraction in the foam at the top of a magma chamber.
Malcolm Light adds: "Sohn et al. (2007) outlined how the sequence of extreme pyroclastic eruptions occur along the Gakkel Ridge (85°E volcanoes) at an ultra-slow plate spreading rate (<15-20 mm/year). These volcanoes formed from the explosive eruption of gas-rich magmatic foams. Long intervals between eruptions with slow spreading caused huge gas (volatile) build up high storage pressures, deep in the crust. Extension of the 85°E seismic swarm occurred over 3 months but later earthquakes were caused by large implosions from the explosive discharge of pressurized magmatic foam from a deep-lying magma chamber through the fractured chamber roof which rapidly accelerated vertically, expanded and decompressed. There were many periods of widespread explosive gas discharge from 1999 over two years detected by small-magnitude sound signals from seismic networks on the ice. Pyroclastic rocks contain bubble wall fragments and were widely distributed over an area of more than 10 square km. Deep fragmentation was caused by the accumulation of a gas (volatile) foam within the magma chamber which then fractured, formed a pyroclastic fountain 1-2 km high in the Arctic Ocean and spread the pyroclastic material over a region whose size was proportional to the depth of the magma chamber (see above table). A volatile carbon dioxide content of 14% (Wt./Wt. - volume fraction 75%) is necessary at 4 km depth in the Arctic Ocean to fragment the erupting magma."
As said, with water this warm reaching the center of the Arctic Ocean from the Atlantic and Pacific Oceans, the threat is that added heat from volcanic activity or pressure shocks from underwater earthquakes or landslides will trigger (further) destabilization of methane hydrates at the seafloor of the Arctic Ocean.
Below follows some more background.
Animations
Naval Research Laboratory 30-day animations are added below for temperature, concentration, salinity and thickness of the sea ice. Click on each of them to view full versions.
Temperature
Concentration
Salinity
Thickness
[ click on animations to enlarge ]
Background on tectonic plates and faults A major fault line crosses the Arctic Ocean, forming the boundary between two tectonic plates, the North American Plate and the Eurasian Plate. These plates slowly diverge, creating seismic tension along the fault line. From where the Mid-Atlantic ridge enters the Arctic Ocean, it is called the Gakkel Ridge. The fault continues as the Laptev Sea Rift, on to a transitional deformation zone in the Chersky Range in Siberia, then the Ulakhan Fault between the North American Plate and the Okhotsk Plate, and then continues as the Aleutian Trench to the end of the Queen Charlotte Fault system.
The situation in October 2013
High methane readings were recorded for a period of just over one day, October 19 - 20, 2013, as shown in the images below. Indicated in yellow are all methane readings of 1950 ppb and over.
To pointpoint more closely where methane is venting along the Laptev Sea Rift, the image below gives readings for October 20, 2013, pm, at just three altitudes (607 - 650 mb).
Satellite measurements recorded methane readings of up to 2411 ppb on October 20, 2013.
Methane venting in the Laptev Sea in 2005 and 2007
For further reference, large amounts of methane have been venting in the Laptev Sea area in previous years. Added below is an edited part of a previous post, Unfolding Climate Catastrophe.
In September 2005, extremely high concentrations of methane (over 8000 ppb, see image on the right) were measured in the atmospheric layer above the sea surface of the East Siberian Shelf, along with anomalously high concentrations of dissolved methane in the water column (up to 560 nM, or 12000% of super saturation).
The authors conclude: "Since the area of geological disjunctives (fault zones, tectonically and seismically active areas) within the Siberian Arctic shelf composes not less than 1-2% of the total area and area of open taliks (area of melt through permafrost), acting as a pathway for methane escape within the Siberian Arctic shelf reaches up to 5-10% of the total area, we consider release of up to 50 Gt of predicted amount of hydrate storage as highly possible for abrupt release at any time".
In 2007, concentrations of dissolved methane in the water column reached a level of over 5141 nM at a location in the Laptev Sea. For more background, see the previous post, Unfolding Climate Catastrophe.
Methane levels in October 2015
The image below shows high methane concentrations over the Arctic Ocean on October 11, 2015, pm, at 840 mb, i.e. relatively close to sea level.
The image below shows high levels of methane over the Arctic Ocean at higher altitude (469 mb) on October 28, 2015, pm, when methane levels were as high as 2345 ppb.
Note that the above two images have different scales. The data are from different satellites. The video below shows images from the MetOp-2 satellite, October 31, 2015, p.m., at altitudes from 3,483 to 34,759 ft or about 1 to 11 km (241 - 892 mb).
Peak methane levels were as high as 2450 ppb on November 1, 2015.
Update: Warm Water in Arctic Ocean
On November 5, 2015, sea surface temperatures as high as 8.5°C or 47.3°F showed up in the Bering Strait, an anomaly of 6.6°C or 11.9°F, while sea surface temperatures as high as 14.4°C or 57.9°F showed up near Svalbard on November 5, 2015, a 12.2°C or 22°F anomaly. The situation is illustrated by the image below.
[ click on image to enlarge ]
These high temperatures indicate that the sea can be a lot warmer below the surface than at the surface, and it appears that very warm waters are continuing to enter the Arctic Ocean from both the Pacific Ocean and the Atlantic Ocean. As discussed in previous posts such as this one, the danger is that ever warmer waters will (further) destabilize methane hydrates at the seafloor of the Arctic Ocean, resulting in abrupt methane eruptions that could dwarf the impact of existing greenhouse gases in the atmosphere.
Climate Plan
The situation is dire and calls for comprehensive and effective action, as discussed at the Climate Plan.
In October 2015, an area appeared in the Arctic sea ice where the temperature of the ice was a few degrees Celsius...
Posted by Sam Carana on Friday, October 30, 2015
Arctic sea ice extent has been growing rapidly recently. The image below shows extent up to October 9, 2015 (marked by red dot).
Below is a comparison of sea ice thickness as on October 6, for the years (from left to right) 2012, 2013, 2014 and 2015. The comparison shows that decline has been strongest where sea ice used to be the thickest, i.e. over 3 meters thick.
One of the reasons why the thickest Arctic sea ice has declined so dramatically over the years is the rising ocean heat that is melting the sea ice from underneath. The image below illustrates the situation on October 5, 2015, when sea surface temperature anomalies were as high as 6.4°C, 7.4°C and 7.3°C (11.5°F 13.2°F and 13.1°F) off the North American coast, and as high as 9.4°C (16.8°F) near Svalbard.
Water temperatures are very high in the Arctic, as further illustrated by the image below showing Arctic sea surface temperature anomalies as at October 9, 2015.
Rising ocean heat is further illustrated by the graph below, showing August sea surface temperature anomalies on the Northern Hemisphere over the years.
The situation is very dangerous, due to feedbacks and their interaction. The thicker sea ice used to act as a buffer, consuming ocean heat in the melting process. Without thicker sea ice, ocean heat threatens to melt the sea ice from below right up to the surface, causing the entire sea ice to collapse. As the sea ice declines, more open water will give rise to stronger winds and waves.
Furthermore, sunlight that was previously reflected back into space will instead be absorbed by the water, causing rapid rise of the temperature of the water. In places such as the East Siberian Arctic Shelf, the water is on a average only 50 m deep, so warmer water is able to reach the seafloor more easily there. As ocean heat keeps rising, there's a growing risk that heat will reach the Arctic Ocean seafloor and destabilize methane hydrates in sediments at the Arctic Ocean seafloor.
The image below shows a non-linear trend that is contained in the temperature data that NASA has gathered over the years, as described in an earlier post. A polynomial trendline points at global temperature anomalies of over 4°C by 2060. Even worse, a polynomial trend for the Arctic shows temperature anomalies of over 4°C by 2020, 6°C by 2030 and 15°C by 2050, threatening to cause major feedbacks to kick in, including albedo changes and methane releases that will trigger runaway global warming that looks set to eventually catch up with accelerated warming in the Arctic and result in global temperature anomalies of 16°C by 2052.
[ click on image to enlarge ]
The situation is dire and calls for comprehensive and effective action, as discussed at the Climate Plan.
Comparison of sea ice thickness on October 6, for the years (from left to right) 2012, 2013, 2014 and 2015, shows that...
It looks like sea ice has passed its minimum extent for the year 2015, as illustrated by the image below.
There are some differences between the various websites measuring extent, such as to whether the 2015 low was the third or fourth lowest. Japanese measurements show that sea ice extent was 4.26 million square km on September 14, 2015, i.e. lower than the 2011 minimum of 4.27 million square km, as illustrated by the image below.
Meanwhile, the Polar Science Center at the University of Washington has announced that Arctic sea ice volume minimum was reached on September 12, 2015, with a total volume of 5,670 cubic km. The image below shows a polynomial trendline based on their annual Arctic sea ice volume minima, including this volume for 2015.
Importantly, the sea ice in many places is now less thick than it was in 2012, as illustrated by the image below, showing sea ice thickness on September 27, 2012 (panel left) and a forecast for September 27, 2015 (panel right).
The reason for the dramatic decrease in thickness of the multi-year sea ice is ocean heat, as illustrated by the image below, showing sea surface temperature anomalies in the Arctic as at September 21, 2015.
The water of the Arctic Ocean is very warm, not only at the surface, but even more so underneath the surface. What has contributed to this situation is described by the image below. From 2012, huge amounts of fresh water have run off Greenland, with the accumulated fresh water now covering a huge part of the North Atlantic.
Since it's fresh water that is now covering a large part of the surface of the North Atlantic, it will not easily sink in the very salty water that was already there. The water in the North Atlantic was very salty due to the high evaporation, which was in turn due to high temperatures and strong winds and currents. As said, fresh water tends to stay on top of more salty water, even though the temperature of the fresh water is low, which makes this water more dense. The result of this stratification is less evaporation in the North Atlantic, and less transfer of ocean heat to the atmosphere, and thus lower air temperatures than would have been the case without this colder surface water.
Meanwhile, global warming continues to heat up the oceans, while less of this ocean heat can now be transferred from the water to the atmosphere in the North Atlantic, since the fresh water is acting like a lid.
The danger is thus that warmer water will be pushed into the Arctic Ocean at lower depth, and that it will reach the seafloor of the Arctic Ocean where huge amounts of methane are contained in sediments. Ice acts like a glue, holding these sediments together and preventing destabilization of methane hydrates. Warmer water reaching these sediments can penetrate them by traveling down cracks and fractures in the sediments, and reach the hydrates.
The big melt in Greenland and the Arctic in general is causing further problems. Isostatic adjustment following melting can contribute to seismic events such as earthquakes, shockwaves and landslides that can destabilize methane hydrates contained in sediments on the Arctic Ocean seafloor.
In the video below, by Nick Breeze, Professor Peter Wadhams discusses the situation.
The situation is dire and calls for comprehensive and effective action as discussed at the Climate Plan.
The water of the Arctic Ocean is very warm, not only at the surface, but even more so underneath the surface. What has...
Posted by Sam Carana on Tuesday, September 22, 2015
Huge amounts of carbon are contained in sediments, soils and vegetation in the Arctic. Rising temperatures in the Arctic threaten to cause much of this carbon to be released to the atmosphere.
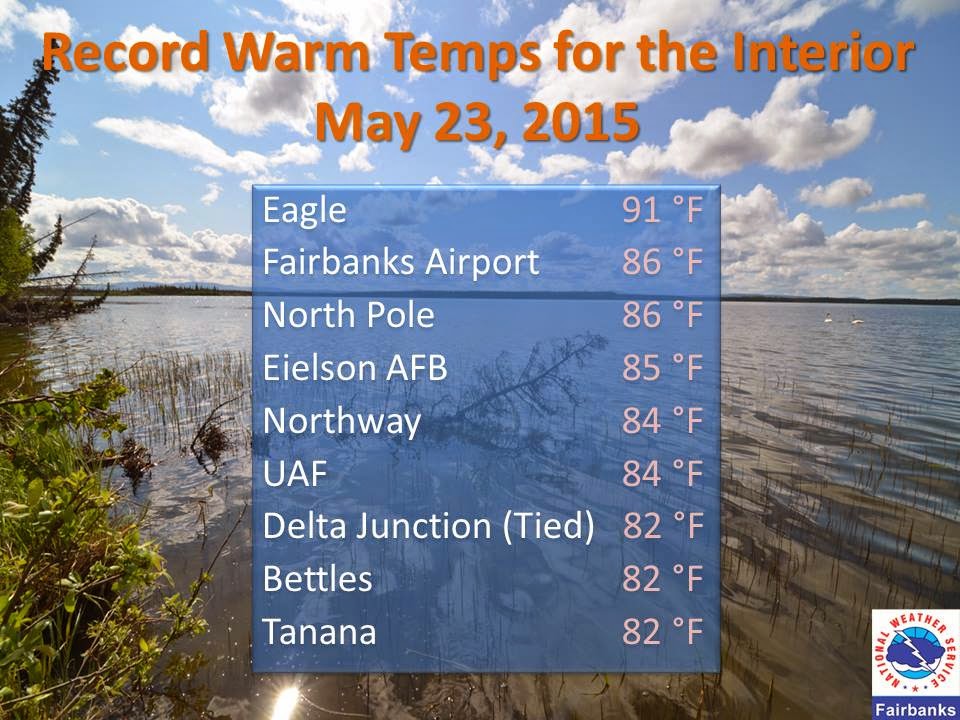
On May 23, 2015, temperatures in Alaska were as high as 91°F (32.78°C), as illustrated by the image below.
High temperatures were reached at the city of Eagle, located on the southern bank of the Yukon River, at an elevation of 853 ft (260 m). High temperatures at such a location will cause meltwater, aggravating the situation well beyond the local area.
A bank of permafrost thaws near the Kolyma
River in Siberia. Credit: University of Georgia
Carbon contained in soils will thus become increasingly exposed under the combined impact of rising temperatures and the associated growing amounts of meltwater. The meltwater can additionally cause erosion further downstream, thus making carbon at many locations become more prone to be consumed by microbes and released into the atmosphere in the form of carbon dioxide and methane.
Gary Houser, who recently launched the movie Sleeping Giant in the Arctic, elaborates on the threat of emissions from thawing permafrost:
This immense release would likely feed on itself, raising temperatures that continue melting more and more permafrost in a vicious, frightening, and unstoppable cycle. A tipping point could well be crossed, at which time human intervention is no longer possible. Temperatures across the planet could soar, setting in motion catastrophic levels of drought and food shortage. All life support systems on earth and life forms themselves could be placed under severe stress.
The colossal scale of the danger - and the observation of those factors lining up that could trigger it - demand that humanity exercise the precautionary principle. All political decision-making related to carbon emissions must be based on the understanding that a catastrophic consequence is looming, and the window of time for prevention quickly diminishing.
SLEEPING GIANT IN THE ARCTIC:
Can Thawing Permafrost Cause Runaway Global Heating?
A heatwave with temperature anomalies exceeding 36°F (20°C) is expected to hit Greenland between August 16 and 22, 2014, as illustrated by the image on the left and the animation on the right.
Such heatwaves can be expected to hit the Arctic more frequently and with greater intensity, as temperatures in the Arctic are rising faster than elsewhere on Earth.
Such heatwaves can result in massive melting on Greenland, as persistent heat changes the texture of the snow and ice cover, in turn reducing its reflectivity. This makes that less sunlight is reflected back into space and is instead absorbed.
The image below illustrates what a difference the presence of sea ice can make.
As the NSIDC/NOAA graphs below shows, melting on Greenland has been relatively modest this year when compared to the situation in 2012. By July 12, 2012, 97% of the ice sheet surface had thawed, according to this NASA analysis and this NOAA Arctic Report Card.
Melting on Greenland directly affects sea level rise, and melting on Greenland is accelerating due to a number of factors.
Projections of melting on Greenland have long been based on a warming atmosphere only, ignoring the warmer waters that lubricate glaciers and that warm Greenland's bedrock canyons that sit well below sea level.
Furthermore, there are growing quantities of black carbon deposits as a result of burning of fossil fuel and biomass. High temperatures have recently caused ferocious wildfires in Canada that have in turn caused a lot of black carbon to go up high into the atmosphere.
And of course, the atmosphere over the Arctic is warming up much faster than most models had projected. This in turn causes triggers further feebacks, including more extreme weather events such as heatwaves and rain storms that can be expected to hit Greenland with ever more frequency and ferocity. Further feedbacks include methane eruptions from the heights of Greenland, as discussed at the Arctic Feedbacks Page.
When also taking into account the accelerating impact of such factors on melting in Greenland, sea levels could rise much faster than anticipated, as illustrated by the image below.
Note that sea level rise is only one of the many dangers of global warming, as discussed in the 2007 post Ten Dangers of Global Warming.
The image on the right shows a temperature forecast for August 16, 2014, with parts of Greenland changing in color from blue into green, i.e. above the melting point for snow and ice.
Such high temperatures are now hitting locations close to the North Pole ever more frequently, due to the many feedbacks that are accelerating warming in the Arctic, as discussed at this Feedbacks page.
One of the most dangerous feedbacks is a sudden eruption of huge quantities of methane from the seafloor of the Arctic Ocean, as discussed in a recent post.
The impact of such feedbacks can be accumulative and interactive, resulting in self-reinforcing feedbacks loops that can escalate into runaway warming.
Below is another forecast by ClimateReanalyzer for August 16, 2014, showing the remarkable ‘greening’ of Greenland, as well as the very high temperatures reaching the higher latitudes of North America.
Also see the very high sea surface temperatures around Greenland on the image below, created with ClimateReanalyzer.
Sea surface temperature anomalies on August 15, 2014.
In conclusion, the situation is dire and calls for comprehensive and effective action, as discussed at the Climate Plan blog.
A warming period more than 400,000 years ago pushed the Greenland ice sheet past its stability threshold (which may have been no more than several degrees above pre-industrial temperatures). This resulted in a nearly complete deglaciation of southern Greenland, raising global sea levels some 4.5-6 meters, found a recent study by Reyes et al. Due to melting elsewhere, global mean sea level then was 6 to 13 metres above the present level. Indeed, melting of the entire West Antarctic Ice Sheet can add a further 6-meter rise in sea levels. If the East Antarctic Ice Sheet (EAIS) were to melt as well, sea levels would rise by around 70 metres.
Sea level is now rising by 3.1mm (0.122 inch) per year. Much of this rise is due to rising temperatures, but there are also other factors. One quarter of the rise results from groundwater depletion, while run off from melting ice and glaciers adds another quarter and the remainder is attributed to thermal expansion of sea water. Furthermore, as temperatures rise, feedbacks start to kick in, e.g. the kinetic energy from stronger waves and more intense storms can speed things up.
Clearly, a rapid multi-meter rise would be devastating as it would flood many coastal cities, as well as much of the land now used to grow food. By how much have sea levels been rising recently and how fast can they be expected to rise in the near future?
NASA image, data by the JPL PODAAC, in support of the NASA's MEaSUREs program.
Sea levels have risen by some 60 mm over the past 20 years, as above NASA image shows, which has a linear trendline added. The question is whether a linear trendline is the most appropriate trendline, given that it suggests that a similar rise could be expected over the next 20 years. A polynomial trendline appears to fit the data better, as the animation below shows.
Such a polynomial trendline, however, points at a similar rise (of some 50 mm) in just four years time, with an even more steeper rise to follow, as illustrated by the image below.
And indeed, such a rise doesn't slow down there. A polynomial trendline applied to the data points at a sea level rise of more than 2.5 m (8.2 ft) by the year 2040.
The image below gives an idea of what a sea level rise of six feet (1.829 m) would do to the City of New York. Of course, this is only the sea level rise. Storm surge would come on top of this, as discussed at Ten Dangers of Global Warming.
So, what would be more appropriate, to expect sea levels to continue to rise in a linear way, or to take into account feedbacks that could speed things up? Where such feedbacks could lead to is illustrated by the image below.


 Jet stream is wavy and strong, showing speeds as high as 219 mph or 352 km/h (at location marked by the green circle). Right panel shows cyclonic winds between Norway and Greenland speeding up movement of sea ice into the North Atlantic.


