Showing posts with label heat. Show all posts

Wednesday, February 8, 2017

Warning of mass extinction of species, including humans, within one decade


[ click on images to enlarge ]
On February 10, 2017, 18:00 UTC it is forecast to be 0.1°C or 32.1°F at the North Pole, i.e. above the temperature at which water freezes. The temperature at the North Pole is forecast to be 30°C or 54°F warmer than 1979-2000, on Feb 10, 2017, 18:00 UTC, as shown on the Climate Reanalyzer image on the right.

This high temperature is expected as a result of strong winds blowing warm air from the North Atlantic into the Arctic.

The forecast below, run on February 4, 2017, shows that winds as fast as 157 km/h or 98 mph were expected to hit the North Atlantic on February 6, 2017, 06:00 UTC, producing waves as high as 16.34 m or 53.6 ft.


A later forecast shows waves as high as 17.18 m or 54.6 ft, as illustrated by the image below.


While the actual wave height and wind speed may not turn out to be as extreme as such forecasts, the images do illustrate the horrific amounts of energy contained in these storms.

Stronger storms go hand in hand with warmer oceans. The image below shows that on February 4, 2017, at a spot off the coast of Japan marked by green circle, the ocean was 19.1°C or 34.4°F warmer than 1981-2011.


As discussed in an earlier post, the decreasing difference in temperature between the Equator and the North Pole causes changes to the jet stream, in turn causing warmer air and warmer water to get pushed from the North Atlantic into the Arctic.

The image below shows that on February 9, 2017, the water at a spot near Svalbard (marked by the green circle) was 13°C or 55.3°F, i.e. 12.1°C or 21.7°F warmer than 1981-2011.

[ click on images to enlarge ]
Warmer water flowing into the Arctic Ocean in turn increases the strength of feedbacks that are accelerating warming in the Arctic. One of these feedbacks is methane that is getting released from the seafloor of the Arctic Ocean. Update: The image below shows that methane levels on February 13, 2017, pm, were as high as 2727 ppb, 1½ times the global mean at the time.

[ click on image to enlarge, right image added for reference to show location of continents ] 
What caused such a high level? High methane levels (magenta color) over Baffin Bay are an indication of a lot of methane getting released north of Greenland and subsequently getting pushed along the exit current through Nares Strait (see map below). This analysis is supported by the images below, showing high methane levels north of Greenland on the morning of February the 14th (left) and the 15th (right).


The image below shows methane levels as high as 2569 ppb on February 17, 2017. This is an indication of ocean heat further destabilizing permafrost at the seafloor of the Laptev Sea, resulting in high methane concentrations where it is rising in plumes over the Laptev Sea (at 87 mb, left panel) and is spreading over a larger area (at slightly lower concentrations) at higher altitude (74 mb, right panel).


This illustrates how increased inflow of warm water from the North Atlantic into the Arctic Ocean can cause methane to erupt from the seafloor of the Arctic Ocean. Methane releases from the seafloor of the Arctic Ocean have the potential to rapidly and strongly accelerate warming in the Arctic and speed up further feedbacks, raising global temperature with catastrophic consequences in a matter of years. Altogether, these feedbacks and further warming elements could trigger a huge abrupt rise in global temperature making that extinction of many species, including humans, could be less than one decade away.

Youtube video by RT America

Without action, we are facing extinction at unprecedented scale. In many respects, we are already in the sixth mass extinction of Earth's history. Up to 96% of all marine species and 70% of terrestrial vertebrate species became extinct when temperatures rose by 8°C (14°F) during the Permian-Triassic extinction, or the Great Dying, 252 million years ago.

During the Palaeocene–Eocene Thermal Maximum (PETM), which occurred 55 million years ago, global temperatures rose as rapidly as by 5°C in ~13 years, according to a study by Wright et al. A recent study by researchers led by Zebee concludes that the present anthropogenic carbon release rate is unprecedented during the past 66 million years. Back in history, the highest carbon release rates of the past 66 million years occurred during the PETM. Yet, the maximum sustained PETM carbon release rate was less than 1.1 Pg C per year, the study by Zebee et al. found. By contrast, a recent annual carbon release rate from anthropogenic sources was ~10 Pg C (2014). The study by Zebee et al. therefore concludes that future ecosystem disruptions are likely to exceed the - by comparison - relatively limited extinctions observed at the PETM.

An earlier study by researchers led by De Vos had already concluded that current extinction rates are 1,000 times higher than natural background rates of extinction and future rates are likely to be 10,000 times higher.

from the post 2016 well above 1.5°C
As above image shows, a number of warming elements adds up to a potential warming of 10°C (18°F) from pre-industrial by the year 2026, i.e. within about nine years from now, as discussed in more detail at the extinction page.


Above image shows how a 10°C (18°F) temperature rise from preindustrial could be completed within a decade.

https://sites.google.com/
site/samcarana/climateplan
The situation is dire and calls for comprehensive and effective action, as discussed in the Climate Plan.


Links

• Climate Plan
http://arctic-news.blogspot.com/p/climateplan.html

• Arctic Ocean Feedbacks
http://arctic-news.blogspot.com/2017/01/arctic-ocean-feedbacks.html

• Extinction
http://arctic-news.blogspot.com/p/extinction.html

• How much warming have humans caused?
http://arctic-news.blogspot.com/2016/05/how-much-warming-have-humans-caused.html

• Estimating the normal background rate of species extinction, De Vos et al. (2015)
https://www.ncbi.nlm.nih.gov/pubmed/25159086

• Anthropogenic carbon release rate unprecedented during the past 66 million years, by Zebee et al. (2016)
http://www.nature.com/ngeo/journal/v9/n4/full/ngeo2681.html

• Evidence for a rapid release of carbon at the Paleocene-Eocene thermal maximum, Wright et al. (2013)
http://www.pnas.org/content/110/40/15908.full?sid=58b79a3f-8a05-485b-8051-481809c87076

• RT America Youtube video
https://www.youtube.com/watch?v=OSnrDRU6_2g

• RT America Facebook video
https://www.facebook.com/RTAmerica/videos/10154168391051366


Sunday, August 7, 2016

Arctic Sea Ice Getting Terribly Thin

Temperature Rise

A temperature rise (from preindustrial levels) of more than 10°C (18°F) could eventuate by the year 2026, as illustrated by the image below and as discussed in an earlier post.


The high temperature anomaly that occurred in February 2016 was partly caused by El Niño. Nonetheless, there is a threat that the February 2016 anomaly was not a peak, but instead was part of a trend that points at what is yet to come.

Ocean Heat

As the image below shows, 93.4% of global warming goes into oceans. Accordingly, ocean heat has been rising rapidly and, as the image below shows, a trend points at a huge rise over the coming decade.


Ocean temperature rise affects the climate in multiple ways. A recent study confirmed earlier fears that future increases in ocean temperature will result in reduced storage of carbon dioxide by oceans.

Arctic Sea Ice Thickness & Volume

[ click on images to enlarge]
Importantly, ocean temperature rises will also cause Arctic sea ice to shrink, resulting in albedo changes that will make that less sunlight gets reflected back into space, and more sunlight instead gets absorbed by the Arctic Ocean.

Arctic sea ice is losing thickness rapidly. The image on the right shows that the thicker sea ice is now almost gone (image shows sea ice on August 6, 2016, nowcast). The image below gives a comparison of the years 2012, 2013, 2014 and 2015 for August 6.


The situation looks even more threatening when looking at the Naval Research Laboratory image below, produc ed with a new model and run on August 3, 2016, valid for August 4, 2016.


The image below, by Jim Pettit, shows Arctic sea ice volume.

animated version of this graph
Sea Surface Temperatures

The extra heat entering the oceans translates in a huge temperature rise at the sea surface, as illustrated by the image below, from an earlier post and using sea surface temperature anomalies on the Northern Hemisphere up to November 2015.


[ click on images to enlarge ]
The Arctic Ocean is feeling the heat carried in by the Gulf Stream. The image on the right shows sea surface temperature anomalies from 1971-2000.

Note that the anomalies are reaching the top of the scale, so in some areas they will be above that top end (i.e. 4°C or 7.2°F) of the scale.

Sea surface temperatures off the coast of North America are very high, with sea surface temperatures as high as 33.1°C, as the image below shows. Much of the heat accumulating in the Gulf will be carried by the Gulf Stream to the Arctic Ocean over the coming months.

The image on the right shows Arctic sea surface temperature anomalies on August 7, 2016, as compared to 1961-1990. Note the black areas where sea surface temperature anomalies are above 8°C.

Sea surface temperatures in the Arctic Ocean will remain around freezing point, where and for as long as there still is sea ice present. Once the sea ice is gone, though, sea surface temperature in that area will rise rapidly.

The image below shows how profound sea surface temperature anomalies are at higher latitudes of the Northern Hemisphere.


While sea surface temperatures can be huge locally, even warmer water may be carried underneath the sea surface from the Atlantic Ocean into the Arctic Ocean, due to the cold freshwater lid on the North Atlantic, as illustrated by the image below, from an earlier post.

feedback #28 at the feedback page
Sea surface temperature was as high as 18.1°C or 64.6°F close to Svalbard (green circle) on August 6, 2016, 13.1°C or 23.6°F warmer than in 1981-2011, which gives an idea how high the temperature anomaly of the ocean may be just underneath the sea surface.


Surface Temperature

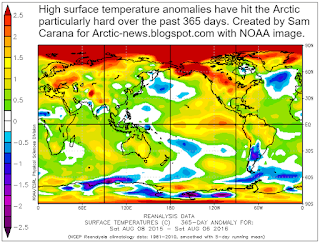
As the image on the right shows, high surface temperature anomalies have hit the Arctic particularly hard over the past 365 days.

Apart from melting the sea ice from above, high temperatures over land will also warm up the water of rivers that end in the Arctic Ocean.

Warm water from rivers will thus contribute (along with wamer water brought into the Arctic Ocean from the Atlantic and Pacific Oceans) to melting of the Arctic sea ice from below.

Methane

There's a danger that, as the temperature of the Arctic Ocean keeps rising, huge amounts of methane will enter the atmosphere due to destabilization of hydrates at its seafloor.

The situation is dire and calls for comprehensive and effective action as described in the Climate Plan.


Links

 A Global Temperature Rise Of More than Ten Degrees Celsius By 2026?
http://arctic-news.blogspot.com/2016/07/a-global-temperature-rise-of-more-than-ten-degrees-celsius-by-2026.html

 Ocean Heat
http://arctic-news.blogspot.com/2015/11/ocean-heat.html

 Implications for Earth’s Heat Balance, IPSS 2007
http://www.ipcc.ch/publications_and_data/ar4/wg1/en/ch5s5-2-2-3.html

 World Ocean Heat Content and Thermosteric Sea Level change (0-2000 m), 1955-2010, by Levitus et al.
http://onlinelibrary.wiley.com/doi/10.1029/2012GL051106/abstract

 Attenuation of sinking particulate organic carbon flux through the mesopelagic ocean, by Marsay et al.
http://www.pnas.org/content/112/4/1089


Friday, June 17, 2016

Ocean Heat Overwhelming North Atlantic

Arctic sea ice extent on June 19, 2016, was at a record low for the time of the year, as the (updated) image below shows.

[ image from JAXA ]
Not only is Arctic sea ice extent at record low for time of year, the sea ice is also rapidly getting thinner, more fractured, lower in concentration and darker in color. 

[ Cracks in sea ice north of Greenland on June 19, 2016, created with Arctic-io image ]
On the morning of June 20, 2016, strong methane releases were recorded over the water north of Greenland, as well as east of Greenland, as illustrated by the image below.

The image below shows that on the morning of June 20, 2016, mean global methane levels had increased be several parts per billion over a large altitude range, compared to the two previous days. Methane levels at selected altitudes on days in July 2015 and December 2015 are added for reference.
[ click on images to enlarge ]
Temperatures in the Arctic are rising, as illustrated by the image below, showing that on June 19, 2016, temperatures were as high as 31.4°C or 88.4°F over the Mackenzie River (green circle) which ends in
the Arctic Ocean (and thus warms up the Arctic Ocean there).


On June 20, 2016, the Sun will reach its highest point (Solstice), and the Arctic will have 24 hours sunlight, i.e. on the Arctic Circle (latitude 66.56° north) or higher. The Arctic is about 20,000,000 square km (7,700,000 square miles) in size and covers roughly 4% of Earth's surface. Insolation during the months June and July is higher in the Arctic than anywhere else on Earth, as illustrated by the image below, by Pidwirny (2006).


Sea surface temperature near Svalbard was as high as 55°F (or 12.8°C, at the green circle) on June 14, 2016, an anomaly of 19.6 °F (or 10.9°C) from 1981-2011, as illustrated by the image below.


[ click on images to enlarge ]
Above image, created with nullschool.net, further shows that the cold lid that had been growing so prominently in extent over the North Atlantic over the past few years, has shrunk substantially. By comparison, the cold area over the North Pacific has grown larger. This is further confirmed by the image on the right, created with NASA maps and showing ocean temperature anomalies for May 2016.

Plenty of meltwater has run off from Greenland in 2016, as illustrated by the NSIDC.gov image on the right. The run-off from Alaska and Siberia into the Pacific seems less by comparison than the run-off into the North Atlantic. So, how could it be that the cold area in the North Pacific has grown larger than the cold area in the North Atlantic?
[ click on images to enlarge ]

Could there be another factor influencing the size of these cold areas in the North Atlantic and the North Pacific?

The image below, created with NOAA images, gives a comparison between the situation on June 1, 2015 (top), and June 1, 2016 (bottom), showing anomalies from 1961-1990.


Sunday, May 1, 2016

2016 Heat Felt Around Globe

created by Sam Carana with JAXA image
Above image shows that 2016 Arctic sea ice extent has been very low, if not at record low, up to April 30, 2016. This situation doesn't appear likely to improve, due to high ocean heat causing melting from below and high air temperatures that cause melting from above and that also cause water to warm up in rivers ending up in the Arctic Ocean.

The image below shows that on April 28, 2016, sea surface off the coast of North America was as much as 12.3°C or 22.1°F warmer than in 1981-2011. The Gulf Stream will make that much of this heat will arrive in the Arctic Ocean over the next few months.


The image below compares April 30 sea surface temperature anomalies between 2015 (left panel) and 2016 (right panel), showing that the sea surface in many areas is warmer in 2016 than it was in 2015.


Next to sea surface temperatures, air temperatures are rising, as illustrated by the image on the right, showing temperatures over Alaska as high as 14.6°C or 58.4°F at 64.5°N and as high as 10.8°C or 51.4°F at 66.5°N on May 1, 2016. Such rising temperatures over land will warm up rivers that will in turn warm up the Arctic Ocean.

The Google reference map below shows a large part of the Arctic Ocean, including Alaska on the left and the Beaufort Sea at the bottom. The map has an added red square inset that indicates the outlines of the map further below, which zooms in further on the Beaufort Sea.


The April 26, 2016, NASA map below shows that, while it is in places still relatively thick, the sea ice in the Beaufort Sea is strongly fractured with much water showing up in the fractures, and even more water along the coast.


Worryingly, high methane peaks have been recorded recently, as high as 2810 ppb on April 29, 2016, as illustrated by the image below, showing a large area with high methane levels east of Greenland.


Meanwhile, the heatwave in South-East Asia continues, with temperatures as high as 49°C or 120.1°F recorded on April 27, 2016, as illustrated by the image on the right.

As the image below shows, temperatures do not appear to be coming down, with temperatures as high as 49.4°C or 120.8°F forecast to hit India on May 2, 2016 (at the location marked by the green circle).

As global warming continues, this will make humidity levels rise. A 3°C warming will cause about 25% increase in absolute humidity, which will make it feel at least 6°C hotter. Moreover, water vapor is a potent greenhouse gas, further accelerating global warming.


The situation is dire and calls for comprehensive and effective action, as described at the Climate Plan.


Tuesday, February 23, 2016

Arctic Winter Heatwave

The Arctic is experiencing a heatwave in winter, with temperature anomalies on February 23, 2016, averaging 7.84°C or 14.11°F higher than what was common 1979-2000.


The forecast for 6:00 UTC on February 23, 2016, shows an anomaly of 8.17°C or 14.71°F.


Temperatures in January 2016 over the Arctic Ocean were 7.3°C (13.1°F) higher than in 1951-1980, according to NASA data, as illustrated by the graph on the right, from an earlier post.

These high temperatures go hand in hand with sea ice extent that is much lower for this time of year than since records started.

As discussed in an earlier post, low sea ice extent is fueling fears that this year's maximum extent was already reached on February 9, 2016.

A much higher ocean temperature is behind both the low sea ice extent and the high temperature anomalies.

Ocean temperatures are particularly high where the Gulf Stream pushes water from Atlantic Ocean into the Arctic Ocean, as illustrated by the image below that compares sea surface temperature anomalies in the Arctic between the years 2015 and 2016 for February 22nd.


This spells bad news for the sea ice in 2016, since El Niño is still going strong and ocean temperature keeps rising, as illustrated by the NOAA global ocean temperature anomalies graph for January below.

 The situation is dire and calls for comprehensive and effective action, as described in the Climate Plan.


ARCTIC WINTER HEATWAVE The Arctic is experiencing a heatwave in winter, with temperature anomalies on February 23,...
Posted by Sam Carana on Tuesday, February 23, 2016