Showing posts with label anomaly. Show all posts

Monday, November 9, 2015

Ocean Heat

Sea Surface Temperatures

Sea surface temperatures were as high as 15.8°C or 60.4°F near Svalbard on November 7, 2015, a 13.7°C or 24.7°F anomaly. Let this sink in for a moment. The water used to be close to freezing point near Svalbard around this time of year, and the water now is warmer by as much as 13.7°C or 24.7°F.

[ click on image to enlarge ]
Above image further shows that sea surface temperature anomalies as high as 6.7°C or 12.1°F were recorded on November 7, 2015, off the coast of North America, while anomalies as high as 6°C or 10.9°F were recorded in the Bering Strait.

NOAA analysis shows that the global sea surface in September 2015 was the warmest on record, at 0.81°C (1.46°F) above the 20th century average of 16.2°C (61.1°F). On the Northern Hemisphere, the anomaly was 1.07°C (1.93°F).

[ click on image to enlarge ]

How did temperatures get so high near Svalbard? The answer is that ocean currents are moving warm water from the Atlantic Ocean into the Arctic Ocean. The ocean is warmer underneath the sea surface and at that location near Svalbard warm water from below the surface emerges at the surface.

Ocean Heat

The oceans are warming up rapidly, especially the waters below the sea surface. Of all the excess heat resulting from people's emissions, 93.4% goes into oceans. Accordingly, the temperature of oceans has risen substantially over the years and - without action - the situation only looks set to get worse.

NOAA's ocean heat content figures for 0-2000 m are very worrying, as illustrated by the image below.


The image below was created with data for January through to March, while adding non-linear trendlines for ocean heat at depths of 0-700 m and 0-2000 m. For growth of ocean heat content for 0-700 m, a polynomial trend is added, while for growth of ocean heat content for 0-2000 m an exponential trend is added.

[ click on images to enlarge ]
The image below shows a polynomial trend based on all available quarterly data for ocean heat content from 0 to 2000 m. The trendline shows even faster growth.


The danger is that, as ocean heat continues to grow, ocean currents will keep carrying ever warmer water from the Atlantic and Pacific Oceans into the Arctic Ocean.

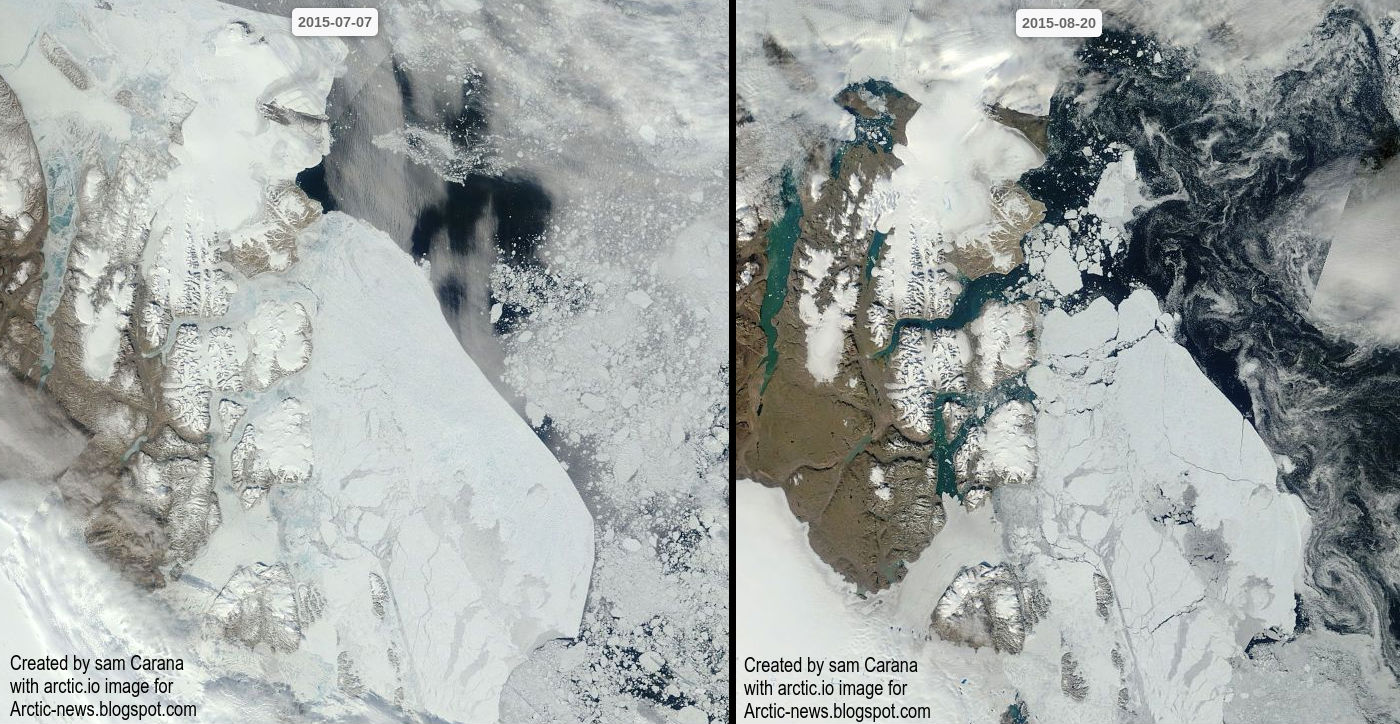
Merely watching temperatures at the surface of the ocean may underestimate the warming that is taking place below the sea surface. At the sea surface, evaporation takes place that cools the water. Furthermore, melting of sea ice and glaciers will make that a layer of cold freshwater spreads at the surface, preventing much transfer of heat from the ocean to the atmosphere, as discussed at this earlier post. The blue-colored areas on the Northern Hemisphere on the top image are partly the result of this meltwater. There is another reason why these areas are relatively cool, i.e. sulfates, as further discussed in the section below.

Aerosols

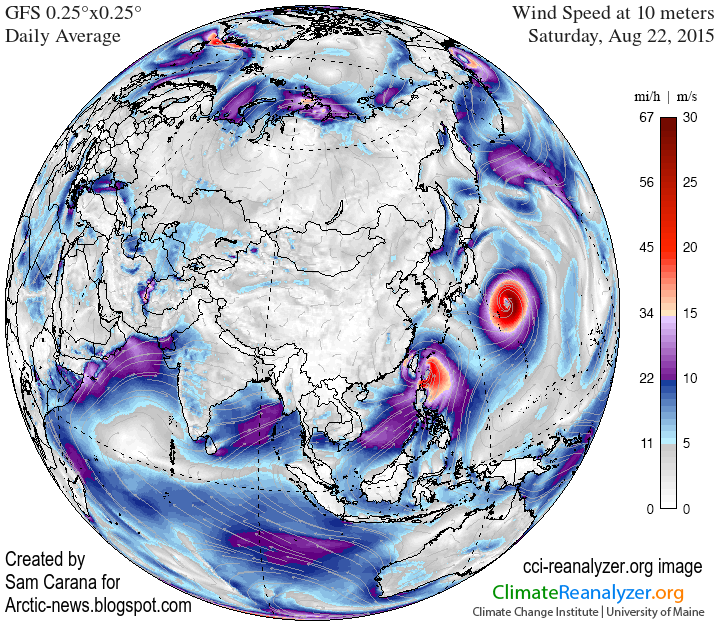
Particulates, in particular sulfate, can provide short-term cooling of the sea surface. Large amounts of sulfate are emitted from industrial areas in the east of North America and in East Asia. On the Northern Hemisphere, the Coriolis effect makes that such emissions will typically reach areas over the nearby ocean to the east of such industrial areas, resulting in the sea surface there being cooled substantially, until the particulates have fallen out of the sky. Since the sulfate is emitted on an ongoing basis, the cooling effect continues without much interruption.

[ click on image to enlarge ]
This sulfate has a cooling effect on areas of the sea surface where ocean currents are moving warm water toward the Arctic Ocean. Because the sea surface gets colder, there is less evaporation, and thus less heat transfer from the ocean to the atmosphere during the time it takes for the water to reach the Arctic Ocean. As a result, water below the sea surface remains warmer as it moves toward the Arctic Ocean.


Similarly, as illustrated by above image, sulfur dioxide emitted in industrial areas in North America and East Asia can extend over the oceans, cooling the surface water of currents that are moving water toward the Arctic Ocean.

Methane

The image below shows that atmospheric methane levels in 2014 were 1833 parts per billion (WMO data) or 254% the pre-industrial level. WMO data are for 1984-2014 and are marked in red, while IPCC data (AR5) are for the years 1755-2011 and are marked in blue.


The image below shows the rise of methane levels from 1984 created with World Metereological Organization (WMO) data. The square marks a high mean 2015 level, from NOAA's MetOp-2 satellite images, and it is added for comparison, so it does not influence the trendline, yet it does illustrate the direction of rise of methane levels and the threat that global mean methane levels will double well before the year 2040.


The image below illustrates the danger that large amounts of methane will erupt from the Arctic Ocean, particularly in East Siberian Arctic Shelf, where the sea is quite shallow, so much of the methane can reach the atmosphere without being broken down by microbes on the way up through the water column.


The video below shows how methane concentrations start to rise close to sea level, and how concentrations strengthen at higher altitudes, and to eventually get lower at even higher altitudes.


The Threat

Ocean heat threatens to increasingly reach the seafloor of the Arctic Ocean and unleash huge methane eruptions from destabilizing clathrates. Such large methane eruptions will then warm the atmosphere at first in hotspots over the Arctic and eventually around the globe, while also causing huge temperature swings and extreme weather events, contributing to increasing depletion of fresh water and food supply, as further illustrated by the image below, from an earlier post.

[ click on image at original post to enlarge ]

The image below gives an indication of the ocean heat that is pushed by the Gulf Stream toward the Arctic Ocean. Note that this image shows the situation on November 15, 2015. Water off the east coast of North America is even warmer at the peak of the Northern Hemisphere summer and it is this water that is now arriving in the Arctic Ocean.


Below is a radio version of this post, roughly as read by Debba Kale Earnshaw at this episode and the next episode of extinctionradio.org


Malcolm Light comments:
To a geologist-oceanographer, the increasing rate of heat gain in the deep water seems obvious. Massive quantities of heat are generated in the earth's interior by radioactivity and find their way to the surface in rising convection systems to erupt along mid-ocean ridges as basaltic lava flows, pushing the plates apart. Under normal circumstances, prior to the arrival of civilized man, the plates cooled as they expanded by passing their heat into the oceans, which then was radiated into space.

Now, with the fast evolving atmospheric greenhouse Arctic methane global warming veil. the heat is simply being reflected back into the oceans and onto the land. Therefore, just like a pressure cooker, the Earth's interior heat is becoming trapped more and more and of course the end result will be a final blow-out. The more than 400 thousand years of ice core data show that we can expect a massive atmospheric methane peak caused by destabilization of the Arctic subsea methane hydrates very soon (8 to 16 years away) and it will produce a Permian style extinction event with a temperature increase of some 8 to 10 degrees C.


Climate Plan

The situation is dire and calls for comprehensive and effective action, as discussed at the Climate Plan.

Sea surface temperatures were as high as 15.8°C or 60.4°F near Svalbard on November 7, 2015, a 13.7°C or 24.7°F anomaly....
Posted by Sam Carana on Monday, November 9, 2015

Friday, October 23, 2015

September 2015 Sea Surface Warmest On Record

Arctic Sea Ice Extent Growth Seals Off Arctic Ocean


Arctic sea ice increased rapidly in October 2015, after reaching its annual minimum in September. As the image below shows, the growing sea ice extent has effectively sealed off the Arctic Ocean from the atmosphere, resulting in less evaporation and heat transfer from the ocean to the atmosphere.

The Naval Research Laboratory 30-days animation (up to October 22, with forecast added up to October 30) on the right shows that sea ice has grown in extent, adding plenty of very thin sea ice, while the existing ice has hardly increased its thickness.

The Buffer Has Gone

Thick sea ice used to extend meters below the sea surface in the Arctic, where it could consume massive amounts of ocean heat through melting this ice into water. As such, thick sea ice acted as a buffer. Over the years, Arctic sea ice thickness has declined most dramatically. This means that the buffer that used to consume massive amounts of ocean heat carried by sea currents into the Arctic Ocean, has now largely gone.

Latent heat loss, feedback #14 on the Feedbacks page
Cold Freshwater Lid on North Atlantic

Meanwhile, especially from 2012, huge amounts of freshwater have run off Greenland, with the accumulated freshwater now covering a huge part of the North Atlantic, acting as a lid that prevents ocean heat to evaporate from the North Atlantic.


Since it's freshwater that is now covering a large part of the surface of the North Atlantic, it will not easily sink in the very salty water that was already there. The water in the North Atlantic was very salty due to the high evaporation, which was in turn due to high temperatures and strong winds and currents. Freshwater tends to stay on top of more salty water, even though the temperature of the freshwater is low, which makes this water more dense. The result of this stratification is less evaporation in the North Atlantic, and less transfer of ocean heat to the atmosphere, and thus lower air temperatures than would have been the case without this colder surface water.

Cold freshwater lid on North Atlantic, feedback #28 on the Feedbacks page
The cold lid over the North Atlantic has meanwhile expanded. Greenland has been experiencing wild weather swings this month, with temperatures shifting from one extreme end of the scale to the other end. The image below shows temperature anomalies on October 17 (left panel), October 23 (center panel) and a forecast for October 30 (right panel). Temperatures are forecast to swing back to the extreme high end of the scale, pushing up temperature anomalies for the Arctic as a whole to as high as 2.37°C on October 30, 2015.

Wild weather swings causing methane releases, feedback #21 on the Feedbacks page
These wild weather swings over Greenland threaten to cause cracks in the ice, with methane hydrates in the ice becoming destabilized, resulting in releases of huge amounts of methane from hydrates and free gas into the atmosphere, as earlier discussed as feedback #21 on the Feedbacks page.

Strong winds have further contributed to extend the cold lid over the North Atlantic, while also making cold air flow from Greenland over the North Atlantic. This is illustrated by the image below, depicting the situation on October 23, 2015, with the left panel showing surface wind speed, while the right panel shows the resulting sea surface temperature anomalies. 


The video below shows surface wind speed forecasts in the Arctic from October 25 to November 1, 2015.


Ocean Temperature Rise

NOAA analysis shows that the global sea surface in September 2015 was the warmest on record, at 0.81°C (1.46°F) above the 20th century average of 16.2°C (61.1°F). On the Northern Hemisphere, the anomaly was 1.07°C (1.93°F).

[ click on image to enlarge ]
Of all the excess heat resulting from people's emissions, 93.4% goes into oceans. Accordingly, the temperature of oceans has risen substantially over the years and - without action - the situation only looks set to get worse.

The Threat

As ocean temperatures continue to rise, especially in the North Atlantic, the Gulf Stream will keep carrying ever warmer water from the North Atlantic into the Arctic Ocean. Without the buffer of thick sea ice to consume the increasing amount of ocean heat, the threat is that ocean heat will increasingly reach the seafloor and unleash huge methane eruptions from destabilizing clathrates. Such large methane eruptions will then warm the atmosphere at first in hotspots over the Arctic and eventually around the globe, while also causing huge temperature swings and extreme weather events, contributing to increasing depletion of fresh water and food supply, as further illustrated by the image below, from an earlier post.
[ click on image at original post to enlarge ]

October 2015 Sea Surface Temperature Update

The North Atlantic continues to be very warm. Sea surface temperature anomalies were as high as 7.9°C or 14.2°F at a location off the east coast of North America on October 22, 2015. Anomalies were 8.1°C or 14.5°F at that same spot on October 16, 2015.


Sea surface temperature anomalies were as high as 7.5°C or 13.6°F at a location near Svalbard on October 25, 2015. On October 9, 2015, sea surface temperatures were as high as 13.1°C or 55.6°F at that same location near Svalbard (marked by green circle on image below), an anomaly of 9.5°C or 17.2°F. These temperatures indicate that the water can be much warmer below the surface than at the surface, and that this warm water is transported by the Gulf Stream below the surface of the North Atlantic into the Arctic Ocean. The animation below switches between the above two dates and also shows that the cold freshwater lid on the North Atlantic has meanwhile extended further south.


In the Bering Strait, warm water also keeps flowing into the Arctic Ocean. At the location marked by the green circle on the image below, sea surface temperatures were as high as 7.3°C or 45.1°F on October 22, 2015, an anomaly of 5.7°C or 10.2°F.


Methane

The images below show high methane concentrations over the Arctic.


Above image shows methane levels at low altitude on October 22, 2015. Because of its height, there are no data at this altitude for Greenland. The image below shows methane concentrations at a higher altitude, with high methane levels showing up over Greenland on October 16, 2015.


Climate Plan

The situation is dire and calls for comprehensive and effective action, as discussed at the Climate Plan.

Malcolm Light comments

GLOBAL EXTINCTION IS NOW SIX YEARS CLOSER

The following comments refer to Figure 224 below. All historical floating ice appears to have been lost in the Arctic by September 2015 so we can assume that the 5+ year old ice pack has largely gone by this time. The 5+ year old ice pack was only predicted to melt back by 2021.7 consequently this year's volume of ice melting has occurred 6 years earlier than the previous prediction. The previous estimate of the final loss of 1 year Arctic floating ice from polynomial data was 2037.7 which now corrects to 2031.7, 16 years in the future.

Previous estimates of when the average atmospheric global temperature anomaly increase would reach 6°C was 2034.7, by which time massive global extinction would be proceeding. The new corrected time for this event is 2034.7 - 6 = 2028.7 which is 13 years in the future. During the major Permian Extinction event, which was caused by a massive methane build-up in the atmosphere, the mean surface atmospheric temperature increased by 5°C over 13 years. As the present mean global surface atmospheric temperature is already greater than 1°C hotter than the mean, we will be looking at at least a 6°C temperature increase by 2028 with its associated global extinction event. This is a frightening correlation between the new predicted 6°C average global surface atmospheric temperature rise and what is known to have occurred during the major Permian extinction event, both of which were caused by a massive buildup of methane in the atmosphere. We are clearly in for a very rough-hot ride in the next decade as the terminal global extinction event approaches.

Malcolm P.R. Light (Dr)
Earth Scientist
Figure 224. Arctic sea ice melt back times estimated from area, volume and thickness anomalies compared to various extinction zones defined by the global atmosphere temperature field. Credit: Malcolm Light. Click on image to enlarge.

Related

- Ocean Temperature Rise
http://arctic-news.blogspot.com/2014/10/ocean-temperature-rise.html

- Ocean Temperature Rise Continues

- Gulf Stream brings ever warmer water into Arctic Ocean
http://arctic-news.blogspot.com/2015/06/gulf-stream-brings-ever-warmer-water-into-arctic-ocean.html

- The Mechanism leading to Collapse of Civilization and Runaway Global Warming
http://arctic-news.blogspot.com/p/the-mechanism.html

- The Threat of Global Warming causing Near-Term Human Extinction
http://arctic-news.blogspot.com/p/threat.html

- Warming Arctic Ocean Seafloor Threatens To Cause Huge Methane Eruptions
http://arctic-news.blogspot.com/2015/09/warming-arctic-ocean-seafloor-threatens-to-cause-huge-methane-eruptions.html

- Climate Plan
http://arctic-news.blogspot.com/p/plan.html


Friday, August 21, 2015

Ocean Heat Invades Arctic Ocean

[ click on image to enlarge ]
NOAA analysis shows that, on land, it now is about 1°C (1.8°F) warmer than the 20th century average.

July 2015 was the warmest month ever recorded for the globe. The combined average temperature over global land and ocean surfaces for July was the all-time highest monthly temperature in the 1880-2015 record – it was 16.61°C (61.86°F), i.e. 0.81°C (1.46°F) above the 20th century average. 

Sea surfaces were very warm as well, in particular the North Pacific, which on August 22, 2015, was exactly 1°C (1.8°F) warmer than it was compared to the period from 1971 to 2000 (see Climate Reanalyzer image right).

The July globally-averaged sea surface temperature was the highest temperature for any month in the 1880-2015 record. In July 2015, the sea surface on the Northern Hemisphere was 0.87°C (1.57°F) warmer than it was in the 20th century, as illustrated by the NOAA graph below. 


As the image below shows, the July data for sea surface temperature anomalies on the Northern Hemisphere contain a trendline pointing at a rise of 2°C (3.6°F) before the year 2030. In other words, if this trend continues, the sea surface will be 2°C (3.6°F) warmer in less than 15 years time from now.

[ click on image to enlarge ]
Such a temperature rise would be a catastrophe, as there are huge amounts of methane contained in the form of hydrates and free gas in sediments under the Arctic Ocean seafloor. A relatively small temperature rise of part of these sediments could cause a huge abrupt methane eruption, which could in turn trigger further eruptions of methane.

As illustrated by the image below, high methane levels are already showing up over the Arctic.

Methane levels as high as 2565 parts per billion were recorded on August 18, 2015

[ click on image to enlarge ]
Loss of Arctic sea ice could speed up such a development. The image on the right shows that, on August 20, 2015, Arctic sea ice extent was at a record low for the time of the year except for the years 2007, 2011 and 2012.

The situation today is even worse than one might conclude when looking at sea ice extent alone. Thick sea ice is virtually absent compared to the situation in the year 2012 around this time of year, as illustrated by the image below that compares sea ice thickness on August 20, 2012 (left) with August 20, 2015 (right).


The comparison below further illustrates this. The left panel shows how thick sea ice is anchored to the north-east tip of Greenland on July 7, 2015. The right panel shows how, on August 20, 2015, this ice has been fractured and shattered into pieces. All this ice looks set to soon flow down Fram Strait and melt away in ever warmer water.


The image below shows sea surface temperature anomalies on August 21, 2015.


On the image below, the green circle at the top of each globe indicates a location where sea surface temperature was 17°C (62.6°F) on August 21, 2015, an anomaly of 11.9°C (21.4°F). This is where warm water is entering the Arctic Ocean from the Atlantic Ocean. At the same time, warm water is entering the Arctic ocean through the Bering Strait from the Pacific Ocean.

[ click on image to enlarge ]
There still are a few weeks to go before sea ice can be expected to reach its minimum, at around half September 2015, while sea currents will continue to carry warmer water into the Arctic Ocean for months to come. More open water increases the chance that storms will develop that will push the last remnants of the sea ice out of the Arctic Ocean, as discussed in earlier posts such as this one, while storms can also mix warm surface waters all the way down to the seafloor, as discussed in this earlier post.

Typhoons increase this danger. The Climate Reanalyzer image below shows typhoons in the Pacific.


[ click on image to enlarge ]
Typhoons developing in the Pacific Ocean are getting stronger as the oceans warm. One of the typhoons visible on above map, Typhoon Goni, has just claimed ten lives in the Philippines.

Stronger typhoons come with an increased chance that they will bring strong winds and warm air and water into the Arctic.

Typhoon Goni and the larger Typhoon Atsani are both moving north and look set to move into the direction of the Arctic Ocean, as illustrated by the forecast for the situation on August 26, 2015, on the right.

Atsani was the twelfth typhoon and sixth super typhoon of the year in the western North Pacific—numbers that meteorologists say put the season on a record-breaking track. The NASA image below gives an idea of the size of Typhoon Atsani.

[ Typhoon Atsani - NASA image ]
The situation is dire and calls for comprehensive and effective action, as discussed in the Climate Plan.


July data for sea surface temperature anomalies on the Northern Hemisphere contain a trendline pointing at a rise of 2°C...
Posted by Sam Carana on Friday, August 21, 2015

Friday, August 7, 2015

Record High Methane Levels

[ click on images to enlarge ]
As the top image shows, sea surface temperature anomalies in the Bering Strait on August 4, 2015, were as high as 8.7°C (15.6°F). Such high anomalies are caused by a combination of ocean heat, of heatwaves over Alaska and Siberia extending over the Bering Strait, and of warm river water run-off.

As the image on the right shows, sea surface temperatures in the Bering Strait were as high as 20.5°C (69.1°F) on August 4, 2015.

As warm water flows through the Bering Strait into the Arctic Ocean, it dives under the sea ice and becomes harder to detect by satellites that typically measure water temperatures at the surface, rather than below the surface.

The image below shows sea surface temperature anomalies from 1971 to 2000, for August 6, 2015, as visualized by Climate Reanalyzer.


Climate Reanalyzer applies a mask over sea-ice-covered gridcells, reducing anomalies in such cells to zero.

Below is a NOAA image, for August 5, 2015, also with anomalies from 1971 to 2000.


Below is another NOAA image, showing anomalies for August 6, 2015. Because the base period is 1961 to 1990, the anomalies are higher. Nonetheless, the yellow areas that feature around the North Pole on above image do not show up on the image below.


In other words, looking at sea surface temperatures alone may lead to underestimations of the temperatures of the water underneath the sea ice. Keeping that in mind, have a look again at the high anomalies on the image below.


The danger is that further decline of the sea ice will lead to rapid warming of the Arctic Ocean, while the presence of more open water will also increase the opportunity for strong storms to develop that can mix high sea surface temperatures all the way down to the seafloor, resulting in destabilization of sediments and triggering releases of methane that can be contained in such sediments in huge amounts.

The image below shows that global mean methane levels as high as 1840 parts per billion (ppb) were recorded on August 4, 2015. Peak methane levels that day were as high as 2477 ppb.


This peak level of 2477 ppb isn't the highest recorded the year. As the image below shows and as discussed in a previous post, methane levels as high as 2845 ppb were recorded on April 25, 2015. The average of the daily peaks for this year up to now is 2355 ppb. Very worrying about the above image are the high levels of methane showing up over the Arctic Ocean.


As above image also shows, the mean methane level of 1840 ppb is in line with expectations, as methane levels rise over the course of the year, to reach a maximum in September. This mean level of 1840 ppb is higher than any mean level since records began.

The image below shows all the World Meteorological Organisation (WMO) annual means that are available, i.e. for the period 1984 through to 2013.


As above image shows, a polynomial trendline based on these WMO data (for the period 1984 through to 2013) points at a doubling of mean global methane levels by about 2040. The added NOAA data are the highest mean in 2014, i.e. 1839 ppb recorded on September 7, 2014, and the above-mentioned level of 1840 ppb recorded on August 4, 2015.

As said, mean global methane levels last year reached its peak in September and the same is likely to occur this year. In other words, this new record is likely to be superseded by even higher levels soon.

The image on the right shows the steady rise of the highest mean daily methane levels that have been recorded recently, indicating that a continued rise can be expected that would put another highest mean level for 2015 on the trendline of above image soon.

Again, the danger is that a warming Arctic Ocean will trigger further methane releases from the seafloor, leading to rapid local warming that in turn will trigger further methane releases, in a vicious cycle of runway warming.

As illustrated by the image on the right, at a 10-year timescale, the current global release of methane from all anthropogenic sources exceeds all anthropogenic carbon dioxide emissions as agents of global warming.

Over the next decade or so, methane emissions are already now more important than carbon dioxide emissions in driving the rate of global warming, and this situation looks set to get worse fast.

Unlike carbon dioxide, methane's GWP does rise as more of it is released. Higher methane levels cause depletion of hydroxyl, which is the main way for methane to be broken down in the atmosphere.

The situation is dire and calls for comprehensive and effective action as discussed at the Climate Plan.  


The image shows all the World Meteorological Organisation (WMO) annual means that are available, i.e. for the period...
Posted by Sam Carana on Friday, August 7, 2015