Showing posts with label North Pole. Show all posts

Wednesday, February 8, 2017

Warning of mass extinction of species, including humans, within one decade


[ click on images to enlarge ]
On February 10, 2017, 18:00 UTC it is forecast to be 0.1°C or 32.1°F at the North Pole, i.e. above the temperature at which water freezes. The temperature at the North Pole is forecast to be 30°C or 54°F warmer than 1979-2000, on Feb 10, 2017, 18:00 UTC, as shown on the Climate Reanalyzer image on the right.

This high temperature is expected as a result of strong winds blowing warm air from the North Atlantic into the Arctic.

The forecast below, run on February 4, 2017, shows that winds as fast as 157 km/h or 98 mph were expected to hit the North Atlantic on February 6, 2017, 06:00 UTC, producing waves as high as 16.34 m or 53.6 ft.


A later forecast shows waves as high as 17.18 m or 54.6 ft, as illustrated by the image below.


While the actual wave height and wind speed may not turn out to be as extreme as such forecasts, the images do illustrate the horrific amounts of energy contained in these storms.

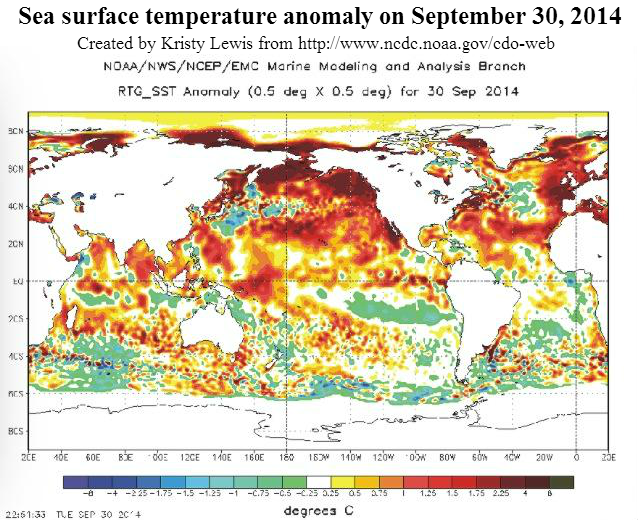
Stronger storms go hand in hand with warmer oceans. The image below shows that on February 4, 2017, at a spot off the coast of Japan marked by green circle, the ocean was 19.1°C or 34.4°F warmer than 1981-2011.


As discussed in an earlier post, the decreasing difference in temperature between the Equator and the North Pole causes changes to the jet stream, in turn causing warmer air and warmer water to get pushed from the North Atlantic into the Arctic.

The image below shows that on February 9, 2017, the water at a spot near Svalbard (marked by the green circle) was 13°C or 55.3°F, i.e. 12.1°C or 21.7°F warmer than 1981-2011.

[ click on images to enlarge ]
Warmer water flowing into the Arctic Ocean in turn increases the strength of feedbacks that are accelerating warming in the Arctic. One of these feedbacks is methane that is getting released from the seafloor of the Arctic Ocean. Update: The image below shows that methane levels on February 13, 2017, pm, were as high as 2727 ppb, 1½ times the global mean at the time.

[ click on image to enlarge, right image added for reference to show location of continents ] 
What caused such a high level? High methane levels (magenta color) over Baffin Bay are an indication of a lot of methane getting released north of Greenland and subsequently getting pushed along the exit current through Nares Strait (see map below). This analysis is supported by the images below, showing high methane levels north of Greenland on the morning of February the 14th (left) and the 15th (right).


The image below shows methane levels as high as 2569 ppb on February 17, 2017. This is an indication of ocean heat further destabilizing permafrost at the seafloor of the Laptev Sea, resulting in high methane concentrations where it is rising in plumes over the Laptev Sea (at 87 mb, left panel) and is spreading over a larger area (at slightly lower concentrations) at higher altitude (74 mb, right panel).


This illustrates how increased inflow of warm water from the North Atlantic into the Arctic Ocean can cause methane to erupt from the seafloor of the Arctic Ocean. Methane releases from the seafloor of the Arctic Ocean have the potential to rapidly and strongly accelerate warming in the Arctic and speed up further feedbacks, raising global temperature with catastrophic consequences in a matter of years. Altogether, these feedbacks and further warming elements could trigger a huge abrupt rise in global temperature making that extinction of many species, including humans, could be less than one decade away.

Youtube video by RT America

Without action, we are facing extinction at unprecedented scale. In many respects, we are already in the sixth mass extinction of Earth's history. Up to 96% of all marine species and 70% of terrestrial vertebrate species became extinct when temperatures rose by 8°C (14°F) during the Permian-Triassic extinction, or the Great Dying, 252 million years ago.

During the Palaeocene–Eocene Thermal Maximum (PETM), which occurred 55 million years ago, global temperatures rose as rapidly as by 5°C in ~13 years, according to a study by Wright et al. A recent study by researchers led by Zebee concludes that the present anthropogenic carbon release rate is unprecedented during the past 66 million years. Back in history, the highest carbon release rates of the past 66 million years occurred during the PETM. Yet, the maximum sustained PETM carbon release rate was less than 1.1 Pg C per year, the study by Zebee et al. found. By contrast, a recent annual carbon release rate from anthropogenic sources was ~10 Pg C (2014). The study by Zebee et al. therefore concludes that future ecosystem disruptions are likely to exceed the - by comparison - relatively limited extinctions observed at the PETM.

An earlier study by researchers led by De Vos had already concluded that current extinction rates are 1,000 times higher than natural background rates of extinction and future rates are likely to be 10,000 times higher.

from the post 2016 well above 1.5°C
As above image shows, a number of warming elements adds up to a potential warming of 10°C (18°F) from pre-industrial by the year 2026, i.e. within about nine years from now, as discussed in more detail at the extinction page.


Above image shows how a 10°C (18°F) temperature rise from preindustrial could be completed within a decade.

https://sites.google.com/
site/samcarana/climateplan
The situation is dire and calls for comprehensive and effective action, as discussed in the Climate Plan.


Links

• Climate Plan
http://arctic-news.blogspot.com/p/climateplan.html

• Arctic Ocean Feedbacks
http://arctic-news.blogspot.com/2017/01/arctic-ocean-feedbacks.html

• Extinction
http://arctic-news.blogspot.com/p/extinction.html

• How much warming have humans caused?
http://arctic-news.blogspot.com/2016/05/how-much-warming-have-humans-caused.html

• Estimating the normal background rate of species extinction, De Vos et al. (2015)
https://www.ncbi.nlm.nih.gov/pubmed/25159086

• Anthropogenic carbon release rate unprecedented during the past 66 million years, by Zebee et al. (2016)
http://www.nature.com/ngeo/journal/v9/n4/full/ngeo2681.html

• Evidence for a rapid release of carbon at the Paleocene-Eocene thermal maximum, Wright et al. (2013)
http://www.pnas.org/content/110/40/15908.full?sid=58b79a3f-8a05-485b-8051-481809c87076

• RT America Youtube video
https://www.youtube.com/watch?v=OSnrDRU6_2g

• RT America Facebook video
https://www.facebook.com/RTAmerica/videos/10154168391051366


Sunday, August 16, 2015

Arctic Sea Ice Collapse Threatens - Update 5

The image below shows sea surface temperatures in the Arctic as at August 15, 2015.


Below a time lapse video, covering the period from May 30 to August 15, 2015, created by Cameron Forge with daily images from NPEO Webcam 1 from the North Pole Environmental Observatory, National Science Foundation. For a drift map of the buoys, also see this page.


Below is an August 14, 2015, satellite image from Arctic.io showing that there is very little sea ice to the north east of Greenland and what is there looks to be very thin as well.


The image below shows Arctic sea ice extent, with the blue dot indicating the extent for August 14, 2015.


More will follow soon.


Sea surface temperatures in the Arctic as at August 15, 2015.http://arctic-news.blogspot.com/2015/08/arctic-sea-ice-collapse-threatens-update-5.html
Posted by Sam Carana on Sunday, August 16, 2015

Friday, December 26, 2014

Year 2014 Pictures Dire Situation

The year 2014 is shaping up to be the warmest year on record and the heat is felt most strongly in the polar regions and in the oceans. 

Surface Temperatures


Above images show that the Arctic is experiencing accelerating warming. This is causing jet stream changes, resulting in more extreme weather events. Besides creating havoc around the globe, such extreme weather events can further speed up warming of the Arctic Ocean and subsequent release of methane from its seafloor, as described in more detail in a recent post

Ocean Heat

The primary driver of methane release from the Arctic Ocean seafloor is ocean heat. NOAA analysis shows that the global ocean surface temperature for the year-to-date (January through to November 2014) was 1.03°F (0.57°C) above average, the warmest such period on record. The anomaly is even more pronounced in the Norther Hemisphere, as illustrated by the image below.


Ocean temperatures can show much higher anomalies locally, as illustrated by the image below. The high sea surface temperatures near Svalbard give an indication of how warm the ocean current is below the surface.

2014 SST anomaly near Svalbard (green circle) Aug 26: 7.3°C, Sep 26: 6.7°C, Oct 26: 5.9°C, Nov 26: 4.2°C, Dec 26: 3.7°C
The danger is that ocean temperatures will continue to rise, especially in the North Atlantic, and that the Gulf Stream will keep carrying ever warmer water from the North Atlantic into the Arctic Ocean, where it will destabilize methane hydrates contained in sediments under the seafloor.

Methane

Methane levels are already exceptionally high over the Arctic, as illustrated by the recent NOAA image below. Since end October 2014, huge quantities of methane have erupted from the seafloor of the Arctic Ocean. As said, the primary driver of methane release from the Arctic Ocean seafloor is ocean heat. Water temperatures off the coast of North America get very high in July and it takes a few months for ocean currents to carry this heat to the Arctic Ocean. Further reasons why methane levels over the Arctic suddenly get very high from the end of October are discussed in this post.

The Gulf Stream will keep carrying water into the Arctic Ocean that is warmer than the water already there. These methane eruptions will therefore continue into the new year, threatening to further accelerate warming in the Arctic and cause even more extreme weather events, wildfires and further emissions in the year 2015, in a spiral of runaway warming. 


The combination image below shows the strength at which methane is erupting from the Arctic Ocean seafloor. On December 25, 2014, methane lights up the northern sky like a Christmas tree. The image shows levels at 6 km (19,820 ft) altitude, as recorded by, from top to bottom, MetOp-1 am (up to 2277 ppb), MetOp-1 pm (up to 2295 ppb) and MetOp-2 am (up to 2336 ppb).


MetOp-2 records for December 25, 2014, pm, are incorporated in the animation below, showing methane concentrations reaching levels of up to 2284 ppb at an altitude of 6 km (19,820 ft) and reaching even higher levels of up to 2329 ppb at an altitude of 9.3 km (30,570 ft).


The troposphere is deepest at tropical latitudes, where it reaches altitudes of up to 20 km (12 mi), and rather shallow at the polar regions, where it only reaches altitudes of some 7 km (4.3 mi) in winter. For high concentrations of methane to show up over the Arctic Ocean at such a high altitude is a further indication of the strength of these methane eruptions.

Furthermore, the methane that shows up in the atmosphere is only a fraction of the methane that is erupting from the seafloor, as part of the methane will be broken down by microbes as it rises up through the water and gets stuck under the sea ice.

Arctic Sea Ice 


Sea ice only 1m thin at North Pole.
Click on image to enlarge.
The above Naval Research Laboratory animation shows that, while sea ice is now covering the entire Arctic ocean, it is in many places only about one meter thin or less. The December 20, 2014, image on the right shows 1m thin sea ice at the North Pole.

Meanwhile, huge chuncks of thick sea ice are moving along the edges of Greenland and Ellesmere Island into the Atlantic ocean.

An exponential trendline based on sea ice volume observations shows that sea ice looks set to disappear in 2019, while disappearance in 2015 is within the margins of a 5% confidence interval, reflecting natural variability.

In other words, extreme weather events could cause Arctic sea ice to collapse as early as 2015, with the resulting albedo changes further contributing to the acceleration of warming in the Arctic and causing further methane eruptions from the seafloor of the Arctic Ocean.

Demise of the sea ice and snow cover in the Arctic results in further acceleration of warming, not only due to less sunlight getting reflected back into space, but also due to loss of the buffer that currently absorbs huge amounts of heat as it melts in summer. With the demise of this latent heat buffer, more sunlight will instead go into heating up the water of the Arctic Ocean. For more on the latter, see the page on latent heat

Feedbacks


Above image illustrates some of the self-reinforcing feedback loops that have been highlighted in this post. Further feedbacks are pictured in the image below.

from the Feedbacks page


Situation Calls For Comprehensive And Effective Action

The situation is dire and calls for comprehensive and effective action, as discussed at the Climate Plan blog.


Tuesday, September 30, 2014

Warm water extends from Laptev Sea to North Pole

The NOAA NESDIS image below shows sea surface temperature anomalies of well over 1ºC extending to the North Pole.


The image below gives a world view, showing SST anomalies at the top end of the scale in the Laptev Sea.


The top end of the scale on the above image is 5ºC (or 9ºF).


The visualizations above and below uses a much higher scale. Even this higher-end scale doesn't appear to fully capture the dire situation we are in.


Above image shows warm water entering the Arctic Ocean through the Bering Strait and from the North Atlantic. For months to come, the Gulf Stream will keep pushing warm water into the Arctic Ocean (i.e. water that is warmer than the water in the Arctic Ocean). It takes some time (i.e. months) for the warm water from the north Atlantic to arrive in the Arctic Ocean.

Last year, methane emissions started to become huge in October and this lasted for some six months. The image below, from an earlier post, shows methane eruptions from the seafloor of the Arctic Ocean on October 16/17, 2013.


The image below, from another earlier post, shows methane eruptions from the seafloor of the Arctic Ocean on October 31, 2013.


The image below, from yet another earlier post, shows methane levels as high as 2662 parts per billion on November 9, 2013.


This year, there is even more ocean heat present, especially in the north Atlantic and the north Pacific. On September 29, 2014, methane levels as high as 2641 parts per billion were recorded and it looks like worse is yet to come.


The video below, Sea floor methane hydrate climate hazard, is an extract produced by Peter Carter from a presentation by Miriam Kastner, uploaded 7 August 2008 at Youtube.


The situation is dire and calls for comprehensive and effective action, as discussed at the Climate Plan blog.


Thursday, January 30, 2014

Forecast: America to be hit by temperatures as low as minus 40 degrees

The image on the right shows that large parts of North America, the Arctic Ocean and Siberia are experiencing low temperatures.

What many people may not realize is that temperatures in the Arctic are actually a lot higher than they used to be around this time of year.

Temperatures in the Arctic have risen due to feedbacks as described in the post The Biggest Story of 2013.

As a result, temperature anomalies above 20 degrees Celsius now feature in the Arctic. As the image on the right illustrates, the once-common temperature difference between the Arctic and lower latitudes has been shattered, and this is weakening the Jet Stream and the Polar Vortex, in turn making it easier for cold air to flow down to lower latitudes and for warmer air to enter the Arctic, as described in posts at this blog for years, e.g. this post.

This is illustrated by the image below, showing that the Arctic is hit by an overall temperature anomaly of 6.55 degrees Celsius, while some areas in the Arctic feature anomalies above 20 degrees Celsius.


Forecasts show that on February 2nd, 2014, 1200 UTC, the Arctic will be hit by a temperature anomaly of 7.85 degrees Celsius, while on February 6th, 2014, 1200 UTC, the U.S. will be hit by temperatures as low as -40 degrees, as illustrated by the image below.


The video below shows temperature forecasts from February 1to February 8, 2014.


The video below shows temperatire anomalies from February 2 to February 9, 2014.


Meanwhile, the Gulf Stream keeps pushing warm water into the Arctic Ocean, as illustrated by the image below.

Click on image to enlarge - view updated animation at earth.nullschool.net 
The image below shows how high sea surface temperature anomalies stretch out from the point where the Gulf Stream travels at high speeds, off the coast of North America, all the way into the Arctic Ocean.


This has already resulted in methane eruptions from the seafloor of the Arctic Ocean that started several months ago and are continuing to date - ominous signs of more to come. The image below, which compares peak methane levels at two altitudes between January 2013 and January 2014, suggests that January 2014 peak levels have increased strongly, compared to January 2013 peak levels. Furthermore, that the rise in average peak readings has been most dramatic at the higher altitude.


This suggests that huge quantities of methane have indeed been released from hydrates under the Arctic ocean, and that much of the methane is rising and building up at higher altitudes. The increasing appearance of noctilucent clouds further confirms indications that methane concentrations are rising at higher altitudes.

Of course, the above analysis uses a limited dataset, but if verified by further analysis, it would confirm a dramatic rise in the presence of methane in the atmosphere due to releases from hydrates. Moreover, it would confirm the immensity of threat that releases from the Arctic Ocean will escalate and trigger runaway warming, as high methane concentrations over the Arctic are contributing to the anomalously high temperatures there. The risk that this will eventuate is unacceptable, which calls for comprehensive and effective action such as discussed at the ClimatePlan blog.

Thursday, September 19, 2013

Is the North Pole now ice-free?

Is the North Pole now ice-free? It could well be that, by the time you read this, there will be no ice left at all at the North Pole. The image below, created by Sam Carana from a nowcast from the Naval Research Laboratory, run on September 17, 2013 and valid for September 18, 2013, shows open water extending all the way to a spot very close to the North Pole.


As the color indicates, sea ice thickness in this area is virtually zero (i.e. ice-free). This development of an ice-free area at the North Pole has been discussed in earlier posts such as:
  • Arctic sea ice thickness falls by 2m in 21 days in some areas (June 13, 2013)
  • Open Water In Areas Around North Pole (June 22, 2013), describing areas around the North Pole where sea ice thickness had fallen to virtually zero, i.e. open water. 
  • Open Water at North Pole (July 22, 2013), descibing a wide corridor that had developed with very thin ice between the North Pole and Siberia. The post added that surface water on top of this thin ice could extend along this corridor, all the way from the North Pole to edge of the ice, in which case the surface water effectively becomes part of open water.
  • North Hole (September 2, 2013), describing areas close to the North Pole where ice volume had fallen to virtually zero, while pointing at how devastating the impact of sea surface temperature anomalies can be. 
This sea ice thinning in areas close to the North Pole has been one of the most important developments in 2013. Yet, many people keep watching sea ice extent.

Why was Arctic sea ice not smaller in extent in 2013 than in 2012?

The comparison below shows both volume and the extent of the sea ice for the same day in 2013 (left), respectively 2012 (right). Natural variability can make Arctic sea ice slightly smaller or larger than projected. There are many factors that influence things from year to year, such as weather conditions, sea currents and temperatures of the water in the Atlantic and Pacific Oceans; some factors are discussed in more detail below.


The above comparison shows a lot more ice north of Alaska in 2013 (above left) than in 2012 (above right). The comparison below shows that salinity levels in the Beaufort Sea were lower in 2013 (below left) than in 2012 (below right).


Seawater typically has a salinity level of over 3%; it freezes at about −2°C (28°F). Where mixing occurs with fresh water runoff from melting glaciers and permafrost, the water in the Arctic Ocean can become substantially less saline. Other substances added to the water, such as sand, can also cause a freezing point drop. The freezing and melting point of fresh water (i.e. zero salinity) is 0°C (or 32°F).  Less salinity means the water will remain frozen until the temperature reaches levels closer to 0°C.

Thinning continues

Heatwave conditions in Alaska caused greater melting of the permafrost. The result was more fresh water run-off through the MacKenzie River into the Beaufort Sea. This has contributed to keep sea ice extent larger in 2013. Yet, the warm water has also contributed to further thinning of the ice, reinforcing warnings that the sea ice looks set to disappear altogether within years. 


As illustrated by the above image by Neven, from the Arctic Sea Ice blog, average Arctic sea ice thickness (crudely calculated by dividing PIOMAS (PI) volume numbers with Cryosphere Today (CT) sea ice area numbers) has been very low in 2013.

The image below shows that annual minimum volumes appear to follow an exponential trend downward to zero, firstly reached in September 2015, followed by zero ice in the surrounding months over subsequent years.

Some people have objected against using PIOMAS data for such projections, with arguments ranging from suggestions that PIOMAS data were not reliable, that natural variability could prove such projections to be wrong, to questioning whether an exponential trend was appropriate. Nonetheless, it seems that over the years arguments in favor of an exponential trend have only become stronger:
  • Further measurements such as by CryoSat have confirmed that the PIOMAS data are indeed reliable and that the sea ice decline may well be even more dramatic. 
  • Natural variability goes both ways, it can either speed up or slow down ice melt. Had there been less runoff from the MacKenzie River, the sea ice in 2013 may not have been able to refreeze after being hit by cyclones several times. Next year we may not be so lucky and sea ice could disappear altogether, due to natural variability.  
  • Thick ice along the northern coast of Greenland is indeeed more persistent because of on-shore winds that cause the ice to drift and pile-up there. This would favor a Gompertz (or Sigmoid) trend in extrapolations (see image on the right). However, the new development of an ice-free North Pole shows that the sea ice is capable of breaking up abruptly, not only from the outer edges toward Greenland, but also starting at the North Pole and even moving from there toward Greenland. Moreover, as the 30-day animation below shows, thick sea ice north of Greenland can thin very quickly, suggesting it could well disappear altogether within one season.  


Sea ice can thin rapidly, even when it is multiple meters thick 

Earlier in 2013, much warm water entered the Arctic Ocean from the mouths of rivers, as discussed in the post Arctic Ocean is turning red. As said, this resulted in lower salinity levels in the Beaufort Sea that prevented cyclones from demolishing the sea ice altogether. Nonetheless, the joint impact of cyclones and warm water does appear to have caused rapid decline of the thick ice north of Greenland and Canada, as earlier discussed in an earlier post

Furthermore, sea surface temperatures have been recorded close to Svalbard that are far higher than even in the waters closer to the Atlantic Ocean. This phenomenon is illustrated by the image below, showing sea surface temperatures (top) and sea surface temperature anomalies (underneath). 


In some of these spots, sea surface temperatures are well over 10°C (50°F). Where does this heat come from? 

These hot spots could be caused by undersea volcanic activity; this is the more dangerous as the area has seen methane bubbling up from hydrates that have become destabilized; such dangers have been discussed repeatedly, e.g. in the post Runaway Global Warming. Hot spots can also contribute to even more dramatic thinning of the sea ice, including the thickest parts. 

In conclusion, there is no reason to assume that the sea ice in the Arctic will somehow magically recover. Instead, there are many indications that exponential decline of Arctic sea ice will continue. Less salinity may have temporarily prolonged the extent of the sea ice in some areas, but as sea surface temperatures keep rising, the ever thinner ice looks set to collapse within years, with dire consequences. This calls for comprehensive and effective action, such as described at the ClimatePlan blog.  


Related posts

- Arctic sea ice thickness falls by 2m in 21 days in some areas
Arctic-news.blogspot.com/2013/06/arctic-sea-ice-thickness-falls-by-2m-in-21-days-in-some-areas.html

- Open Water In Areas Around North Pole
Arctic-news.blogspot.com/2013/06/open-water-in-areas-around-north-pole.html

- Open Water at North Pole
Arctic-news.blogspot.com/2013/07/open-water-at-north-pole.html

- North Hole
Arctic-news.blogspot.com/2013/09/north-hole.html

- CryoSat - New Dimensions on Ice
esa.int/Our_Activities/Observing_the_Earth/Living_Planet_Symposium_2013/New_dimensions_on_ice

- Arctic Ocean is turning red
Arctic-news.blogspot.com/2013/08/arctic-ocean-is-turning-red.html

- Cyclone raging on thin ice
Arctic-news.blogspot.com/2013/08/cyclone-raging-on-thin-ice.html

- Runaway Global Warming
Geo-engineering.blogspot.com/2011/04/runaway-global-warming.html

- Climate Plan
ClimatePlan.blogspot.com