
Above image shows that, in October 2020, the Arctic Ocean was very hot. The Copernicus image below shows temperatures averaged over the twelve-month period from November 2019 to October 2020.
Keep in mind that, in the Copernicus image, anomalies are compared to the 1981-2010 average.
Note that the shape of the recent twelve-month period is similar to the 2016 peak, when there was a strong El Niño, while in October 2020 the temperature was suppressed due to La Niña and due to low sunspots.


As it turned out, the highest temperature at the North Pole was 1.1°C or 34.1°F on November 12, 2020, at 1000 hPa at 18:00Z, as above image shows. At 15:00Z that day, a temperature of 1.9°C or 35.3°F was recorded at 1000 hPa just south of the North Pole, at 89.50° N, 1.50° E.

These high temperatures over the Arctic Ocean are caused by transfer of huge amounts of heat from the Arctic Ocean to the atmosphere, indicating severe overheating of the Arctic Ocean as a result of the ongoing movement of ocean heat at the surface of the North Atlantic to the Arctic Ocean along the Gulf Stream.
As the image on the right shows, temperature anomalies above 20°C were recorded over a large part of the Arctic Ocean on November 16, 2020.

The image on the right shows that the Jet Stream was as fast as 411 km/h or 255 mph south of Greenland (at the green circle), before crossing the Arctic Ocean on November 4, 2020.
The image below shows how, on November 20, 2020 15:00 UTC, a distorted Jet Stream reaches a speed of 327 km/h or 203 mph (at circle, globe left). At 850 hPa, wind reaches speeds as high as 161 km/h or 100 mph (circle, globe right).

Stronger wind results in stronger evaporation, which cools down the sea surface somewhat, as the blue areas over the Pacific Ocean indicate. Due to the strong wind, much of the moisture falls down farther on the path of the wind. The globe on the right shows 3-hour precipitation accumulation as high as 31.3 mm or 1.23 in off the west coast of North America (green circle).


As the image below shows, the N2O satellite recorded a peak methane level of 2762 ppb on the morning of November 16, 2020.

As the image below shows, the MetOp-1 satellite recorded a peak methane level of 2725 ppb on the afternoon of November 18, 2020.

The situation is dire and calls for comprehensive and effective action, as discussed in the Climate Plan.
Links
• Climate Plan
https://arctic-news.blogspot.com/p/climateplan.html
• Copernicus - surface air temperature for October 2020
• Atmospheric River Smashes Alaskan Capital’s 24-Hour Rain Record
• Bubbling methane craters and super seeps - is this the worrying new face of the undersea Arctic? - by Valeria Sukhova, Olga Gertcyk - Siberian Post
• Why stronger winds over the North Atlantic are so dangerous
• September 2015 Sea Surface Warmest On Record
Note that the shape of the recent twelve-month period is similar to the 2016 peak, when there was a strong El Niño, while in October 2020 the temperature was suppressed due to La Niña and due to low sunspots.
The image below shows how a hot Arctic Ocean distorts the Jet Stream and hot air moves all the way up to the North Pole.
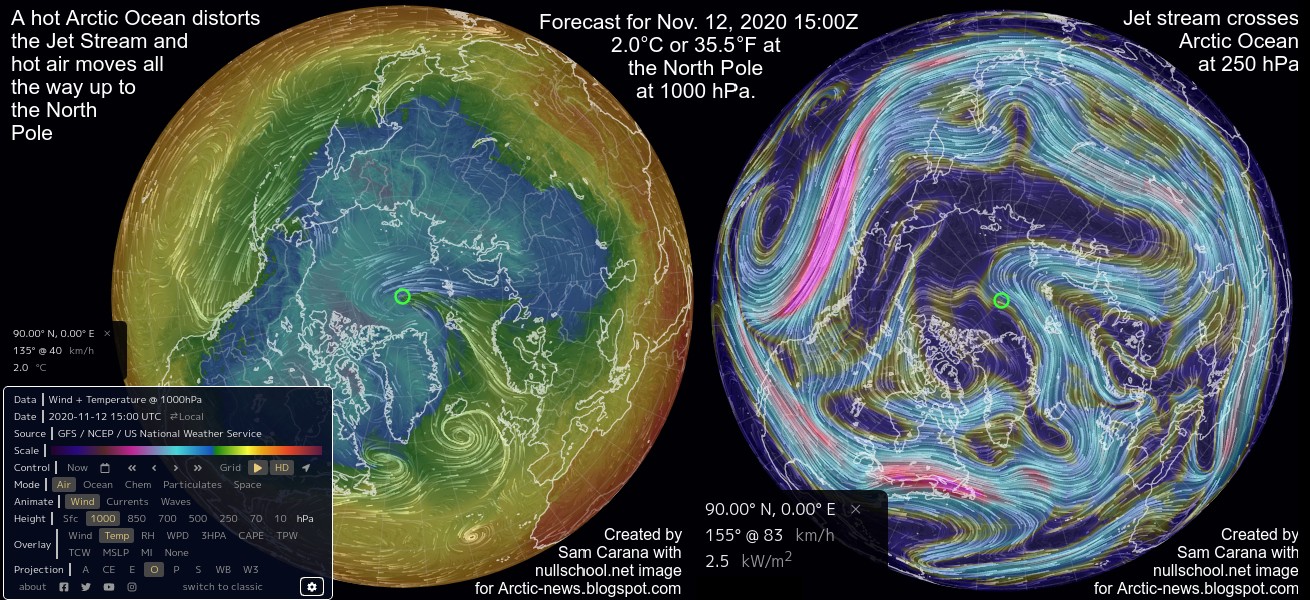
Above image shows the Northern Hemisphere at November 12, 2020, with a temperature forecast of 2.0°C or 35.5°F at the North Pole at 1000 hPa at 15:00Z. On the right, jet stream crosses the Arctic Ocean (at 250 hPa). At surface level, a temperature was forecast to be 0.6°C or 33.2°F.

The image below shows temperature anomalies for November 12, 2020, with forecasts approaching 30°C.

 |
| [ Click on images to enlarge ] |
As the image on the right shows, temperature anomalies above 20°C were recorded over a large part of the Arctic Ocean on November 16, 2020.
As illustrated by the image below, temperature anomalies are forecast to remain high over the Arctic Ocean, with the forecast for November 26, 2020, showing anomalies approaching 30°C.

The resulting distortion of the Jet Stream can at times speed up winds that move hot air from the North Atlantic Ocean toward to Arctic Ocean, as illustrated by the image at the top.
 |
| [ click on images to enlarge ] |
The danger is that such strong wind will speed up ocean currents in the North Atlantic that carry huge amounts of heat toward the Arctic Ocean.

The image below shows sea surface temperature anomalies compared to 1981-2011 on the Northern Hemisphere on October 23, 2020, when anomalies off the coast of North America were as high as 10.8°C or 19.5°F (left), and on December 3, 2020, when anomalies off the coast of North America were as high as 12.7°C or 22.8°F (right).

The image below shows sea surface temperature anomalies compared to 1981-2011 on the Northern Hemisphere on October 23, 2020, when anomalies off the coast of North America were as high as 10.8°C or 19.5°F (left), and on December 3, 2020, when anomalies off the coast of North America were as high as 12.7°C or 22.8°F (right).

According to a recent news report, an atmospheric river smashed into Juneau, Alaska, dropping 5.08 inches of rain in 24 hours ending 3 a.m. Wednesday December 2, 2020.
This is not an isolated event, but a symptom of the unfolding catastrophe referred to as global warming, which threatens to remove all life from Earth.
This is not an isolated event, but a symptom of the unfolding catastrophe referred to as global warming, which threatens to remove all life from Earth.
Sea surface temperatures around North America are very high. The above image shows that sea surface temperatures were as much as 12.7°C or 22.8°F higher than 1981-2011 off the east coast of North America on December 3, 2020 (green circle). On the image below, the globe on the left shows that sea surface temperature anomalies (SSTA) were as high as 4.1°C or 7.3°F off the west coast of North America on December 4, 2020 (at the green circle).
These high sea surface temperatures speed up de Jet Stream over oceans. At this time of year, temperatures over continents are low, so there is greater ocean/land temperature difference, which further speeds up the Jet Stream where it travels over oceans toward continents. The center globe shows wind as fast as 381 km/h or 237 mph at the time (at circle).
These high sea surface temperatures speed up de Jet Stream over oceans. At this time of year, temperatures over continents are low, so there is greater ocean/land temperature difference, which further speeds up the Jet Stream where it travels over oceans toward continents. The center globe shows wind as fast as 381 km/h or 237 mph at the time (at circle).
At the same time, the narrowing temperature difference between the Equator and the North Pole is slowing down the Jet Stream. This is making the Jet Stream more wavy at higher latitudes, even resulting in circular wind patterns, and this can make a lot of cold air leave the Arctic and move over continents, thus further widening the ocean/land temperature difference. Given that more than 90% of global warming goes into oceans, this is an important self-reinforcing feedback of global warming.
Stronger wind results in stronger evaporation, which cools down the sea surface somewhat, as the blue areas over the Pacific Ocean indicate. Due to the strong wind, much of the moisture falls down farther on the path of the wind. The globe on the right shows 3-hour precipitation accumulation as high as 31.3 mm or 1.23 in off the west coast of North America (green circle).

The image below shows an earlier analysis, describing the situation in September 6, 2020, when high sea surface temperatures on the Northern Hemisphere and a narrow difference between the Equator and the North Pole distorted the Jet Stream, making it cross the Arctic Ocean, form circular wind patterns and reach speeds as fast as 262 km/h or 163 mph (250 hPa, green circle) over the North Atlantic. The globe on the right shows that the Gulf Stream off the North American coast reached speeds of 8 km/h or 5 mph (at green circle).
 |
| [ click on images to enlarge ] |
More ocean heat can move into the Arctic Ocean for a number of reasons, including:
As the image below shows, sea surface temperatures as high as 16.6°C or 61.9°F were recorded north of Svalbard on November 9, 2020. - At times, the Jet Stream becomes very strong and elongated over the North Atlantic, speeding up the flow of ocean heat along the path of Gulf Stream all the way to the Arctic Ocean;
- Overall, winds are getting stronger, speeding up ocean currents running just below the sea surface;
- Stratification of the North Atlantic results in less heat mixing down to lower parts of the ocean; and
- Increased evaporation and increased subsequent rainfall farther down the path of the Gulf Stream forms a colder freshwater lid stretched out at the sea surface from the North Atlantic to the Arctic Ocean, sealing off transfer of heat from ocean to atmosphere and consequently moving more heat just underneath the sea surface into the Arctic Ocean.

[ from earlier post ]

As the image below shows, the N2O satellite recorded a peak methane level of 2762 ppb on the morning of November 16, 2020.

As the image below shows, the MetOp-1 satellite recorded a peak methane level of 2725 ppb on the afternoon of November 18, 2020.

The video below shows a methane plume or bubble cloud spotted by a team of 69 scientists from ten countries documenting bubble clouds rising from a depth of around 300 metres (985ft) along a 150km (93 mile) undersea slope in the Laptev Sea.
The danger is that even more hot and salty water will reach the shallow parts of the Arctic Ocean that contain huge amounts of methane in the form of hydrates and free gas in sediments at the seafloor, resulting in huge eruptions of methane that, on its own, could almost instantly cause the 1200 ppm CO₂e cloud feedback tipping point to be crossed, which can cause global temperatures to rise by 8°C.
 |
| Latent heat loss, feedback #14 on the Feedbacks page |
The situation is dire and calls for comprehensive and effective action, as discussed in the Climate Plan.
Links
• Climate Plan
https://arctic-news.blogspot.com/p/climateplan.html
• NASA GISS Surface Temperature Analysis - global maps
• Climate Reanalyzer
• nullschool earth wind map
• Feedbacks in the Arctic
https://arctic-news.blogspot.com/2015/10/september-2015-sea-surface-warmest-on-record.html
• When will we die?
https://arctic-news.blogspot.com/2019/06/when-will-we-die.html
• A rise of 18°C or 32.4°F by 2026?
https://arctic-news.blogspot.com/2019/02/a-rise-of-18c-or-324f-by-2026.html
• Methane Hydrates Tipping Point threatens to get crossed
https://arctic-news.blogspot.com/2020/08/methane-hydrates-tipping-point-threatens-to-get-crossed.html
• Most Important Message Ever
https://arctic-news.blogspot.com/2019/07/most-important-message-ever.html
• Warning of mass extinction of species, including humans, within one decade