Sunday, July 10, 2016

Extreme Weather Events


Sea ice close to the North Pole looks slushy and fractured into small pieces. The image below shows the situation on July 8, 2016.

Sea ice north of the geographic North Pole. For more on the (geo)magnetic North Pole, see this page
For reference, the bars at the bottom right show distances of 20 km and 20 miles. By comparison, sea ice in the same area did develop large cracks in 2012, but even in September 13, 2012, it was not broken up into small pieces, as shown by this image at a recent post.


As shown by above image, by Jim Pettit, Arctic sea ice volume has been in decline for decades. While this may look like a steady decline, chances are that the sea ice will abruptly collapse over the next two months, for the reasons described below.

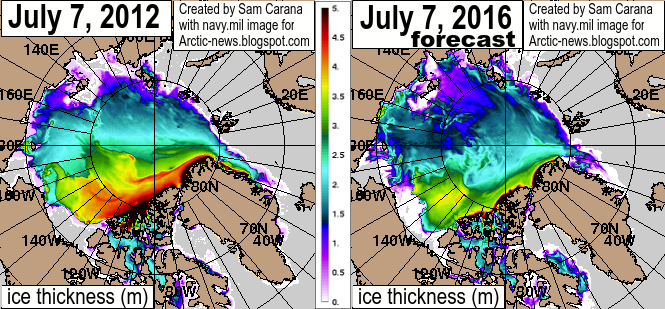
The animation below, from the Naval Research Laboratory, shows Arctic sea ice thickness for 30 days up through July 8, 2016, including a forecast of 7 days.

Below is a new Naval Research Laboratory image, dated July 4, 2016
and contributed by Albert Kallio with the following description.


NORTH POLE SEA ICE DISAPPEARING VERY RAPIDLY 4.7.2016

Albert Kallio: The upgraded US Navy sea ice thickness system revealed extreme rates of sea ice pulverization and melting on 4.7.2016 which justifies a continued close attention to the developments on the Arctic Ocean. Due to virtually continuous storm centering the North Pole for weeks now, warm water upswells and sea water mixing drives base melting of icefloes besides wave actions that both wash and pulverize broken sea ice. The more pulverized sea ice becomes, the greater its 3-dimensional surface area that sits in water becomes, this easing transfer of heat from ocean to sea ice. In addition, honeycombing of ice also flushes ice with water in a stormy weather. The final factor being that most of sea ice is very recent (seasonal) ice that contain residues of salts, when saline brine is expelled this creates boreholes into ice making it "rotten ice" easily.
https://www7320.nrlssc.navy.mil/GLBhycomcice-12/navo/arcticictn_nowcast_anim30d.gif
Sea ice decline reflects the extra energy added to the Arctic, as global warming and feedbacks are hitting the Arctic particularly strongly. Three of these feedbacks are depicted in the image on the right.

As the sea ice melts, sea surface temperatures will remain at around zero degree Celsius (32°F) for as long as there is ice in the water, since the extra energy will first go into melting the ice. Only after the ice has melted will the extra energy start raising the temperature of the water.

Sea ice thus acts as a buffer that absorbs heat, preventing sea surface temperature from rising. As
sea ice is busy melting, 
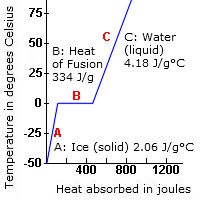
each gram of ice takes 334 Joule of heat to change into water, while the temperature remains steady at 0°C ( 32°F).

Once all ice has turned into water, all further heat goes into raising the temperature of the water. To raise the temperature of each gram of water by one degree Celsius then takes only 4.18 Joule of heat.

In other words, melting of the ice absorbs 8 times as much heat as it takes to warm up the same mass of water from zero to 10°C. As sea ice disappears, extra energy instead goes into raising the temperature of the water, as depicted in the image on the right, and as further described at the feedbacks page as feedback #14.

Sea ice can reflect as much as 90% of the sunlight back into space. Once the ice has melted away, the water of the ocean reflects only 6% of the incoming solar radiation and absorbs the rest. Albedo change is depicted in above image as feedback #1. As Professor Peter Wadhams once calculated, warming due to Arctic snow and ice loss could more than double the net warming now caused by all emissions by all people of the world.

Professor Peter Wadhams on albedo changes in the Arctic, image from Edge of Extinction
Once the sea ice has disappeared, a lot more energy will get absorbed by the Arctic Ocean, i.e. energy that was previously reflected back into space and energy that previously went into changing ice into water.

Furthermore, as the sea ice disappears, chances increase that storms will develop that come with rain and winds that can batter and push the remaining sea ice out of the Arctic Ocean, while storms can also increase the amount of water vapor in the atmosphere and the occurrence of cirrus clouds that can trap heat.

Methane is a further feedback, depicted as feedback #2 in the image further above. As the water of the Arctic Ocean gets warmer, the danger increases that heat will reach hydrates at the seafloor and that this will trigger release of huge amounts of methane, in an additional self-reinforcing feedback loop that will make warming in the Arctic accelerate further and that threatens to escalate into a third kind of warming, i.e. runaway warming. Peter Wadhams co-authored a study that calculated that methane release from the seafloor of the Arctic Ocean could yield 0.6°C warming of the planet in 5 years (see video at earlier post).


As above image shows, methane on July 8, 2016, reached levels as high as 2655 ppb. Such high levels typically occur due to methane hydrates getting destabilized. As the sea ice disappears, the situation could get worse rapidly, as illustrated by the images below.

July 5, 2016, sea surface was as warm as 17.1°C / 62.7°F at green circle, i.e. 13.7°C / 24.7°F warmer than 1981-2011. 
These high sea surface temperature anomalies are the result of warmer water getting carried by the Gulf Stream below the sea surface of the Atlantic Ocean into the Arctic Ocean. The water carried into the Arctic Ocean is both warmer and saltier than the water at the surface, as the fresh cold meltwater forms a lid at the surface. At areas around Svalbard where the sea is rather shallow, the warmer water comes to the surface. These high anomalies thus indicate how much warmer the water now is that is entering the Arctic Ocean, as discussed in earlier posts such as this one.
image from previous post
The rapid recent rise in ocean heat is illustrated by above image, showing that oceans on the Northern Hemisphere in May 2015 through April 2016 were 0.93°C warmer than the 20th century average, whereas for the equivalent 2012 period the anomaly was merely 0.46°C. In other words, there now is more ocean heat, making the possibility of methane hydrates destabilization more threatening.

Meanwhile, the speed at which the Arctic is warming is changing the jet streams, as discussed by Paul Beckwith in the video below, following Paul's earlier video that's included in an earlier post.


There are many indications that changes to the climate are accelerating, causing extreme weather events to hit with increasing strength and intensity. Water vapor is a potent greenhouse gas and for each degree Celsius that temperatures rise, the atmosphere can hold 7% more water vapor, which will also lead to stronger storms such as cyclones. On the image below, typhoon Nepartak is approaching Taiwan, with wind speed as high as 103 mph or 165 km/h, and with cloud water as much as 9 kg per square m on July 7, 2016.

Nepartak approaching Taiwan on July 7, 2016, with wind speed as high as 103 mph or 165 km/h (left panel), and with cloud water as much as 9 kg per square m (right panel)
NASA image
According to NASA, very powerful storms near the center of Nepartak's circulation were found to be dropping rain at a rate of over 193 mm (7.6 inches) per hour. Tall thunderstorms called "hot towers" were found to reach heights of 17.0 km (about 10.5 miles).

The image on the right shows a thermal image of Typhoon Nepartak on July 7 at 17:45 UTC. The colder the cloud tops, the higher they are in the troposphere and the stronger the storms.

On July 7, 2016, at 1500 UTC, Nepartak's maximum sustained winds had reached 150 knots (172.6 mph/ 277.8 kph), generating waves as high as 48 feet (14.6 meters).

Strong storms can bring water vapor high up into the stratosphere, contributing to the formation of cirrus clouds that trap a lot of heat that would otherwise be radiated away, from Earth into space.

Altogether, the combined global temperature rise due to global warming and feedbacks could exceed 10°C or 18°F within a decade, as discussed in previous posts such as this one.

The situation is dire and calls for comprehensive and effective action as described in the Climate Plan.


Links

 The North Geographic Pole, the North Magnetic Pole and the North Geomagnetic Pole
http://wdc.kugi.kyoto-u.ac.jp/poles/polesexp.html

 Three Kinds of Warming in the Arctic
http://arctic-news.blogspot.com/2016/02/three-kinds-of-warming-in-arctic.html

 NASA: Napartak (July 9, 2016)
https://www.nasa.gov/feature/goddard/2016/napartak-nw-pacific-ocean

 Jim Pettit Climate Graphs
http://iwantsomeproof.com/3d/siv-ds-weekly-3d.asp


Monday, July 4, 2016

2016 Arctic Sea Ice Headed To Zero

The image below shows that Arctic sea ice extent on July 3, 2016, was 8,707,651 square km, i.e. less than the 8.75 million square km that extent was on July 3, 2012.


In September 2012, Arctic sea ice extent reached a record low. Given that extent now is only slightly lower than it was in 2012 at the same time of year, can extent this year be expected to reach an even lower minimum, possibly as low as zero ice in September 2016?

The ice this year is certainly headed in that direction, given that the sea ice now is much thinner than it was in 2012. The image below shows sea ice thickness on July 7, 2012, in the left-hand panel, and adds a forecast for July 7, 2016 in the right-hand panel.


Besides being thinner, sea ice now is also much more slushy and fractured into small pieces. The animation below shows that the sea ice close to the North Pole on July 4, 2016, was heavily fractured into pieces that are mostly smaller in size than 10 x 10 km or 6.2 x 6.2 miles. By comparison, sea ice in the same area did develop large cracks in 2012, but even in September 13, 2012, it was not broken up into small pieces.


One big reason behind the dire state the sea ice is in now is ocean heat. On July 2, 2016, sea surface near Svalbard (at the location marker by the green circle) was as warm as 16.7°C or 62.1°F, i.e. 13.5°C or 24.3°F warmer than 1981-2011. This gives an indication how much warmer the water is that is entering the Arctic Ocean.


As the sea ice disappears, less sunlight gets reflected back into space, resulting in additional warming of the Arctic Ocean. In October 2016, the sea ice will return, sealing off the Arctic Ocean, resulting in less heat being able to escape, at the very time the warmest water is entering the Arctic Ocean from the Atlantic and Pacific Oceans. The danger of this situation is that a large amount of heat will reach the seafloor and destabilize hydrates, resulting in huge abrupt methane releases that will further contribute to warming. When adding in further factors such as discussed e.g. at this earlier post, this adds up to a potential temperature rise of more than 10°C or 18°F compared to pre-industrial times in less than ten years time from now.

The situation is dire and calls for comprehensive and effective action, as described at the Climate Plan.


Saturday, June 25, 2016

Climate Feedbacks Start To Kick In More

Droughts and heatwaves are putting vegetation under devastating pressure while also causing wildfires resulting in deforestation and loss of peat at massive scale, contributing to the rapid recent rise in carbon dioxide levels. 


It will take a decade before these high recent carbon dioxide emissions will reach their full warming impact. Furthermore, as the world makes progress with the necessary cuts in greenhouse gas emissions, this will also remove aerosols that have until now masked the full wrath of global warming. By implication, without geoengineering occurring over the coming decade, temperatures will keep rising, resulting in further increases in abundance and intensity of droughts and wildfires.

Temperatures in the Arctic are rising faster than elsewhere. The image below shows that Arctic waters are now much warmer than in 2015. On June 22, 2016, sea surface near Svalbard was as warm as 13.8°C or 56.9°F (green circle), i.e. 11.6°C or 20.9°F warmer than 1981-2011.


High temperatures, as high as 34.1°C or 93.3°F at green circle, were recorded on July 1, 2016, over the Lena River which flows into the Laptev Sea, as illustrated by the image on the right [click on images to enlarge them].

Wildfires can release huge amounts of carbon dioxide (CO2), carbon monoxide (CO), methane and soot. The image below shows that on June 23, 2016, wildfires north of Lake Baikal caused emissions as high as 22,953 ppb CO and 549 ppm CO2 at the location marked by the green circle.

[ click on image to enlarge ]
The video below, created by Jim Reeve, shows an animation with carbon monoxide levels in May 2016.


As increasing amounts of soot from wildfires settle on its ice and snow cover, albedo decline in the Arctic will accelerate. In addition, heatwaves are causing rapid warming of rivers ending in the Arctic Ocean, further speeding up its warming and increasing the danger of methane releases from the seafloor of the Arctic Ocean.

As more energy stays in the biosphere, storms can be expected to strike with greater intensity. Rising temperatures will result in more water vapor in the atmosphere (7% more water vapor for every 1°C warming), further amplifying warming and resulting in more intense precipitation events, i.e. rainfall, flooding and lightning.
Record-breaking daily rainfall events around the world. From Lehmann et al. 
Recently, West Virginia got hit by devastating flooding, killing at least 26 people and causing evacuation of thousands of people and a huge amount of damage. Flooding can also cause rapid decomposition of vegetation, resulting in strong methane releases, as illustrated by the image below showing strong methane presence (magenta color) at 39,025 ft or 11.9 km on June 26 (left panel), as well as at 44,690 ft or 13.6 km on June 27 (right panel).

[ click on image to enlarge ]
Furthermore, plumes above the anvils of severe storms can bring water vapor up into the stratosphere, contributing to the formation of cirrus clouds that trap a lot of heat that would otherwise be radiated away, from Earth into space. The number of lightning strikes can be expected to increase by about 12% for every 1°C of rise in global average air temperature. At 3-8 miles height, during the summer months, lightning activity increases NOx by as much as 90% and ozone by more than 30%.

In conclusion, feedbacks are threatening to cause runaway warming, potentially making temperatures rise by more than 10°C or 18°F within a decade. Already now, melting ice sheets are changing the way the Earth wobbles on its axis, Nasa says. As Paul Beckwith discusses in the video below, changes are also taking place to the jet streams.


The danger is that changes to the planet's wobble will trigger massive earthquakes that will destabilize methane hydrates and result in huge amounts of methane abruptly entering the atmosphere, as illustrated by the image below.

Have we lost the Arctic? It looks like Earth no longer has two poles, but instead has turned into a Monopole, with only one pole at Antarctica. On June 29, 2016, Arctic water (sea surface) was as warm as 15.8°C (60.5°F), or 13°C (23.4°F) warmer than 1981-2011. Meanwhile, surface temperatures over Antarctica that day were as low as -66.6°C (-87.8°F).
The situation is dire and calls for comprehensive and effective action as described in the Climate Plan.


Links

 Feedbacks in the Arctic
http://arctic-news.blogspot.com/p/feedbacks.html

 Wildfire Danger Increasing
http://arctic-news.blogspot.com/2016/05/wildfire-danger-increasing.html

 Arctic Climate Records Melting
http://arctic-news.blogspot.com/2016/05/arctic-climate-records-melting.html

 Ten Degrees Warmer In A Decade?
http://arctic-news.blogspot.com/2016/03/ten-degrees-warmer-in-a-decade.html

 Arctic Sea Ice gone by September 2016?
http://arctic-news.blogspot.com/2016/05/arctic-sea-ice-gone-by-september-2016.html

 February Temperature
http://arctic-news.blogspot.com/2016/03/february-temperature.html

 International Energy Agency (IEA)
http://www.iea.org/

 National Oceanic and Atmospheric Administration (NOAA)
http://www.noaa.gov/

 Projected increase in lightning strikes in the United States due to global warming, by Romps et al. (2014)
http://science.sciencemag.org/content/346/6211/851

 Impacts of anthropogenic and natural NOx sources over the U.S. on tropospheric chemistry, by Zhang et al. (2003)
http://www.pnas.org/content/100/4/1505.abstract

 Wildfires Rage in Siberia, NASA June 30, 2016, images acquired June 29, 2016
http://earthobservatory.nasa.gov/IOTD/view.php?id=88284

 Melting ice sheets changing the way the Earth wobbles on its axis, says Nasa
https://www.theguardian.com/environment/2016/apr/09/melting-ice-sheets-changing-the-way-the-earth-wobbles-on-its-axis-says-nasa

 Record-breaking heavy rainfall events increased under global warming, by Lehmann et al. (2015)
https://www.pik-potsdam.de/news/press-releases/record-breaking-heavy-rainfall-events-increased-under-global-warming

 'Thousand-year' downpour led to deadly West Virginia floods (July 8, 2016)
https://www.climate.gov/news-features/event-tracker/thousand-year-downpour-led-deadly-west-virginia-floods


Friday, June 17, 2016

Ocean Heat Overwhelming North Atlantic

Arctic sea ice extent on June 19, 2016, was at a record low for the time of the year, as the (updated) image below shows.

[ image from JAXA ]
Not only is Arctic sea ice extent at record low for time of year, the sea ice is also rapidly getting thinner, more fractured, lower in concentration and darker in color. 

[ Cracks in sea ice north of Greenland on June 19, 2016, created with Arctic-io image ]
On the morning of June 20, 2016, strong methane releases were recorded over the water north of Greenland, as well as east of Greenland, as illustrated by the image below.

The image below shows that on the morning of June 20, 2016, mean global methane levels had increased be several parts per billion over a large altitude range, compared to the two previous days. Methane levels at selected altitudes on days in July 2015 and December 2015 are added for reference.
[ click on images to enlarge ]
Temperatures in the Arctic are rising, as illustrated by the image below, showing that on June 19, 2016, temperatures were as high as 31.4°C or 88.4°F over the Mackenzie River (green circle) which ends in
the Arctic Ocean (and thus warms up the Arctic Ocean there).


On June 20, 2016, the Sun will reach its highest point (Solstice), and the Arctic will have 24 hours sunlight, i.e. on the Arctic Circle (latitude 66.56° north) or higher. The Arctic is about 20,000,000 square km (7,700,000 square miles) in size and covers roughly 4% of Earth's surface. Insolation during the months June and July is higher in the Arctic than anywhere else on Earth, as illustrated by the image below, by Pidwirny (2006).


Sea surface temperature near Svalbard was as high as 55°F (or 12.8°C, at the green circle) on June 14, 2016, an anomaly of 19.6 °F (or 10.9°C) from 1981-2011, as illustrated by the image below.


[ click on images to enlarge ]
Above image, created with nullschool.net, further shows that the cold lid that had been growing so prominently in extent over the North Atlantic over the past few years, has shrunk substantially. By comparison, the cold area over the North Pacific has grown larger. This is further confirmed by the image on the right, created with NASA maps and showing ocean temperature anomalies for May 2016.

Plenty of meltwater has run off from Greenland in 2016, as illustrated by the NSIDC.gov image on the right. The run-off from Alaska and Siberia into the Pacific seems less by comparison than the run-off into the North Atlantic. So, how could it be that the cold area in the North Pacific has grown larger than the cold area in the North Atlantic?
[ click on images to enlarge ]

Could there be another factor influencing the size of these cold areas in the North Atlantic and the North Pacific?

The image below, created with NOAA images, gives a comparison between the situation on June 1, 2015 (top), and June 1, 2016 (bottom), showing anomalies from 1961-1990.