Sunday, December 15, 2013

Methane emerges from warmer areas

As the year draws to a close, it's time to review where warming has occured most strongly in 2013. Surface temperature anomalies in November 2013 were 0.77°C, the highest global November anomalies on record. In November 2013, high temperature anomalies occurred in the Arctic, well over 9°C north and south of Novaya Zemlya.

Indeed, global warming is hitting the Arctic particularly hard, and some models have underestimated the pace at which this is occuring. Most heat goes into the oceans, which - due to the Gulf Stream - contributes to accelerated warming in the Arctic, where also less monitoring takes place than over land. Stefan Rahmstorf, Co-Chair of Earth System Analysis at the Potsdam Institute for Climate Impact Research, says at RealClimate:
new study by British and Canadian researchers shows that the global temperature rise of the past 15 years has been greatly underestimated. The reason is the data gaps in the weather station network, especially in the Arctic. If you fill these data gaps using satellite measurements, the warming trend is more than doubled in the widely used HadCRUT4 data.
Where did warming occur most strongly in 2013? The red/orange areas on the image below shows surface temperature anomalies of more than 2°C for the year from December 13, 2012, to December 12, 2012.


As the image shows, temperature anomalies have hit Earth most strongly in the cryosphere, i.e.
- in Antarctica, as discussed at this post;
- on the Qinghai-Tibetan Plateau, as earlier discussed at this post;
- in the Arctic, as discussed below.

Over the past 90 days, the Arctic Ocean has shown surface temperature anomalies of over 5°C and in some spots over 8°C.


Looking at anomalies over longer periods can mask the occurrence of much higher anomalies on individual days. As an example, temperature anomalies of over 20°C were recorded over a large part of the Arctic Ocean on November 17, 2013. 


Baffin Bay, west of Greenland, has until now received little attention. High temperature anomalies over the past year show up on the top image. These high temperatures are the more striking given that a cold sea current runs through Baffin Bay, as shown on the image below. 
Methane has emerged strongly from areas that have warmed most in 2013. In August 2013, high concentrations of methane showed up over Siberia. High methane releases have further occurred in all three parts of the cryosphere mentioned above, i.e. from the heights of Antarctica, as discussed at this post, on the Qinghai-Tibetan Plateau, as earlier discussed at this post, and in the Arctic, as discussed in many posts at the Arctic-news blog.

Huge methane concentrations have featured over Baffin Bay recently. The animation below shows huge methane emissions emerging from Baffin Bay on December 1-2, 2013. The power behind these methane releases is strong enough to make it difficult for thicker ice to form in Baffin Bay. The animation below shows an area marked by a red rectangle where it looks like the water would have been covered with thicker ice, had there not been so much methane bubbling up in the area.


This area with very thin ice in Baffin Bay is further illustrated in the Naval Research Laboratory 30-day Arctic sea ice thickness animation below.


This constitues yet another feedback, i.e. methane bubbling up from the seafloor of the Arctic Ocean with a force strong enough to prevent sea ice from forming in the area. 


Sunday, December 8, 2013

CLIMATE REPORT'S HUGE OMISSION OBSCURES FULL DANGER

by Gary Houser

CLIMATE REPORT'S HUGE OMISSION OBSCURES FULL DANGER:
Grassroots Must Insist IPCC Include Massive Permafrost Carbon


"Across two decades and thousands of pages of reports, the world's most authoritative voice on climate science has consistently understated the rate and intensity of climate change and the danger those impacts represent, say a growing number of studies .......   The speed and ferocity of climate change are outpacing IPCC projections on many fronts, including CO2 emissions, temperature rise, continental ice-sheet melt, Arctic sea ice decline, and sea level rise. 
The IPCC’s overly conservative reading of the science ..... means governments and the public could be blindsided by the rapid onset of the flooding, extreme storms, drought, and other impacts associated with catastrophic global warming."
                              
—  Scientific American, "Climate Science Predictions Prove Too Conservative", Dec.6, 2012    [1]
The primary scientific report used by governments of the world to guide their policies on climate has failed to convey the full danger being created by release of greenhouse gases into the atmosphere. By focusing on human-generated carbon, the Intergovernmental Panel on Climate Change (IPCC) has ignored an even more threatening process now being triggered by those emissions. Rapid warming in the Arctic - where temperatures are rising twice as fast as the global rate - is thawing an incomprehensibly vast stockpile of nature's own carbon which has been trapped in ice for millenia. This threat is described in a new mini-documentary (entitled "Last Hours"  [2] )the importance of which has been highlighted by leaders on the climate issue such as Al Gore.   [3]  

The scale of this threat is mind-boggling. There is over three times more heating power stored in this "permafrost" than that which has been caused by human greenhouse gas emissions since the beginning of the industrial age - and this refers only to that located on land (as opposed to the coastal seabeds). [4]  This stockpile includes super greenhouse gas methane, acknowledged even by the IPCC itself to be a stunning 86 times more potent than carbon dioxide as a warming agent over 20 years (with climate-carbon feedbacks). [5]   
Despite a formal appeal by scientists specializing in permafrost study that IPCC issue a special assessment drawing attention to this tremendous danger  [6], the recently released report neglected to do so. The French news agency Agence France-Presse reported that due to bureaucratic delays and a log-jam in the processing of cutting edge data, 
"the cut-off date meant the authors were unable to evaluate recent, but very worrying, studies that say methane trapped in ice-bound coasts in northeast Siberia is being released as seas warm, thus putting the greenhouse effect into higher gear."   [7]

This massive failure by IPCC means that governments world-wide have not been given adequate warning about how preciously little time may be left to prevent the crossing of a tipping point leading to unstoppable global catastrophe. By not addressing the unique consequences brought on by accelerated Arctic warming, the IPCC is in fact skewing the picture that needs to be presented.
"Arctic and alpine air temperatures are expected to increase at roughly twice the global rate .... A global temperature increase of 3 degrees Celsius means a 6 degrees Celsius increase in the Arctic, resulting in an irreversible loss of anywhere between 30 to 85 percent of near-surface permafrost."   [8]
Even worse, more cutting edge science (also not included in the IPCC report) reveals additional unsettling developments. Exposure to sunlight appears to speed up the rate of permafrost thaw: "...sunlight increases bacterial conversion of exposed soil carbon into carbon dioxide gas by at least 40 percent compared to carbon that remains in the dark." [9]   This thaw on land is being matched in the shallow coastal seabeds. Natalia Shakhova - who has helped lead numerous fact-finding missions along the coast of Siberia - reports that releases there are "now on par with the methane being released from the arctic tundra."  [10]  She also warns that these releases can be larger and more abrupt than those resulting from decomposition on land.

As previously frozen methane vents to the atmosphere, the warming it causes can thaw and release even more. This "feedback" is capable of escalating into a "runaway" chain reaction that humanity would be helpless to stop. This is the same methane that some scientists point to as a major factor in the most sweeping mass extinctions in earth's history - the PETM and the end-Permian, the latter of which decimated  90 percent of all life forms.   Whether this association can be absolutely proven or not (the scientific basis for its connection to the Permian is explored in the BBC documentary "The Day Earth Nearly Died"  [11] )no one can credibly deny the immense power of this greenhouse gas. 

By omitting this crucial information, policymakers are being dangerously lulled into believing there is more time to act - and less urgency - than what is in fact the case. At precisely the moment when the world needs the most unambiguous and emphatic warning from the scientific community - a moment which may not afford humanity any second chance to recover and correct course - it is nowhere to be found.  


Methane plumes rising from the seafloor
Over the years, the IPCC has been wrong numerous times in its projections. According to Scientific American:
"In the 2007 report, the IPCC concluded the Arctic would not lose its summer ice before 2070 at the earliest. But the ice pack has shrunk far faster than any scenario scientists felt policymakers should consider; now researchers say the region could see ice-free summers within 20 years."  [12]  
As the opening quote states, this pattern has persisted regarding several aspects of the issue. Given this history, it is not surprising the current IPCC report is again "behind the times" on the very day it is published.  In the short time following its release, a large number of experts on sea level rise are already saying that the IPCC projections are too cautious and conservative.  [13] 

Originally created with a mission to provide government bodies with un-biased scientific facts on climate disruption in order to inform the process of policymaking, the IPCC process has become seriously impaired by a combination of internal problems and outside pressure. The result has been the production of reports that not only fail to keep up with the cutting edge of the science itself but are also tainted by a bias toward overly conservative assessments. 

The same key article in Scientific American describes the internal logjam: 
"Such assessments typically take five to seven years to complete in a slow, bureaucratic process: ......... a summary for policymakers, condensing the science even further, is written and subjected to a painstaking, line-by-line revision by representatives from more than 100 world governments – all of whom must approve the final summary document."   [14]  
Materials from scientists are only accepted for consideration after they have been peer-reviewed and published in a scientific journal. This process in itself can take up to three years. Then another requirement is that such materials cannot be submitted beyond an early cut-off date. The goal of instituting an orderly process is laudable, but the severe problem is that the pace of climate disruption is most assuredly accelerating. If vital information at the cutting edge of these frightening changes cannot make it through these hurdles in time, there is a huge gap of five or six years before it can be integrated into the next report.  

 A key example would be the definitive paper documenting the land-based permafrost feedbacks which asks IPCC to issue a special assessment. Not only was this request ignored, but this documentation was not even considered as it was published after the cut-off date. 

The current IPCC report is quite intimidating at over 2000 pages long. A solution to both problems of timeliness and excessive length is to make the IPCC process more nimble by tackling the various key components of climate disruption individually rather than combining them all into one ponderous document. An example would be a report strictly limited to Arctic issues. As the most rapidly warming region on earth - with profound impact on the global climate - it is entirely deserving of special attention.

The second major problem is that when the IPCC was first set up, a provision was inserted which provides government entities the so-called "right" to review and approve the official Summary for Policymakers - the most important section. As the incredibly wealthy fossil fuel lobby holds great power over many governments, this provision provides an opening to pressure those governments into weakening the language.  As such power was actively used to weaken segments of the last Summary in 2007, [15]  it cannot be ruled out that such was used again. Scientific research should not be censored by political entities, a point made eloquently by British expert on feedback dynamics David Wasdell:
"What comes out is that which is 'acceptable' ...... from science that is about six years out of date, and that becomes the basis for negotiation and decision-making. It is grossly inappropriate....... There are many pressures ..... not least the enormous profits that continue to be made from fossil fuels." [16]  
This provision should be put up for debate and stricken.    

fish skeleton on parched soil, credit: Will Sherman
There is a corrective action which can be taken. Precedent already exists for the IPCC issuing a "Special Report" on aspects of the issue it considers worthy of special attention. A recent example is one on the increasing frequency of extreme weather events. There is a powerful case behind the need to release a Special Report on the threat from permafrost thaw in the Arctic. But an institution this size does not move unless there is a strong and coordinated campaign aimed at raising the issue and applying some "push". All the grassroots environmental groups that have led the climate movement are now called to recognize the dire need to integrate this frightening issue into the framework of all thinking and strategizing. If this is not done, and governments around the world continue to ignore it, there is a high likelihood that all other climate campaigns will fail. 

Keystone XL Pipeline protest - photo taken Feb 13, 2013 - from: flickr.com/photos/tarsandsaction/ 
The valiant effort to oppose the tar sands pipeline must be continued. But this movement must recognize that the climate threats are not presenting themselves in single file - one at a time. Several dangers are simultaneously bearing down on humanity. The laws of physics driving these threats will not pause for political stagnation. If the governments of the world fail to see the sleeping giant awakening in the Arctic and adjust their collective sense of urgency accordingly, then it appears our fate is sealed. The laws of physics will run their course. We owe it to those generations that would inherit a devastated planet to do better than that.      

The prospect of humanity being blindsided by a tremendous - and perhaps even fatal - blow is unthinkable. There is no "Planet B" to turn to if the conditions necessary to support life on our present planet are wiped out. Our society places great trust in the scientific community. Faced by any threat of this magnitude, our assumption is that our scientists will fulfill their moral obligation, act on the precautionary principle, and give us ample warning. In this case, that trust is being violated. It is therefore up to concerned citizens everywhere to speak out, hold them accountable,  and insist that governments receive the warning that is needed. This dangerous and potentially suicidal omission must not be allowed to stand.  

Who stands up for the children? - screenshot from children against climate change protest video
"The eyes of the future are looking back at us and they are praying for us to see beyond our own time. They are kneeling with hands clasped that we might act with restraint, that we might leave room for the life that is destined to come."  — Terry Tempest Williams [17]


Gary Houser is a public interest writer and documentary producer focusing on climate issues and the "sleeping giant" of Arctic methane in particular, and based in Ohio in the U.S.  He is seeking to network with others with similar concerns re: permafrost thaw who work in the U.S. context. Current projects are:  persuading major enviro / climate groups to integrate Arctic permafrost thaw as a high priority issue into their campaigns, a specific grassroots campaign to pressure IPCC toward a Special Report, public hearing on Arctic issues in the U.S. Senate, production and broadcast of Arctic permafrost thaw documentary on one of the national TV networks in the U.S.   He can be contacted at:  garyhouser4@gmail.com   


SOURCE LINKS:  

  1. http://www.scientificamerican.com/article.cfm?id=climate-science-predictions-prove-too-conservative
  2. www.lasthours.org
  3. Press release: Last Hours Film Raises Issue Of Global-Warming-Induced Extinction ...
  4. Is Arctic Permafrost the "Sleeping Giant" of Climate Change? - NASA ...
  5. New IPCC report released in 2013, at IPCC AR5 WGI Table 8.7
  6. Press Release - National Snow and Ice Data Center (NSDIC)
  7. Compiling latest climate report took 3 years; critics say that's too long ...
  8. NSIDC Press Room: Press Release: UNEP report urges ...
  9. Thawing Permafrost May Be 'Huge Factor' in Global Warming ...
  10. Arctic seafloor methane releases double previous estimates
  11. "The Day Earth Nearly Died" (BBC documentary) : http://youtu.be/4dhNEAu4wDo
  12. http://www.scientificamerican.com/article.cfm?id=climate-science-predictions-prove-too-conservative
  13. Experts say the IPCC underestimated future sea level rise ...
  14. http://www.scientificamerican.com/article.cfm?id=climate-science-predictions-prove-too-conservative
  15. Washington Post: U.S., China Got Climate Warnings Toned Down
  16. Video: Envisionation Interview: David Wasdell On the IPCC & Scientific ...
  17. Quote by Terry Tempest Williams: The eyes of the ... - Goodreads


    Thursday, December 5, 2013

    The time has come to spread the message

    [ click on image to enlarge ]
    Above image shows methane rising from the seafloor of the Arctic Ocean on December 3, 2013, and entering the atmosphere, reaching levels as high as 2425 parts per billion (ppb). Last month, on November 9, 2013, methane reached levels as high as 2662 ppb.

    The image below gives an idea of the height of this level, compared to historic levels, and how fast levels of methane (CH4) have been rising compared to levels of two other greenhouse gases, i.e. carbon dioxide (CO2) and nitrous oxide (N2O).

    While CO2 levels are in ppm and CH4 in ppb, they are directly comparable, in that a CH4 cloud, 5 years after its abrupt
    release into the atmosphere over the Arctic Ocean, may have shrunk to 20% of its original size, yet will over those 5 years
    have exercized local warming more than 1000 times stronger than the global warming potency of the same mass of CO2.  
    Above graph shows the dramatic rise in the levels of greenhouse gases over the past few centuries. Almost half of all global warming results from a 3 Gt rise in methane since the 1750s, as described in the recent post Quantifying Arctic Methane.

    Why worry about methane rising from the seafloor in the Arctic? Sediments underneath the Arctic Ocean hold vast amounts of methane. Just one part of the Arctic Ocean alone, the East Siberian Arctic Shelf (ESAS, see map below), holds up to 1700 Gt of methane. A sudden release of just 3% of this amount could add over 50 Gt of methane to the atmosphere, and experts consider such an amount to be ready for release at any time.


    Just let those figures sink in for a moment. Total methane burden in the atmosphere now is 5 Gt. The 3 Gt that has been added since the 1750s accounts for almost half of all global warming. The amount of carbon stored in hydrates globally was in 1992 estimated to be 10,000 Gt (USGS), while a more recent estimate gives a figure of 63,400 Gt (Klauda & Sandler, 2005). The ESAS alone holds up to 1700 Gt of methane in the form of methane hydrates and free gas contained in sediments, of which 50 Gt is ready for abrupt release at any time.

    Imagine what kind of devastation an extra 50 Gt of methane could cause. Imagine the warming that will take place if the methane in the atmosphere was suddenly multiplied by 11. Whiteman et al. recently calculated that such an event would cause $60 trillion in damage. By comparison, the size of the world economy in 2012 was about $70 trillion.

    Smaller releases of methane in the Arctic come with the same risk; their huge local warming impact threatens to further destabilize sediments under the Arctic Ocean and trigger further methane releases, as illustrated by the image below.


    Victor Hugo
    In the light of these figures, there is no question that this is important and that dramatic changes are needed to reduce such dangers. Indeed, the only question is what kind of changes are needed.

    The challenges may seem huge, the opposition to change may seem formidable. Yet despite the saber rattling of armies, and despite covert efforts by powerful conglomarates and vested interests to resist change, common sense will prevail, because nothing is as strong as an idea whose time has come. [“On résiste à l'invasion des armées; on ne résiste pas à l'invasion des idées.” -- From: Histoire d'un crime, Victor Hugo.]

    As the prospect of climate catastrophe becomes ever more apparent and as the political imperative to take comprehensive and effective action becomes ever more urgent and obvious, this message will spread and the winds of change will grow stronger day after day. Be part of the solution and spread the message!


    Thursday, November 28, 2013

    Arctic Methane Impact

    The image below covers a period of just over one day. On November 26, 2013, peak readings were as high as 2392 ppb.


    The green circle highlights an area with high methane levels just north of Greenland. This methane likely originates from hydrates along the fault line that crosses the Arctic Ocean. As the Naval Research Laboratory animation below shows, sea ice in that area is rather thick. How it is possible for the methane to appear there? The answer must be, it seems, that there is so much movement in the sea ice in this area, that there are many cracks through which the methane can rise.


    Above animation shows how a huge part of the sea ice, meters thick, is pushed along the edges of Greenland into the Atlantic Ocean, as a result of strong winds, as also illustrated by the animation below.


    Methane has now been showing up prominently over the entire Arctic Ocean for more than a month and it doesn't look like this situation is coming to an end soon. The animation shows methane over the Arctic Ocean over a period of six days, with each frame covering a period of one day.


    What is the impact of all this methane on temperatures over the Arctic? The NOAA image below shows surface temperature anomalies for a 30-day period.


    When temperatures are averaged over longer periods, peaks will obviously show up less severe. Yet, on above image an area shows up in the Arctic where anomalies have averaged 15 degrees Celsius or more over this 30-day period.


    When looking at individual days, anomalies of over 20 degrees Celsius can show up, on above image over quite a large area. While the weather can vary a lot and depends on a lot of factors, there is no doubt that the methane cloud hanging over the Arctic Ocean will have contributed to such anomalies. Since this methane isn't just going away soon, this spells bad news for what is ahead in the Arctic.


    And while most efforts to contain global warming focus on ways to keep global temperature from rising by more than 2°C, a polynomial trendline already points at global temperature anomalies of 5°C by 2060. Even worse, a polynomial trend for the Arctic shows temperature anomalies of 4°C by 2020, 7°C by 2030 and 11°C by 2040, threatening to cause major feedbacks to kick in, including albedo changes and methane releases that will trigger runaway global warming that looks set to eventually catch up with accelerated warming in the Arctic and result in global temperature anomalies of 20°C+ by 2050.


    Sunday, November 24, 2013

    Quantifying Arctic Methane

    The paper 'Ebullition and storm-induced methane release from the East Siberian Arctic Shelf', was published in the journal Nature Geoscience on November 24, 2013.

    The paper is dedicated “to the memory of the crew of Russian vessel RV Alexei Kulakovsky”, the 11 people who died when their tugboat perished in efforts to assist the scientists who were measuring methane from a fishing boat.

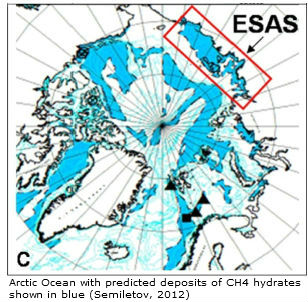
    The research team used methods including drilling into the seabed of the Laptev Sea and sonar to analyse methane releases in the water, seeking to quantify the significant amounts of methane that are bubbling up from the sea bed in the East Siberian Arctic Shelf (ESAS, rectangle on image below), the area with shallow seas north of Siberia covering some 810,800 square miles (2.1 million square kilometers). By comparison, the United States (land and water) covers an area of nearly 10 million square kilometers.

    “We have proven that the current state of subsea permafrost is incomparably closer to the thaw point than terrestrial permafrost, and that modern warming does contribute to warming the subsea permafrost,” says Natalia Shakhova, adding that an increase in storminess in the Arctic would further speed up the release of methane.

    The scientists estimate, on the basis of the sonar data, that “bubbles escaping the partially thawed permafrost inject 100–630 mg methane square meters daily into the overlying water column”, and suggest that “bubbles and storms facilitate the flux of this methane to the overlying ocean and atmosphere, respectively”.

    Some 17 teragrams (Tg or Mt) of methane escapes annually from the ESAS, said Natalia Shakova, lead study author and a biogeochemist at the University of Alaska, Fairbanks. This is an upgrade from the earlier estimate of 8 Tg of annual outgassing from the ESAS (Shakhova et al. 2010).

    While including a reference to this earlier paper (Shakhova et al. 2010), the IPCC did give much lower estimates for emissions from all hydrates globally and from permafrost (excl. lakes and wetlands), i.e. 6 and 1 Tg per year, respectively.

    And by comparison, IPCC estimates for all global methane emissions from manmade and natural sources go from 526 Tg per year to 852 Tg per year, of which 514 to 785 Tg per year is broken down (mostly by hydroxyl).

    Sadly, as discussed in an earlier post, the IPCC has decided NOT to warn people about the danger that methane from hydrates will lead to abrupt climate change within decades. Yet, when entering the data by Shakhova et al. in a spreadsheet, a linear trendline (green line on image below) shows methane release in the ESAS reaching 20 Tg by 2013 and 26 Tg by 2015.


    An exponential trendline (red/blue line) shows methane release in the ESAS reaching 22 Tg by 2013 and 36 Tg by 2015. Extending that same exponential trendline further into the future shows methane release in the ESAS reaching 2 Gt by the year 2031 and 50 Gt by the year 2043.


    Note that accumulated totals over the years will be much higher than the annual release. While the IPCC gives methane a perturbation lifetime of 12.4 years, this methane will persist in the Arctic for much longer because its release is concentrated in the Arctic where hydroxyl levels are also very low.

    Globally, IPCC/NOAA figures suggest that abundance of methane in the atmosphere currently (2013) is 1814 parts per billion (ppb), rising with 5 or 6 ppb annually, and that this rise is caused by a difference of 8 Tg between the methane emitted (548 Tg, top-down estimate) and broken down annually (540 Tg, top-down estimate). It is also worth noting that the IPCC has increased methane's global warming potential to 86 over 20 years with climate-carbon feedbacks, while there are reasons to assume that methane's impact, especially short-term and in case of large abrupt releases in the Arctic, is even stronger. Furthermore, the IPCC now gives methane a Radiative Forcing (RF) of 0.97 W/m-2 (up from 48 W/m-2 in 2007 and relative to 1750), as illustrated by the image below.


    According to the IPCC, methane levels in 1750 and 2011 were 722 ppb and 1803 ppb, respectively. The total global methane burden is estimated to be about 5 Gt, i.e. 5 petagrams (Pg) or 5,000 Tg. A back-of-envelope calculation sugests that the methane burden in 1750 was 5 Gt x (722 : 1803) = 2 Gt. Furthermore, methane's 0.97 W/m-2 RF is 42% of the total RF 2.29 W/m-2. Therefore, the 3 Gt of methane that has been added to the atmosphere since 1750 is responsible for almost half of all the global warming since that time.

    For now, the IPCC's estimated annual increase in global methane levels may seem small, but this figure appears to be based on low-altitude data collected over the past few decades. The total methane burden may already be rising much more rapidly, also because methane is rising in the atmosphere, increasing the burden especially at higher altitudes, as evidenced by the increasing occurence of noctilucent clouds. In other words, the 8 Tg estimate may reflect older data related to changes in lower-altitude measurements only, but the total methane burden may well be rising much more rapidly due to increases at higher altitudes. Further analysis comparing satellite data at different altitudes over the years could verify this.

    An earlier post estimated that as much as 2.1 Mt (or 2.1 Tg) of methane could have been released abruptly end 2011. If you compare the animation of that earlier post with the recent animation, then current abrupt releases from the sea floor of the Arctic Ocean appear to be even higher.

    As said, methane releases from the Arctic Ocean may for now seem small and may not yet make global temperatures rise much, but nonetheless the methane cloud hanging over the Arctic is contributing to warming locally. Combined with the increased likelyhood of extreme weather and rapid loss of ice and snow cover in the Arctic, this could make water temperatures in the Arctic Ocean rise even further, causing further destabilization of methane hydrates. Furthermore, the mechanical force of methane release from hydrates (rapidly expanding 160 times in volume) itself can also contribute to hydrate destabilization. Seismic activity could also lead to destabilization. Indeed, there are many factors that could contribute to exponential rise of methane release from the Arctic Ocean, as discussed in the post on methane hydrates, which calls for comprehensive and effective action, such as discussed at the Climate Plan blog.


    References

    Ebullition and storm-induced methane release from the East Siberian Arctic Shelf, by Natalia Shakhova, Igor Semiletov, Ira Leifer, Valentin Sergienko, Anatoly Salyuk, Denis Kosmach, Denis Chernykh, Chris Stubbs, Dmitry Nicolsky, Vladimir Tumskoy & Örjan Gustafsson (2013)
    http://www.nature.com/ngeo/journal/vaop/ncurrent/full/ngeo2007.html

    Arctic storms speed up release of methane plumes, by Fred Pearce
    http://www.newscientist.com/article/dn24639-arctic-storms-speed-up-release-of-methane-plumes.html

    Twice as Much Methane Escaping Arctic Seafloor, by Becky Oskin
    http://www.livescience.com/41476-more-arctic-seafloor-methane-found.html

    Extensive methane venting to the atmosphere from sediments of the East Siberian Arctic shelf, by Natalia Shakhova, Igor Semiletov, Anatoly Salyuk, Vladimir Yusupov, Denis Kosmach, and Örjan Gustafsson, in: Science, 327, 1246-1250 (2010).
    http://www.sciencemag.org/content/327/5970/1246.abstract

    On carbon transport and fate in the East Siberian Arctic land–shelf–atmosphere system, by Semiletov et al. (2012)
    http://iopscience.iop.org/1748-9326/7/1/015201

    Intergovernmental Panel on Climate Change (IPCC), AR5 Working Group 1
    http://www.climatechange2013.org/


    Thursday, November 21, 2013

    High Methane Levels all over Arctic Ocean

    High levels of methane were recorded all over the Arctic Ocean on November 19, 2013, as illustrated by the image below. The image also shows that most methane was present over the fault line that crosses the Arctic Ocean (as also indicated on the inset).

    [ Click on image to enlarge ]
    A recent post described that more methane may actually be present closer to the North Pole than IASA images may indicate. This because measurements can be obscured by clouds. If no data are recorded over a certain area, no methane levels will show up on images for the respective area. This was the case on November 17, 2013, when the Arctic Ocean was quite cloudy, and little or no data were recorded for the center of the Arctic Ocean.

    On November 19, 2013, the sky was much clearer, resulting in a lot of data from the center of the Arctic Ocean, as also illustrated by the image below.

    In conclusion, high methane levels can actually be present all over the Arctic Ocean, even when images only show high levels in some areas.

    An earlier post described how the sea ice can act as a shield, especially when the ice is more than one meter thick.

    How does this rhyme with the above image? The November 19, 2013, Naval Research Laboratory image on the right shows that the sea ice was meters thick in some locations where methane shows up on the top image.

    So, is methane actually rising from the seafloor of the entire Arctic Ocean, perforating even the thickest ice and entering the atmosphere all across the Arctic Ocean? Or, if thick sea ice does act as a shield, how did methane appear all over the Artic Ocean in such huge quantities?

    The images on the right indicate that the methane may actually only rise from the seafloor in a few locations.

    As the top image on the right says, the Coriolis Effect can make methane over the Laptev Sea end up over Canada a few days later. So, methane may not be perforating the sea ice in the north of Canada, but may instead originate from elsewhere in the Arctic.

    The animation underneath shows methane readings from November 9 to 19, 2013, with each of the 20 frames covering a period of 24 hours and with frames following each other up 12 hours after each other. As the animation shows, it looks like methane is predominantly entering the atmosphere at specific locations, most notably along the fault line that crosses the Arctic Ocean.

    It may well be that this methane ends up all the way in Baffin Bay, to the left of Greenland. Since the Greenland ice sheet is 3 kilometers (1.9 miles) thick, this may form a natural barrier that keeps the methane there, also helped by winds rising vertically from Baffin Bay to well above Greenland's mountains. Methane may also be traveling under the sea ice, all the way from the Gakkel Ridge and the Laptev Sea right to Baffin Bay.

    On the other hand, it could also be that hydrates underneath the sea bed of Baffin Bay itself have become destabilized and that, since the ice over Baffin Bay is rather thin, methane has no problem perforating the ice and is entering the atmosphere there in huge quantities.

    Either way, the end-conclusion is that the methane that is now showing up all over the Arctic Ocean, is rising from the seafloor, due to destabilization of sediments that hold huge amounts of methane in the form of free gas and hydrates. As warming in the Arctic continues to accelerate, the danger is that this will cause more methane to rise from the seafloor and that the methane itself will contribute to warming in the Arctic, in a deadly spiral set to cause abrupt climate change at a devastating scale.


    Tuesday, November 19, 2013

    Arctic Methane Release and Rapid Temperature Rise are interlinked

    The image below shows methane readings on November 17, 2013 p.m.

    [ click on image to enlarge ]
    Very high methane readings are present over the Laptev Sea, the East Siberian Sea and the Beaufort Sea. The situation may be even worse than what it seems at first glance. The pointed shape in the Laptev Sea doesn't imply low methane levels in that area. The IASI (Infrared Atmospheric Sounding Interferometer) instrument measuring methane only covers a certain width. The pointed shapes that show up on above image and the bottom inset, are areas where no measurements were taken, resulting from the way the polar-orbiting satellite circum-navigates the globe, as pictured on the top inset. These pointed shapes are visible as light-grey areas on the image below.

    Additionally, no data were available for the areas colored darker grey on above image. At lower altitudes, this absence of data can be due to mountains in the area. It can also be that measurements are obscured by clouds, in which case no data are visible for the respective area; again, this doesn't imply that no methane was present there.

    So, while there are no data for some areas in the Laptev Sea on Nov. 17, the conclusion must noretheless be that methane was actually present at very high levels all the way from the Laptev Sea to the East Siberian Sea. This conclusion is supported by data from earlier days, e.g. as shown in this post.

    Therefore, the situation in the Laptev Sea is worse that it looks at first glance and levels may actually have been even higher on Nov. 17 than the peak reading of 2304 ppb that was recorded on that day. Similarly, more methane may actually be present closer to the North Pole than is showing up on above images.

    Why methane is rising from the Arctic seabed

    For some time now, huge amounts of methane have been released from the seabed of the Arctic Ocean, reaching the atmosphere at levels of up to 2662 ppb (on November 9, 2013). What caused this? Before examining this further, let's first go back to what was said in an earlier post about warm water off the coast of North Anmerica.

    A dust storm approaches Stratford, Texas, in 1935. From: Wikipedia: Dust Bowl
    During the 1930s, North America experienced a devastating drought affecting almost two-thirds of the United States as well as parts of Mexico and Canada. The period is referred to as the Dust Bowl, for its numerous dust storms.

    Rapid creation of farms and use of gasoline tractors had caused erosion at massive scale.

    Extensive deep plowing of the virgin topsoil of the Great Plains in the preceding decade had removed the natural deep-rooted vegetation that previously kept the soil in place and trapped moisture even during periods of drought and high winds.

    So, when the drought came, the dust storms emerged. But what caused the drought?

    A 2004 study concludes that the drought was caused by anomalous tropical sea surface temperatures (SST) during that decade and that interactions between the atmosphere and the land surface increased its severity (see image above right with SST anomalies).

    As the above chart shows, SST anomalies in the days of the Dust Bowl were not greater than 1°C. It is in this context that the current situation in the Arctic must be seen. In 2013, SST anomalies of 5°C or more showed up in virtually all areas in the Arctic Ocean where the sea ice disappeared; some areas are exposed to sea surface temperature anomalies even higher than 8°C (14.4°F), as discussed in the post Arctic Ocean is turning red.


    As the above Naval Research Laboratory image shows, strong winds can push a lot of sea ice out of the Arctic Ocean. The resulting absence of sea ice can disrupt vertical sea currents that would otherwise cool the seabed. Furthermore, strong winds can boost warming of the seabed of the Arctic Ocean by mixing warm surface water down the vertical water column. Such feedbacks have been discussed in earlier posts such as the Diagram of Doom. Changes that take place in the Arctic can also cause extreme weather patterns elsewhere, as discussed in an earlier post on changes to the Polar Jet Stream.

    Indeed, events can be closely interlinked and the world is now stumbling from one extreme weather event into another. Moreover, things look set to get worse every year. And this can in turn make things even worse in the Arctic. Water off the coast of North America, after reaching 'Record Warmest' temperatures in July 2013, proceeded to travel to the Arctic Ocean, where it is now warming up the seabed.
    NOAA: part of the Atlantic Ocean off the coast of North America reached record warmest temperatures in July 2013
    Below, Malcolm Light explains:

    Pollution clouds pouring eastwards off the coast of Canada and the United States are the main culprits in heating the Gulf Stream as this region has the highest oceanic evaporation on Earth.


    While the mean speed of the Gulf Stream is 4 miles per hour (6.4 km/hour or 1.78 metres/second), the water slows down as it travels north.

    In the much wider North Atlantic Current, which is its North Eastern extension, water flows at about 0.51 metres/second (3.5 times slower), while the West Spitzbergen (Svalbard) current flows at about 0.35 metres/second (5 times slower).

    Consequently, it will take quite some time for the summer-heated Gulf Stream waters to reach the Laptev Sea.

    In addition, because the Gulf Stream does a closed circuit in the tropical Atlantic, passing close to West Africa (Canary Current) and returning back to the Gulf along the hurricane tracks (North Equitorial Current), it is able to continuously feed hot water into the North Atlantic Current over a very long time period.

    This explains why methane is continuously boiling off the subsea methane hydrates from the Eurasian Basin and Laptev Sea during September to November this year and will continue to be emitted past January 2014.

    How much will temperatures rise?

    The atmospheric temperature increase in Australia this year (0.22oC) indicates that in 10 years it will exceed 2.2oC and in 30 to 40 years, 6.6oC to 8.8oC.

    This is the same as the predicted temperature increase from the Arctic methane build up and will lead to total global deglaciation and our extinction by the middle of this century.

    There is in addition a delayed carbon dioxide and methane temperature anomaly of 12oC to 20oC.  The 20oC  methane delayed temperature anomaly is the same as the temperature anomaly of the hot clouds that have been blowing around the Arctic this year, indicating that the Arctic has almost caught up with the methane delayed global warming heating.

    The stage is therefore set for a giant firestorm, drought and sea level rise mostly caused by the uncontrolled build up of methane in the atmosphere due to the carbon dioxide induced global warming destabilization of the Arctic permafrost and subsea methane hydrates.

    So, what to do?

    The power, prestige and massive economy of the United States have been built on cheap and abundant fossil fuels and Canada is now trying to do the same. Will the US and Canada, in the short time frame we have left (3 decades), be able to eliminate their extreme carbon footprints? Note that Australia, Saudi Arabia and the United Arab Emirates have similar extreme carbon footprints as well. An additional problem is that reducing emissions from coal-fired power plants will also reduce sulfur emissions that currently mask the full wrath of global warming.

    A Comprehensive Climate Plan must include ways to reduce methane levels

    What we have got to do is eliminate as much of the atmospheric methane by whatever means we are able to devise,  to bring its concentration down to about 750 ppb. This level will eliminate the methane delayed temperature anomaly and give the massive industrial nations a little leaway to get their houses in order.

    All the scientific expenditure and ingenuity of the major industrial nations should be engaged in developing methods of breaking down atmospheric methane without burning it. Methods of increasing the tropospheric and stratospheric hydroxyl concentrations and using radio - laser systems such as the Alamo - Lucy projects and their applications to HAARP must be developed and tested with the utmost urgency as should local methods of converting carbon dioxide and methane via catalysts into other products. We have to get rid of this methane monster before it devours us all. A French group of scientists and engineers have started work on the Alamo-Lucy projects in Europe. If we fail to reduce the fast growing methane content of the atmosphere in the next few decades we are going to go the same way as the dinosaurs.

    I cannot emphasise more, how serious humanity’s predicament is and what we could do to try to prevent our certain extinction if we continue down the present path we are following. If we compare ourselves to the Titanic we are only moments away from hitting the iceberg.


    Three more images are added to further illustrate Malcolm Light's words. The above image highlights how much temperatures have been rising in the Arctic over the past few decades. In above image, anomalies are visualized by latitude, but are averaged by longitude globally, masking even higher anomalies that can be experienced at specific areas along the same longitude. At times, some areas in the Arctic do already experience anomalies of over 20°C, as also shown by the image below. 

    Finally, the image below, from a post at the methane-hydrates blog


    All this calls for comprehensive and effective action, as described at the Climate Plan blog


    Related

    - Causes of high methane levels over Arctic Ocean

    - Climate Plan

    - Horrific amounts of methane over Laptev Sea

    - Methane Levels going through the Roof

    - Unfolding Methane Catastrophe

    - Methane Release caused by Earthquakes

    - Temperature Rise

    - North Hole

    - The LUCY project

    - The Alamo Project