Thursday, May 2, 2013

No Planet B


By Andrew Glikson
Earth and paleo-climate science, Australian National University
IPCC Reviewer

The global CO2cide 400 ppm milestone

Figure 1. Mouna Loa Month ending May 1, 2013, from:  http://keelingcurve.ucsd.edu/


Figure 2. CO2 levels over the past 800,000,000 years, from:  http://keelingcurve.ucsd.edu/

Figure 3. Mouna Loa CO2 level 29 April, 2013 keelingcurve.ucsd.edu/ 
On the 29 April, 2013, NOAA recorded a CO2 level of 399.50 ppm, while some readings in April 2013 exceeded 400 ppm (Figures 1, 2 and 3, from: http://keelingcurve.ucsd.edu/), signifying a return to atmosphere conditions of the Pliocene (5.2 – 2.6 million years ago).

This followed a rise from 394.45 ppm to 397.34 ppm (March 2012 – 2013) at a rate of 2.89 ppm per year, unprecedented in the recorded geological history of the last 65 million years (Figure 4).

Pliocene temperatures - about 2 – 3 degrees C warmer than pre-industrial temperatures, resulted in an intense hydrological cycle, ensuing in extensive rain forests, lush savannas (now occupied by deserts), small ice caps and sea levels about 25 meters higher than at present (Figure 5).

Figure 4. CO2 rise rates vs Temperature rise rates for the Cainozoic (65 Ma to the present). 

Figure 5. The Pliocene Earth compared to the modern Earth 
http://www.giss.nasa.gov/research/features/199704_pliocene/page2.html
Note (1) the lower albedo in the Pliocene poles signifying the smaller
size of the ice caps and (2) the high albedo of 
the modern Sahara and
Gobi deserts signifying the a larger extent of Holocene deserts.
Life abounded during the Pliocene. However, regular river flow conditions such as allowed cultivation and along river valleys since about 7000 years ago, and temperate Mediterraneantype climates allowing extensive farming, could hardly exist under the intense hydrological cycle and heat wave conditions of the Pliocene.

Gradual to intermittent advents of Pleistocene ice ages over the last 2 million years allowed many species to adapt to changing conditions. Abrupt warming events, such as the DansgaardOeschger cycles, occurred during glacial periods (Figure 4). Extreme shifts in state of the climate exceed the rate to which many species can adapt.

The basic laws of atmospheric physics and chemistry and the behavior of past atmospheres indicate changes in the level of atmospheric greenhouse gases constitute a key parameter determining the current trend of the terrestrial climate. Concomitant rates of SO2 release, mainly from coal burning, have regulated changes in temperature.

Increases in SO2 release about 1950 and 2001 are responsible for slow-down of temperature rise (Figure 6).

Figure 6. Comparison of the rate of warming and variations in SO2 levels.
Temperature from 
GISS/NASA (http://data.giss.nasa.gov/gistemp/); SO2 levels after
http://www.atmos-chemphys.net/11/1101/2011/acp-11-1101-2011.html.
          Note the overlap between slow-down of overall 
temperature rise rates and increase in SO2 emissions
(http://www.atmos-chem-phys.net/11/1101/2011/acp-11-1101-2011.html) around 1950 and 2001. 
The current CO2 ppm/year rise rate of ~3 ppm/year surpasses any recorded since the last 65 million years of Earth history. High CO2 and temperature rises occurred about ~55 Ma ago. At that stage release of methane drove a CO2 rise of near-1800 ppm and a temperature rise of about 5 degrees C over 10,000 years, namely a rate of 0.18 ppm/year and 0.0005 degrees C/year (Zachos et al. 2008; http://www.nature.com/nature/journal/v451/n7176/full/nature06588.html).

The K-T asteroid impact of 65 Ma-ago resulted in a rise of more than 2000 ppm CO2 within about 10,000 years, namely ~0.2 ppm /year. This triggered a temperature rise of about 7.5 degrees C, namely 0.00075 degrees C per year (Beerling et al. 2002 http://www.pnas.org/content/99/12/7836.full) (Figure 4). Calculations by these authors suggest a release of approximately 4500 billion tons of carbon from impacted carbonates and shale, ignited bushfires and ocean warming.

The consequences of the current rise in greenhouse gases is manifested by enhancement of the hydrological cycle, with ensuing floods and of heat waves (http://www.ipcc-wg2.gov/SREX/ ; http://www.aph.gov.au/Parliamentary_Business/Committees/Senate_Committees?url=ec_ctte/extreme_weather/index.htm).

Open-ended combustion of known fossil fuel reserves (Figure 7) would lead to atmospheric CO2 levels of ~800 to 1000 ppm CO2, high degree to total melting of the polar ice caps, sea level rise on the scale of tens of meters and disruption of the biosphere on a scale analogous to recorded mass extinctions (http://www.astrobio.net/interview/2553/under-a-green-sky).

Figure 7. CO2 emissions by fossil fuels (1 ppm CO2 ~ 2.12 GtC). 
Alternative estimates of reserves and potentially recoverable resources are from EIA (2011) and GAC (2011).
We are 
headed toward 800 to 1,000+ ppm, which represents the near-certain destruction of modern civilization
as we know it -- as the recent scientific literature makes chillingly clear. 

(http://thinkprogress.org/climate/2012/01/28/413955/james-hansen-on-cowards/). 
Carbon emissions may be self-limiting. It is likely that, before atmospheric CO2 reach 500 ppm, disruption of fossil fuel-combusting systems by extreme weather events would result in reduction of emissions. On the other hand the extent to which amplifying feedback processes (methane release from permafrost and Arctic sediments, bushfires, warming oceans) would continue to add greenhouse gases to the atmosphere is uncertain.

Preoccupied with short-term economic forecast, daily A$ exchange rates, share market fluctuations and, sports results, with some exceptions (http://www.theage.com.au/national/greenhouse-gases-in-new-danger-zone-20130428-2imjm.html) the accelerating rate of atmospheric CO2 seems to hardly rate a mention on the pages of the global media.

There are few signs the extreme danger the terrestrial biosphere and the oceans are driving the global community to undertake the urgent large-scale measures required to attempt to arrest current trends.

In Australia the language has changed, from “the greatest moral issue of our generation” (http://www.youtube.com/watch?v=CqZvpRjGtGM) to hit-pocket controversy over a “carbon tax”, a meningless 5 percent reduction in local emissions which overlook the export of hundreds of million tons of coal, ending up in the same atmosphere.

There is no evidence the recent IPA celebration (http://www.crikey.com.au/2013/04/05/abbottbolt-rinehart-fawn-in-the-ipa-court-of-king-murdoch/), attended by the likely next prime minister, the world’s media moguls and mining magnates, as well as an archbishop, was concerned with the future of the Earth’s climate.

In professor Hans Joachim Schellnhuber’s words stated in Doha “overriding everything else the 1st Law of Humanity: Don’t kill your children!” (http://www.pik-potsdam.de/news/inshort/files/Schellnhuber-keynote-COP18-state-dinner-Doha.pdf).

There is no planet B.

Wednesday, April 24, 2013

Arctic Sea Ice Animation

Arctic Sea Ice Minimum Volume

Above a tilted screenshot from the animation below, by Andy Lee Robinson, of Arctic Sea Ice minimum volumes reached every September since 1979, based on data from the Pan-Arctic Ice Ocean Modeling and Assimilation System (PIOMAS, Zhang and Rothrock, 2003) at the University of Washington.

Andy also composed and performed the piano music, "Ice Dreams", accompanying the video.

video from https://www.youtube.com/watch?v=YgiMBxaL19M


Dorsi Diaz
By Dorsi Diaz

They say a picture can be worth a thousand words. If so, then this video of the Arctic Sea ice loss between 1979 and 2012 must be worth a million. As the recently released video begins to go viral, more people are waking up to the reality of climate change.

Produced by Andy Lee Robinson, this beautiful short clip with its haunting music is revealing the reality of climate change in a brutal and honest way - perhaps even better than any journalist ever could.

In an interview with Robinson, I was amazed at how he had managed to put together this vital information in such a compelling video, and sought to find out more.

To the climate deniers horror, Andy has done this video with no sort of compensation - dashing away climate deniers theories that all climate activists "are on the payroll." With hundreds of painstaking hours put into the development of his video, Andy says he was motivated by "experimenting with ideas and what ifs" and sought to "bring to life something that only existed in my mind to communicate an important message that is being ignored."

To create the video, he used a text editor, numbers and only his imagination to weave together the horrifying decline of Arctic sea ice that has occurred in just 13 short years.

Andy says one of the reasons for creating the video was, "to contribute something to humanity and be recognized for it, applying the skills I have learnt with my free time and not to live in vain" and also, "to prove that anyone can achieve anything they want to given enough determination and dedication."

With over 100 hours invested just into the writing of the program for the video, Andy also said it took 28 hours for 7 servers to render the final video, then about a half hour to write, record, edit and merge the music. The piano composition in the video, "Ice Dreams", was also composed by Andy, who also specializes in digital audio sampling and signal processing.

Robinson, a linux system administrator and consultant, has a passion to bring awareness about climate change to the masses and is adamant about what may happen if civilization does not address this growing threat: "We are in a period of mass extinction and heading for decimation of the quality of life for most lifeforms on the planet, including ourselves who are also subject to the laws of nature of boom and bust as resources are exploited and depleted."

Robinson also believes, with many others, that climate change and ocean acidification are, "planetary emergencies in progress."

Robinson doesn't mince any words either when asked why he created the video: "To be heard loudly and truthfully because mainstream media is still tiptoeing around the herd of elephants in the room because of the fear of change and the pressure of special interests committed to ensuring it stays that way, ignoring the fact that it cannot."

Until recently, climate deniers had dominated much of the political landscape and held a tight reign on the mainstream media. Now that climate change seems to be spiraling out of control with billions of dollars in weather related disasters, people are waking up to a preview of what it's like to live in a climate altered world.

Robinson's research for the video uses records of Arctic sea ice loss from PIOMAS through the Polar Ice Center, a group of dedicated investigators that conducts interdisciplinary research on the oceanography, climatology, meteorology, biology and ecology of the ice-covered regions on Earth and elsewhere in the solar system.

Through the perfect dance of loss and hauntingly beautiful music merged with pending disaster, Robinson has brought home a message in this video that we all need to heed: "Survival is not compulsory, nor a God given right. It requires effort, investment and cooperation."

Are we listening yet?

Dorsi Diaz is a freelance writer and art educator living in the San Francisco Bay Area. Dorsi's passion is to help adults and children unlock their creativity and imagination and to also spread the word about the effects of world-wide climate change - follow Dorsi Diaz on Twitter

Below, the Arctic Death Spiral, another visualization of the PIOMAS data by Andy Lee Robinson. 

Andy's Arctic Death Spiral - update incl May 2013 - latest version at http://haveland.com/share/arctic-death-spiral.png


Below, Andy's Arctic Death Spiral video, with the sea ice volume data controlling spectral harmonics.


Added below is a video of another Arctic Death Spiral, accompanied by Chopin's 'Funeral March'. This work is not by Andy, it's from reric.org by R. Eric Collins.


Tuesday, April 16, 2013

Lawrence Livermore scientists discover new materials to capture methane

Methane capture in zeolite SBN. Blue represents adsorption
sites, which are optimal for methane (CH4) uptake. Each site
is connected to three other sites (yellow arrow) at optimal
interaction distance. Image credit: LLNL News Release
Scientists at Lawrence Livermore National Laboratory (LLNL) and UC Berkeley and have discovered new materials to capture methane, the second highest concentration greenhouse gas emitted into the atmosphere.

Methane is a substantial driver of global climate change, contributing 30 percent of current net climate warming. Concern over methane is mounting, due to leaks associated with rapidly expanding unconventional oil and gas extraction, and the potential for large-scale release of methane from the Arctic as ice cover continues to melt and decayed material releases methane to the atmosphere. At the same time, methane is a growing source of energy, and aggressive methane mitigation is key to avoiding dangerous levels of global warming.

The research team, made up of Amitesh Maiti, Roger Aines and Josh Stolaroff of LLNL and Professor Berend Smit, researchers Jihan Kim and Li-Chiang Lin at UC Berkeley and Lawrence Berkeley National Lab, performed systematic computer simulation studies on the effectiveness of methane capture using two different materials - liquid solvents and nanoporous zeolites (porous materials commonly used as commercial adsorbents).

While the liquid solvents were not effective for methane capture, a handful of zeolites had sufficient methane sorption to be technologically promising. The research appears in the April 16 edition of the journal, Nature Communications.

Unlike carbon dioxide, the largest emitted greenhouse gas, which can be captured both physically and chemically in a variety of solvents and porous solids, methane is completely non-polar and interacts very weakly with most materials.

"Methane capture poses a challenge that can only be addressed through extensive material screening and ingenious molecular-level designs," Maiti said.

Methane is far more potent as a greenhouse gas than CO2. Researchers have found that the release of as little as 1 percent of methane from the Arctic alone could have a warming effect approaching that being produced by all of the CO2 that has been pumped into the atmosphere by human activity since the start of the Industrial Revolution.

Methane is emitted at a wide range of concentrations from a variety of sources, including natural gas systems, livestock, landfills, coal mining, manure management, wastewater treatment, rice cultivation and a few combustion processes.

The team's research focused on two different applications -- concentrating a medium-purity methane stream to a high-purity range (greater than 90 percent), as involved in purifying a low-quality natural gas; and concentrating a dilute stream (about 1 percent or lower) to the medium-purity range (greater than 5 percent), above methane's flammability limit in air.

Through an extensive study, the team found that none of the common solvents (including ionic liquids) appears to possess enough affinity toward methane to be of practical use. However, a systematic screening of around 100,000 zeolite structures uncovered a few nanoporous candidates that appear technologically promising.

Zeolites are unique structures that can be used for many different types of gas separations and storage applications because of their diverse topology from various networks of the framework atoms. In the team's simulations, one specific zeolite, dubbed SBN, captured enough medium source methane to turn it to high purity methane, which in turn could be used to generate efficient electricity.

"We used free-energy profiling and geometric analysis in these candidate zeolites to understand how the distribution and connectivity of pore structures and binding sites can lead to enhanced sorption of methane while being competitive with CO2 sorption at the same time," Maiti said.

Other zeolites, named ZON and FER, were able to concentrate dilute methane streams into moderate concentrations that could be used to treat coal-mine ventilation air.

The work at LLNL was funded by the Advanced Research Projects Agency-Energy (ARPA-E).

References

- News Release
Lawrence Livermore scientists discover new materials to capture methane
https://www.llnl.gov/news/newsreleases/2013/Apr/NR-13-04-03.html

-  New materials for methane capture from dilute and medium-concentration sources
http://www.nature.com/ncomms/journal/v4/n4/abs/ncomms2697.html

Related

- Methane sequestration in hydrates
http://arctic-news.blogspot.com/2012/06/methane-sequestration-in-hydrates.html

Another link between CO2 and mass extinctions of species

By Andrew Glikson, Australian National University
Andrew Glikson, earth and
paleo-climate scientist at
Australian National University

It’s long been known that massive increases in emission of CO2 from volcanoes, associated with the opening of the Atlantic Ocean in the end-Triassic Period, set off a shift in state of the climate which caused global mass extinction of species, eliminating about 34% of genera. The extinction created ecological niches which allowed the rise of dinosaurs during the Triassic, about 250-200 million years ago.

New research released in Science Express has refined the dating of this wave of volcanism. It shows marine and land species disappear from the fossil record within 20,000 to 30,000 years from the time evidence for the eruption of large magma flows appears, approximately 201 million years ago. These volcanic eruptions increased atmospheric CO2 and increased ocean acidity.

Mass extinctions caused by rapidly escalating levels of CO2 have occurred before. Global warming image from www.shutterstock.com
Mass extinctions due to rapidly escalating levels of CO2 are recorded since as long as 580 million years ago. As our anthropogenic global emissions of CO2 are rising, at a rate for which no precedence is known from the geological record with the exception of asteroid impacts, another wave of extinctions is unfolding.

Mass extinctions of species in the history of Earth include:
  • the ~580 million years-old (Ma) Acraman impact (South Australia) and Acrytarch (ancient palynomorphs) extinction and radiation 
  • Late Devonian (~374 Ma) volcanism, peak global temperatures and mass extinctions 
  • the end-Devonian impact cluster associated with mass extinction, which among others destroyed the Kimberley Fitzroy reefs (~360 Ma) 
  • the upper Permian (~267 Ma) extinction associated with a warming trend
  • the Permian-Triassic boundary volcanic and asteroid impact events (~ 251 Ma) and peak warming 
  • the End-Triassic (201 Ma) opening of the Atlantic Ocean, and massive volcanism 
  • an End-Jurassic (~145 Ma) impact cluster and opening of the Indian Ocean 
  • the Cretaceous-Tertiary boundary (K-T) (~65 Ma) impact cluster, Deccan volcanic activity and mass extinction 
  • the pre-Eocene-Oligocene boundary (~34 Ma) impact cluster and a cooling trend, followed by opening of the Drake Passage between Antarctica and South America, formation of the Antarctic ice sheet and minor extinction at ~34 Ma. 

Throughout the Phanerozoic (from 542 million years ago), major mass extinctions of species closely coincided with abrupt rises of atmospheric carbon dioxide and ocean acidity. These increases took place at rates to which many species could not adapt. These events – triggered by asteroid impacts, massive volcanic activity, eruption of methane, ocean anoxia and extreme rates of glaciation (see Figures 1 and 2) – have direct implications for the effects of the current rise of CO2.

Figure 1 – Trends in atmospheric CO2 and related glacial and interglacial periods since the Cambrian (542 million years ago), showing peaks in CO2 levels (green diamonds) associated with asteroid impacts and/or massive volcanism. CO2 data from Royer 2004 and 2006.
Figure 2 – Relations between CO2 rise rates and mean global temperature rise rates during warming periods, including the Paleocene-Eocene Thermal Maximum, early Oligocene, mid-Miocene, late Pliocene, Eemian (glacial termination), Dansgaard-Oeschger cycles, Medieval Warming Period, 1750-2012 and 1975-2012 periods.

In February 2013, CO2 levels had risen to near 396.80ppm at Mauna Loa Atmospheric Observatory, compared to 393.54ppm in February 2012. This rise – 3.26ppm per year – is at the highest rate yet recorded. Further measurements show CO2 is at near 400ppm of the atmosphere over the Arctic. At this rate the upper stability threshold of the Antarctic ice sheet, defined at about 500–600ppm CO2 would be reached later this century (although hysteresis of the ice sheets may slow down melting).

Our global carbon reserves – including coal, oil, oil shale, tar sands, gas and coal-seam gas – contain considerably more than 10,000 billion tonnes of carbon (see Figure 5). This amount of carbon, if released into the atmosphere, is capable of raising atmospheric CO2 levels to higher than 1000ppm. Such a rise in atmospheric radiative forcing will be similar to that of the Paleocene-Eocene boundary thermal maximum (PETM), which happened about 55 million years-ago (see Figures 1, 2 and 4). But the rate of rise surpasses those of this thermal maximum by about ten times.
Figure 3 – Plot of percent mass extinction of genera versus peak atmospheric CO2 levels at several stages of Earth history.
Figure 4 – The Paleocene-Eocene Thermal Maximum (PETM) represented by sediments in the Southern Ocean, central Pacific and South Atlantic oceans. The data indicate a) deposition of an organic matter-rich layer consequent on extinction of marine organisms; b) lowering of δ18O values representing an increase in temperature and c) a sharp decline in carbonate contents of sediments representing a decrease in pH and increase in acidity (Zachos et al 2008) 

The Paleocene-Eocene boundary thermal maximum event about 55 million years ago saw the release of approximately 2000 to 3000 billion tons of carbon to the atmosphere in the form of methane (CH4). It led to the extinction of about 35-50% of benthic foraminifera (see Figure 3 and 4), representing a major decline in the state of the marine ecosystem. The temperature rise and ocean acidity during this event are shown in Figures 4 and 6.

Based on the amount of carbon already emitted and which could continue to be released to the atmosphere (see Figure 5), current climate trends could be tracking toward conditions like those of the Paleocene-Eocene event. Many species may be unable to adapt to the extreme rate of current rise in greenhouse gases and temperatures. The rapid opening of the Arctic Sea ice, melting of Greenland and west Antarctic ice sheets, and rising spate of floods, heat waves, fires and other extreme weather events may signify a shift in state of the climate, crossing tipping points.
Figure 5 – CO2 emissions from fossil fuels (2.12 GtC ~ 1 ppm CO2). Estimated reserves and potentially recoverable resources.By analogy to medical science analysing blood count as diagnosis for cancer, climate science uses the greenhouse gas levels of the atmosphere, pH levels of the ocean, variations in solar insolation, aerosol concentrations, clouding states at different levels of the atmosphere, state of the continental ice sheets and sea ice, position of high pressure ridges and climate zones and many other parameters to determine trends in the climate. The results of these tests, conducted by thousands of peer-reviewed scientists world-wide, have to date been ignored, at the greatest peril to humanity and nature.

Continuing emissions contravene international laws regarding crimes against humanity and related International and Australian covenants. In the absence of an effective global mitigation effort, governments world-wide are now presiding over the demise of future generations and of nature, tracking toward one of the greatest mass extinction events nature has seen. It is time we learned from the history of planet Earth.

Figure 6: The Paleocene-Eocene boundary thermal maximum. http://www.uta.edu/faculty/awinguth/petm_research/petm_home.html

This article was earlier published at The Conversation (on March 22, 2013).

Monday, April 8, 2013

Earth is on the edge of runaway warming


The old picture, with Earth well within
our solar system's habitable zone
How well is Earth's orbit around the sun positioned within the boundaries of the habitable zone? The illustration by the Wikipedia image on the right would give that impression that Earth was comfortably positioned in the middle of this zone.

What is the habitable zone? To be habitable, a planet the size of Earth should be within certain distances from its Sun, in order for liquid water to exist on its surface, for which temperatures must be between freezing point (0° C) and boiling point (100° C) of water.

In the Wikipedia image, the dark green zone indicates that a planet the size of Earth could possess liquid water, which is essential since carbon compounds dissolved in water form the basis of all earthly life, so watery planets are good candidates to support similar carbon-based biochemistries.

If a planet is too far away from the star that heats it, water will freeze. The habitable zone can be extended (light green color) for larger terrestrial planets that could hold on to thicker atmospheres which could theoretically provide sufficient warming and pressure to maintain water at a greater distance from the parent star.

A planet closer to its star than the inner edge of the habitable zone will be too hot. Any water present will boil away or be lost into space entirely. Rising temperatures caused by greenhouse gases could lead to a moist greenhouse with similar results.

The distance between Earth and the Sun is one astronomical unit (1 AU). Mars is often said to have an average distance from the Sun of 1.52 AU. A recent study led by Ravi Kopparapu at Penn State mentions that early Mars was warm enough for liquid water to flow on its surface. However, the present-day solar flux at Mars distance is 0.43 times that of Earth. Therefore, the solar flux received by Mars at 3.8 Gyr was 0.75 × 0.43 = 0.32 times that of Earth. The corresponding outer habitable zone limit today, then, would be about 1.77 AU, i.e. just a bit too far away from the Sun to sustain water in liquid form. Venus, on the other hand, is too close to the Sun (see box below).

Kopparapu calculates that the Solar System’s habitable zone lies between 0.99 AU (92 million mi, 148 million km) and 1.70 AU (158 million mi, 254 million km) from the Sun. In other words, Earth is on the edge of runaway warming.

Image by Kopparapu et al. New calculations show that Earth is positioned on the edge of the habitable zone
(
green-shaded region), boundaries of which are determined by the moist-greenhouse
(inner edge, higher flux values) and maximum greenhouse (outer edge, lower flux values)

Kopparapu says that if current IPCC temperature projections of a 4 degrees K (or Celsius) increase by the end of this century are correct, our descendants could start seeing the signatures of a moist greenhouse by 2100.

Kopparapu argues that once the atmosphere makes the transition to a moist greenhouse, the only option would be global geoengineering to reverse the process. In such a moist-greenhouse scenario, not only are the ozone layer and ice caps destroyed, but the oceans would begin evaporating into the atmosphere's upper stratosphere.


Venus' runaway greenhouse effect a warning for Earth
by Sam Carana - first posted November 28, 2007, at:
http://global-warming.gather.com/viewArticle.action?articleId=281474977189423

Venus was transformed from a haven for water to a fiery hell by an runaway greenhouse effect, concludes the European Space Agency (ESA), after studying data from the Venus Express, which has been orbiting Venus since April 2006.

Venus today is a hellish place with surface temperatures of over 400°C (752°Fahrenheit), winds blowing at speeds of over 100 m/s (224 mph) and pressure a hundred times that on Earth, a pressure equivalent, on Earth, to being one km (0.62 miles) under the sea.

Hakan Svedhem, ESA scientist and lead author of one of eight studies published on Wednesday in the British journal Nature, says that Earth and Venus have nearly the same mass, size and density, and have about the same amount of carbon dioxide. In the past, Venus was much more Earth-like and was partially covered with water, like oceans, the ESA scientists believe.

How could a world so similar to Earth have turned into such a noxious and inhospitable place? The answer is planetary warming. At some point, atmospheric carbon triggered a runaway warming on Venus that boiled away the oceans. As water vapour is a greenhouse gas, this further trapped solar heat, causing the planet to heat up even more. So, more surface water evaporated, and eventually dissipated into space. It was a “positive feedback” -- a vicious circle of self-reinforcing warming which slowly dessicated the planet.

“Eventually the oceans began to boil”, said David Grinspoon, a Venus Express interdisciplinary scientist from the Denver Museum of Nature and Science, Colorado, USA. “You wound up with what we call a runaway greenhouse effect”, Hakan Svedhem says. Venus Express found hydrogen and oxygen ions escaping in a two to one ratio, meaning that water vapor in the atmosphere the little that is left of what they believe were once oceans is still disappearing.

While most of Earth's carbon store remained locked up in the soil, rocks and oceans, on Venus it went into the atmosphere, resulting in Venus' atmosphere now consisting of about 95% carbon dioxide.

“Earth is moving along the curve that connects it to Venus”, warns Dmitry Titov, science coordinator of the Venus Express mission.

References

- Venus Express - European Space Agency (ESA)

- Venus inferno due to 'runaway greenhouse effect', say scientists

- Probe likens young Venus to Earth

- European mission reports from Venus


References

- Habitable zones around main-sequence stars: new estimates
Ravi Kumar Kopparapu et al. 2013

- Habitable Zone - Wikipedia

- Earth is closer to the edge of Sun's habitable zone

- Updated model for identifying habitable zones around stars puts Earth on the edge


Saturday, April 6, 2013

How much will temperatures rise?

Runaway Global Warming


If we take the NASA Annual Mean Land-Ocean Temperatures and draw a projection into the future, temperatures will quickly be 3 degrees Celsius higher than the base period (1951-1980), i.e. well before 2050, as illustrated on image 1. below. 

Image 1. Temperatures will be 3 degrees Celsius higher well before 2050

Above projection appears to be steeper than even the worst-case scenario pictured by the IPCC for years, such as on the image below.

Image 2. from IPCC 2001. Projections of globally averaged surface temperature 2000-2100 are shown for six SRES scenarios and IS92a using a model with average climate sensitivity. The grey region marked "several models all SRES envelope" shows the range of results from the full range of 35 SRES scenarios in addition to those from a range of models with different climate sensitivities. The temperature scale is departure from the 1990 value.
Could temperatures rise faster in future than what the IPCC anticipated in 2001? The answer must be yes! In 2007, the IPCC described that, even if greenhouse gas concentrations in the atmosphere were stabilized for 100 years at year 2000 values (B1), then we would still be committed to a further warming of 0.5°Celsius. This committed warming should not be confused with ‘unavoidable climate change’ over the next half century, which would be greater because forcing cannot be instantly stabilized. And of course, as it turned out, emissions have not been stabilized at 2000 values, but have in fact increased substantially.

As it turned out, the models used by the IPCC made all kinds of assumptions that didn't eventuate. But before deciding to instead settle for a relatively simple extrapolation of observed data, there are some issues that require a further look.  

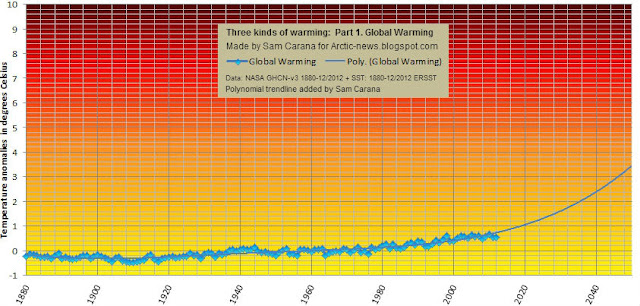
As discussed in the earlier post Accelerated Arctic Warming, temperatures in the Arctic have been rising at a much faster pace than global temperatures, and if this accelerated rise continues, we can expect a 10 degrees Celsius rise in the Arctic before 2040, as illustrated by image 3. below.  

Image 3. Three kinds of warming - 2: Accelerated warming in the Arctic 
Such a temperature rise in the Arctic will undoubtedly lead to additional greenhouse gas emissions in the Arctic, of carbon dioxide, nitrous oxide and particularly methane, threatening to trigger runaway global warming. 

The image below, from the methane-hydrates blog, combines these three kinds of warming, showing global temperatures that soon catch up with accelerated Arctic warming, as heatwaves at high latitudes will cause wildfires, in particular in Siberia, where firestorms in peat-lands, tundras and forests could release huge amounts of emissions, including soot, much of which could settle on the Himalayan plateau, darkening the ice and snow and resulting in more local heat absorption. Rapid melt of glaciers will then cause flooding at first, followed by dramatic decreases in the flow of river water that up to a billion people now depend on for water supply and irrigation.

In other words, the situation looks much more dire than what most models make us believe; the more reason to adopt the climate plan that is also described at the post at the methane-hydrates blog.

Image 4. Three kinds of warming - 1, 2 and 3 


References

- IPCC (TAR) - Climate Change 2001: Synthesis Report

- IPCC (AR4) - Climate Change 2007: Working Group I: The Physical Science Basis

- Accelerated Arctic Warming

- Methane hydrates