Tuesday, October 16, 2012

Albedo change in the Arctic threatens to cause runaway global warming

Mark Flanner et al. calculated in 2011 that snow and ice on the Northern Hemisphere had a combined cooling effect of 3.3 Watts per square meter (of which 2 W/m² relates to the snow cover on land and 1.3 W/m² to the sea ice).

This cooling effect is diminishing rapidly, as temperatures rise and snow and ice cover declines. Snow and ice on the Northern Hemisphere had already declined substantially over the years and was reflecting 0.45 watts less energy per square meter in 2011 than it did in 1979 (Flanner, 2011).

As discussed in Albedo change in the Arctic, Professor Peter Wadhams calculates that the loss of the Arctic sea ice cooling effect alone can be compared to the net global warming caused by people's emissions (1.66 W/m², IPCC, 2007b).
From: sites.google.com/site/arctischepinguin/home/piomas

The exponential trends added by Wipneus to PIOMAS Arctic sea ice volume data show that the Arctic Ocean looks set to be ice-free from 2015 onwards for the period from August through to October, while July and November look set to follow from 2017, respectively 2018 onwards with June following closely thereafter. In other words, we could soon face an Arctic Ocean that is ice-free for half the year.

Snow cover on land takes up an even larger area than sea ice. The chart below illustrates the decline of snow cover on land in the Northern Hemisphere (without Greenland) for the month June.


What trends could fit these data? On the image below, I've added trendlines and I encourage others to come up with better ones.

Clearly, a lot of snow and ice looks set to disappear over the next few years. Note that what happens in winter doesn't matter as much, as little sunlight reaches the Arctic in winter. What matters most is how much sunlight is reflected when insolation in the Arctic is high. Insolation during the months June and July is higher in the Arctic than anywhere else on Earth, as shown on the image below, by Pidwirny (2006).


While Greenland remains extensively covered with snow and ice, the reflectivity of its cover shows rapid decline, as illustrated by the image below. The July data since 2000, from the meltfactor blog with projection in red added by Sam Carana, suggest a exponential fall in reflectivity that looks set to go into freefall next year.
From: Greenland is melting at incredible rate

Albedo: wikipedia.org/wiki/Albedo

A drop of as little as 1% in Earth’s albedo corresponds with a warming roughly equal to the effect of doubling the amount of carbon dioxide in the atmosphere, which would cause Earth to retain an additional 3.4 watts of energy for every square meter of surface area (NASA, 2005; Flanner et al., 2011).

Combined, the snow line retreat, loss of sea ice and decline of Greenland's reflectivity constitute a huge loss of summer cooling in the Arctic.

As a result, summer temperatures in the Arctic look set to rise rapidly over the next few years, threatening to unleash massive amounts of methane from sediments below shallow waters of the Arctic Ocean, spiraling Earth into runaway global warming.

If you are also concerned about this development, please share the image below at Facebook, with a link to this post.


References

- Albedo - Wikipedia
wikipedia.org/wiki/Albedo

- Albedo change in the Arctic
arctic-news.blogspot.com/2012/07/albedo-change-in-arctic.html

- Flanner et al. (2011), Radiative forcing and albedo feedback from the Northern Hemisphere cryosphere between 1979 and 2008.
nature.com/ngeo/journal/v4/n3/full/ngeo1062.html

- Flanner et al. (2011), Presentation October 27, 2011, WCRP Open Science Conference
wcrp-climate.org/conference2011/orals/B11/Flanner_B11.pdf

- Greenland is melting at incredible rate
arctic-news.blogspot.com/2012/07/greenland-is-melting-at-incredible-rate.html

- NASA, 2005 (at Archive.org)
archive.org/details/albedo_ceres_mar05

Pidwirny, M. (2006). "Earth-Sun Relationships and Insolation". Fundamentals of Physical Geography, 2nd Edition
physicalgeography.net/fundamentals/6i.html

- PIOMAS monthly average sea ice volume, with exponential trends added
sites.google.com/site/arctischepinguin/home/piomas

- Snow Climate Lab, Rutgers University
climate.rutgers.edu/snowcover


Sunday, October 14, 2012

Glaciers cracking in the presence of carbon dioxide

Northern Hemisphere snow and ice map , October 14, 2012 (credit: NSIDC, NOAA)

Snow covers more than 33% of lands north of the equator from November to April, reaching 49% coverage in January. The role of snow in the climate system includes strong positive feedbacks related to albedo and other, weaker feedbacks related to moisture storage, latent heat and insulation of the underlying surface, which vary with latitude and season (IPCC, 2007a8).

Albedo or reflectivity of surfaces
wikipedia.org/wiki/Albedo
Ice caps and glaciers cover 7% of the Earth—more than Europe and North America combined—and are responsible for reflecting 80–90% of the Sun’s light rays that enter our atmosphere and maintain the Earth’s temperature7. They are also a natural carbon sink, capturing a large amount of carbon dioxide7.

Snow and ice on the Northern Hemisphere has a cooling effect of 3.3 watts per square meter, peaking in May at ~ 9 watts per square meter. Snow and ice on the Northern Hemisphere has declined over the years and is now reflecting 0.45 watts less energy per square meter than it did in 1979 (Flanner, 2011). As discussed in Albedo change in the Arctic, this compares to warming of 1.66 watts per square meter for the net emission by people (IPCC, 2007b9).

A recent press release7 announced that researchers from the Massachusetts Institute for Technology have shown that the material strength and fracture toughness of ice are decreased significantly under increasing concentrations of carbon dioxide molecules, making ice more fragile and making ice caps and glaciers more vulnerable to cracking and splitting into pieces.

“If ice caps and glaciers were to continue to crack and break into pieces, their surface area that is exposed to air would be significantly increased, which could lead to accelerated melting and much reduced coverage area on the Earth,” said lead author of the study Professor Markus Buehler.

Buehler, along with his student and co-author of the paper, Zhao Qin, used a series of atomisticlevel computer simulations to analyse the dynamics of molecules to investigate the role of carbon dioxide molecules in ice fracturing, and found that carbon dioxide exposure causes ice to break more easily.

Notably, the decreased ice strength is not merely caused by material defects induced by carbon dioxide bubbles, but rather by the fact that the strength of hydrogen bonds—the chemical bonds between water molecules in an ice crystal—is decreased under increasing concentrations of carbon dioxide. This is because the added carbon dioxide competes with the water molecules connected in the ice crystal.

It was shown that carbon dioxide molecules first adhere to the crack boundary of ice by forming a bond with the hydrogen atoms and then migrate through the ice in a flipping motion along the crack boundary towards the crack tip.

The carbon dioxide molecules accumulate at the crack tip and constantly attack the water molecules by trying to bond to them. This leaves broken bonds behind and increases the brittleness of the ice on a macroscopic scale7.

A drop of as little as 1% in Earth’s albedo corresponds with a warming roughly equal to the effect of doubling the amount of carbon dioxide in the atmosphere, which would cause Earth to retain an additional 3.4 watts of energy for every square meter of surface area (NASA, 200510; Flanner et al., 2011b6).

Below, a video by Dr. Peter Carter4, showing loss of snow and ice albedo on the Northern Hemisphere from 1997 to 2009, using NOAA images, and also showing the relationship to global food security and Arctic methane.

Saturday, October 13, 2012

Radio and Laser Frequency and Harmonic Test Ranges for the Lucy and HAARP Experiments and their Application to Atmospheric Methane Destruction

by Malcolm P.R. Light
October 7th, 2012

Introduction


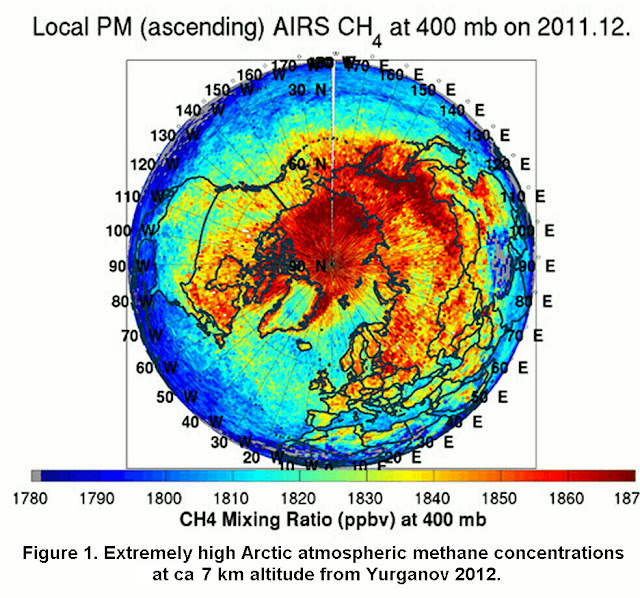
Methane is now being expelled into the Arctic atmosphere by the subsea methane hydrates at a fast increasing rate and that this expulsion began in earnest in August 2010 (Figure 1; Arctic atmospheric methane concentrations at ca 7 km altitude - Yurganov 2012; Carana 2011 a,b,c; 2012 a,b; Light 2002 a,b; 2011 a,b,c; 2012 a,b,c; Light and Carana 2011). The methane is rising into the stratosphere and mesosphere where some of it is being oxidised to produce larger quantities of noctilucent clouds between 76 and 85 km altitude. These noctilucent clouds were seen north of Norway but are now occurring at much lower latitudes over Colorado. An early figure from NASA indicates that noctilucent clouds were originally confined to the southern polar regions (Figure 2).

Prof. James Russel of Hampton University argues that the build up of methane in the atmosphere is the reason for the increase in noctilucent clouds. Prof Russel says that "When methane makes its way into the upper atmosphere it is oxidised by a complex series of reactions to form water vapour. This extra water vapour is then available to grow ice crystals for noctilucent clouds". Therefore if we succeed in breaking down the methane in the stratosphere and mesosphere using the HAARP - IRIS (Ionospheric Research Instrument) using the 13.56 MHz methane destruction frequency it could lead to an increase in noctilucent cloud formation in a circular zone directly above the HAARP transmitters which could be detected by optical cameras or radar. The HAARP tests should be conducted in the summer when the temperatures are at their lowest in Alaska (140o to 160o Kelvin) increasing the chances of noctilucent cloud formation from the radio frequency oxidised methane. The HAARP IRIS transmitters normal frequency range is from 2.8 MHz to 10 MHz (Wales 2012). If for example a 10 MHz carrier wave is modulated by a 3.56 MHz signal it will produce and Upper Side Frequency of 13.56 MHz the required methane destruction frequency and a Lower Side Frequency of 6.44 MHz (see Table 3)(Penguin Dictionary of Physics, 2000)

NASA modelling shows a wide equatorial band of stratospheric methane reaching 1.8 ppmv, much higher than occurs in the troposphere indicating that the methane is rising up into the stratosphere where it is now accumulating and it will soon form a continuous global warming veil causing extreme heating of the Earth's surface by trapping the suns heat below it (Figure 3)(Light 2011c).
The problem is that the methane being released into the Arctic atmosphere from destabilization of the submarine methane hydrates has an extremely high global warming potential compared to carbon dioxide, close to 100 times for the first 15 years of its life (Wales 2012; Dessuse et al. 2008). Hence a methane concentration of 2 ppmv is approximately equivalent to adding 200 ppmv of carbon dioxide to the atmosphere, i.e. multiplying the present carbon dioxide content by 1.5. But 2 ppmv is only 2 ten thousands of a percent of methane and you need about 15 percent of methane in the air for it to burn (Wales 2012). Therefore you cannot burn these giant clouds of methane erupting into the Arctic atmosphere and they are rising so fast through the troposphere into the stratosphere that they become impossible to deal with without some action at a distance method such as radio waves or laser. We could of course try to get chemicals up there and into the Arctic but that would lead to even more pollution in the long run. Vibrating the ionosphere at the correct methane destruction radio frequency using HAARP may help to oxidise some of the methane throughout the entire stratosphere and troposphere but more localised radio/laser destruction of the rising methane clouds will also be required if we are going to make any dent at all in the volume of methane that is now being released into the atmosphere from the Arctic ocean.

We are dealing with oceanic methane being released in increasing quantities into the atmosphere from destabilised methane hydrates over which we have no control at all and once it is in the air and in the stratosphere we presently have no way to break it down. This Stratospheric methane reservoir is going to increase in density, thickness and extent until it encompasses the entire Earth and will eventually cause catastrophic global warming and the extinction of all life on earth (Light 2011c). Furthermore because the methane remains mostly in the stratosphere, it is not recorded when average atmospheric compositions are determined at Mauna Loa and other locations so we don't know how much is up there yet (Light 2011c). When the German-French Merlin Lidar methane detecting satellite is launched in 2014 we should have a better idea of the methane distribution from the surface to 50 km altitude.

When the Arctic ice cap melts towards the end of 2015 there will be a massive increase in the amount of heat being absorbed by the Arctic ocean from the sun. Tthe Gulf Stream which presently feeds the Arctic with Atlantic water along the west side of Svalbard and through the Barents Sea is normally cooled when it hits the floating ice pack and this will cease to happen bringing even vaster amounts of Atlantic heat via the Gulf Stream into the Arctic. Consequently the Arctic subsea methane hydrates will destabilize at an even faster rate because of the increasing Arctic ocean temperature pouring methane into the Arctic atmosphere and stratosphere (Light 2011c, Light 2012a, b).

The extreme weather events in the United States this year which included record heating and drought conditions, massive loss of food crops with farmers going bankrupt, more hurricane flooding in New Orleans and tornadoes in New York is just a small sample of what will come in the next four or five summers as the Arctic ice finally melts. The Arctic ice cap works like the Earths air conditioner because of the latent heat of melting and freezing of the floating ice and its effect on moderating atmospheric temperatures.

An extensive stratospheric methane warming veil is spreading over the United States and is undoubtedly the reason for the extreme weather events and very high temperatures. The livelihoods of all the American people are going to be totally compromised in the next few years unless we develop a system of destroying the atmospheric methane that is erupting in the Arctic from the destabilization of submarine methane hydrates and is accumulating as a global warming veil in the stratosphere and mesosphere

We are facing impossible odds with regard to the Arctic ocean methane release and in the same way that Colonel Travis drew a line at the Alamo to ask for volunteers to help him defend the mission against Santa Ana's massive Mexican army, I am drawing a virtual line through the snow on the top of the Arctic ice pack to ask for volunteers to defend the American people from the fast gathering Arctic methane global firestorm. We desperately need dedicated scientists and engineers to volunteer to develop an effective "action at a distance" method of destroying the Arctic oceanic methane clouds as they are erupting from the sea surface and entering the stratosphere and mesosphere. If the United States can land giant rovers on the mars with a sky crane, surely American engineers and scientists are up to this challenge. We need to get rid of as much of this atmospheric methane as we can to drop the polar temperatures to reasonable levels. This will of course have to go hand in hand with a massive cut back in carbon dioxide emissions from all developed and developing countries.

Wednesday, October 10, 2012

Arctic summer wind shift

Arctic summer wind shift could affect sea ice loss and U.S./European weather

Changes in summer Arctic wind patterns contribute not only to an unprecedented loss of Arctic sea ice, but could also bring about shifts in North American and European weather, concludes the NOAA-led study The recent shift in early summer Arctic atmospheric circulation.

Image from the North Pole webcam shows (July 27, 2010) ponds created by the summer sea ice melt.  (Credit: NOAA)

A research team led by James Overland, Ph.D., of NOAA’s Pacific Marine Environmental Laboratory in Seattle, Washington, examined the wind patterns in the subarctic in the early summer between 2007 and 2012 as compared to the average for 1981 to 2010. They discovered that the previously normal west-to-east flowing upper-level winds have been replaced by a more north-south undulating, or wave-like pattern. This new wind pattern transports warmer air into the Arctic and pushes Arctic air farther south, and may influence the likelihood of persistent weather conditions in the mid-latitudes.

“Our research reveals a change in the summer Arctic wind pattern over the past six years. This shift demonstrates a physical connection between reduced Arctic sea ice in the summer, loss of Greenland ice, and potentially, weather in North American and Europe,” said Overland, an oceanographer who leads the laboratory’s Coastal and Arctic Research Division.

The shift provides additional evidence that changes in the Arctic are not only directly because of global warming, as shown by warmer air and sea temperatures, but are also part of an “Arctic amplification” through which multiple Arctic-specific physical processes interact to accelerate temperature change, ice variability, and ecological impacts.

The study was co-authored by scientists from Rutgers University in New Jersey, the University of Sheffield in the United Kingdom, and the Joint Institute for the Study of the Atmosphere and Ocean, a partnership of NOAA and the University of Washington.

Before 2007, typical summer winds at the Arctic surface were more variable but tended to flow from the west. Since then, the summer winds were found to blow more consistently from the south, through the Bering Strait, across the North Pole, and out toward the Atlantic Ocean relative to the mean pattern in previous decades. These winds transfer additional heat from the south toward the North Pole and push sea ice across the Arctic and out into the Atlantic Ocean, contributing to record losses of summer sea ice. The 2012 Arctic summer sea ice minimum far surpassed 2007 as the lowest on record.

“Higher pressure over the North American continent and Greenland is driving these changes in the early summer wind patterns,” said Edward Hanna, Ph.D, of the University of Sheffield.

These shifts in winds not only affect weather patterns throughout the Arctic but are also thought to influence weather in Greenland, the United States, and western Europe. Understanding such links is an ongoing area of research, the scientists said. The effects of Arctic amplification will increase as more summer ice retreats over coming decades. Enhanced warming of the Arctic affects the jet stream by slowing its west-to-east winds and by promoting larger north-south meanders in the flow. Predicting those meanders and where the weather associated with them will be located in any given year, however, remains a challenge.

The researchers say that with more solar energy going into the Arctic Ocean because of lost ice, there is reason to expect more extreme weather events, such as heavy snowfall, heat waves, and flooding in North America and Europe but these will vary in location, intensity, and timescales.

“What we're seeing is stark evidence that the gradual temperature increase is not the important story related to climate change; it's the rapid regional changes and increased frequency of extreme weather that global warming is causing. As the Arctic warms at twice the global rate, we expect an increased probability of extreme weather events across the temperate latitudes of the northern hemisphere, where billions of people live,” said Jennifer Francis, Ph.D, of Rutgers.

Screenshot from above video


Video, links to further videos and references below.


Does Arctic Amplification Fuel Extreme Weather in Mid-Latitudes?
Jennifer Francis, Rutgers University, 25 January 2012, in collaboration with Steve Vavros, University of Wisconsin


Sources

- Arctic summer wind shift could affect sea ice loss and U.S./European weather, says NOAA-led study
http://www.noaanews.noaa.gov/stories2012/20121010_arcticwinds.html

- The recent shift in early summer Arctic atmospheric circulation
http://www.agu.org/pubs/crossref/2012/2012GL053268.shtml


Videos

- Does Arctic Amplification Fuel Extreme Weather in Mid-Latitudes?
Featuring Jennifer Francis, Rutgers University, January 25, 2012
Published on Mar 29, 2012 by noiv
https://www.youtube.com/watch?v=4spEuh8vswE

- Weather and Climate Summit, Day 5, Session 9
Presentation by Dr. Jennifer Francis, Rutgers University. Topic: The Arctic Paradox
Uploaded by StormCenterInc on Jan 23, 2012
https://www.youtube.com/watch?v=RtRvcXUIyZg
https://marine.rutgers.edu/~francis/pres/Francis_Vavrus_2012GL051000_pub.pdf

- Jennifer Francis: What the Ice is Telling Us
Published on Sep 26, 2012 by greenmanbucket
https://www.youtube.com/watch?v=rZflv8GpgUA

- Jennifer Francis: An Interesting Fall and Winter
Brief clip from a longer conversation with Arctic Specialist Jennifer Francis of Rutgers University.
Published on Sep 25, 2012 by greenmanbucket
https://www.youtube.com/watch?v=D58xDmzMnpk

- Weird Winter - Mad March - Part 1
Published on Apr 16, 2012 by greenman3610
https://www.youtube.com/watch?v=_-1iBHAivmw

- Weird Winter - Mad March - Part 2
Published on Apr 16, 2012 by yaleclimateforum
https://www.youtube.com/watch?v=HTAZue6ylZ8

- BBC on Sea Ice - featuring Professor Peter Wadhams
Published on Sep 6, 2012 by greenmanbucket
http://www.youtube.com/watch?v=_6umZfpv6eM


Related

- Accelerated Warming in the Arctic
https://arctic-news.blogspot.com/2012/09/accelerated-warming-in-the-arctic.html

- Changes to Polar Vortex affect mile-deep ocean circulation patterns
https://arctic-news.blogspot.com/2012/09/changes-to-polar-vortex-affect-mile-deep-ocean-circulation-patterns.html

- Diagram of Doom
https://arctic-news.blogspot.com/2012/08/diagram-of-doom.html

- Opening the Doorways to Doom
https://arctic-news.blogspot.com/2012/08/opening-the-doorways-to-doom.html

- How extreme will it get?
https://arctic-news.blogspot.com/2012/07/how-extreme-will-it-get.html