Showing posts with label tipping point. Show all posts

Saturday, May 22, 2021

Arctic Ocean invaded by hot, salty water


Sea surface temperatures on the Northern Hemisphere have been rising dramatically over the years, as illustrated by above image, indicating that the latent heat tipping point is getting crossed, while the methane hydrates tipping point could get crossed soon, depending on developments.

At the moment, the surface temperature of most of the Arctic ocean's is still below 0°C.

Heat is entering the Arctic Ocean from the south, as illustrated by the image on the right. Hot, salty water is entering the Arctic Ocean from the Atlantic Ocean as currents dive underneath the ice, causing the ice to melt from below. 
[ click on images to enlarge ]

The image on the right, from the NSIDC article A step in our Spring, compares sea ice age between March 12 to 18 for the years 1985 (a) and 2021 (b).

The bottom graph (c) shows a time series from 1985 to 2021 of percent ice coverage of the Arctic Ocean domain. The Arctic Ocean domain is depicted in the inset map with purple shading.

At the end of the ice growth season in mid-March, 73.3% of the Arctic Ocean domain was covered by first-year ice, while 3.5% was covered by ice 4+ years old. 

This compares to 70.6% and 4.4% respectively in March 2020.

In March 1985, near the beginning of the ice age record, the Arctic Ocean region was comprised of nearly equal amounts of first-year ice (39.3%) and 4+ year-old ice (30.6%).

Sea ice that hasn't yet survived a summer melt season is referred to as first-year ice. This thin, new ice is vulnerable to melt and disintegration in stormy conditions. Ice that survives a summer melt season can grow thicker and less salty, since snow that thickens the ice contains little salt. Thickness and salt content determine the resistance of the ice to melt. Multiyear ice is more likely to survive temperatures that would melt first-year ice, and to survive waves and winds that would break up first-year ice.

The image on the right shows a forecast of the thickness of the sea ice, run on May 20, 2021 and valid for May 21, 2021. 

An area is visible north of Severnaya Zemlya toward the North Pole where thickness is getting very thin, while there is one spot where the ice has virtually disappeared. 

The spot is likely a melting iceberg, the animation on the right shows that the spot has been there for quite a few days, while the freshwater in this spot appears to result from melting amid salty water. 

Overall, sea ice is getting very thin, indicating that the buffer constituted by the sea ice underneath the surface is almost gone, meaning that further heat entering the Arctic Ocean will strongly heat up the water. 

As the animation underneath on the right shows, freshwater is entering the Arctic Ocean due to runoff from land, i.e. rainwater from rivers, meltwater from glaciers and groundwater runoff from thawing permafrost. 

At the same time, very salty water is entering the Arctic Ocean from the Atlantic Ocean. 

The map below shows how salty and hot water from the Atlantic Ocean enters the Arctic Ocean along two currents, flowing on each side of Svalbard, and meeting at this area north of Severnaya Zemlya where thickness is getting very low. 

The blue color on the map indicates depth (see scale underneath). 

The image below, by Malcolm Light and based on Max & Lowrie (1993), from a recent post, shows vulnerable Arctic Ocean slope and deep water methane hydrates zones below 300 m depth. 

Malcolm Light indicates three areas: 
Area 1. Methane hydrates on the slope;
Area 2. Methane hydrates on the abyssal plane; 
Area 3. Methane hydrates associated with the spreading Gakkel Ridge hydro-thermal activity (the Gakkel Riidge runs in between the northern tip of Greenland and the Laptev Sea). 


The freezing point of freshwater is 0°C or 32°F. For salty water, the freezing point is -2°C or 28.4°F.

During April 2021, sea ice was about 160 cm thick.

In June and July 2021, thickness will fall rapidly, as illustrated by the image on the right by Nico Sun. 

Sea ice acts as a buffer, by consuming energy in the process of melting, thus avoiding that this energy causes a temperature rise of the water. 

As long as there is sea ice in the water, this sea ice will keep absorbing heat as it melts, so the temperature will not rise at the sea surface and remain at zero°C. The amount of energy that is consumed in the process of melting the ice is as much as it takes to heat an equivalent mass of water from zero°C to 80°C.

The accumulated ice melt energy until now is the highest on record, as illustrated by the image on the right, by Nico Sun.

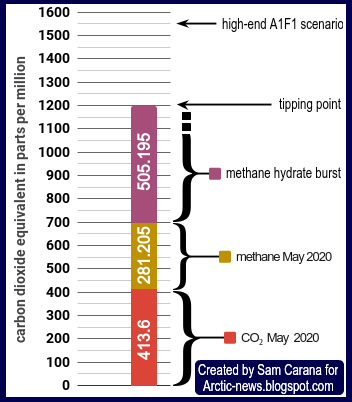
The image below further illustrate the danger. As the temperature of the water keeps rising, more heat will reach sediments at the seafloor of the Arctic Ocean that contain vast amounts of methane, as discussed at this page and in this post.

Ominously, methane levels reached a peak of 2901 ppb at 469 mb on May 13, 2021. 

Research

In the extract of a 2008 paper, Natalia Shakhova et al. conclude: ". . we consider release of up to 50 Gt of predicted amount of hydrate storage as highly possible for abrupt release at any time."


The video below contains excerpts from Nick Breeze's interview with Natalia Shakhova at the European Geophysical Union in Vienna, 2012, on the likelihood and timeframe of a large methane release from the seafloor of the Arctic Ocean. 

Natalia Shakhova: "The total amount of methane in the atmosphere is about 5Gt. The amount of carbon in the form of methane in this Arctic shelf is - approximately - from hundreds to thousands Gt and, of course, only 1% of [such an] amount is required to double the atmospheric burden of methane."

"But to destabilize 1% of this carbon pool, I think, not much effort is needed, considering the state of the permafrost and the amount of methane involved, because what divides the methane from the atmosphere is a very shallow water column and the weakening permafrost, which is losing its ability to seal, to serve as a seal, and this is, I think, not a matter of thousands of years, it's a matter of decades, at most hundred years." 

(Natalia talks with Igor Semiletov)
Natalia Shakhova: "Just because this area is seismically and tectonically active, and there was some investigation that the tectonic activity was increasing, and the seismic activity, the destabiliation of the ground, just mechanical forcing destabiliation [may suffice to act as] additional pathway for this methane to escape. There are many factors that are very convincing for us [to conclude] that it might happen."

Elaborating on the timeframe.
Natalia Shakhova: "Not any time, any time sounds like it might happen today, it might happen tomorrow, the day after tomorrow . . " 
Igor Simelitov: "It might!"


The image below was created with content from a 2019 paper by Natalia Shakhova et al. It concludes that methane releases could potentially increase by 3-5 orders of magnitude, considering the sheer amount of methane preserved within the shallow East Siberian Arctic Shelf seabed deposits and the documented thawing rates of subsea permafrost reported recently.

In a 2021 paper by researchers from Europe, Russia and the U.S., results from field research are published showing that methane is getting released from locations deep below the submarine permafrost. Lead author, Julia Steinbach, from Stockholm University, says: “The permafrost is a closed lid over the seafloor that’s keeping everything in place. And now we have holes in this lid.” 

In the video below, Nick Breeze interviews Igor Semiletov on methane plumes detected during this 2020 field research over the East Siberian Arctic Shelf (ESAS).


In the video below, Nick Breeze interviews Örjan Gustafsson on field research on methane in the East Siberian Arctic Shelf (ESAS)


In the video below, Peter Wadhams analyses the threat of Arctic methane releases.


In the video below, Guy McPherson discusses the situation.


In conclusion, temperatures could rise dramatically soon. A 3°C will likely suffice for humans to go extinct, making it in many respects rather futile to speculate about what will happen in the longer term. On the other hand, the right thing to do is to help avoid the worst things from happening, through comprehensive and effective action as described in the Climate Plan.

Links

• NOAA Climate at a Glance

• Danish Meteorological Institute - Arctic temperature
http://ocean.dmi.dk/arctic/meant80n.uk.php

• Freezing point of water - Climate Change: Arctic sea ice

• Arctic surface temperature

• NSIDC: A step in our Spring, image credit: T. Tschudi, University of Colorado, and W. Meier and J.S. Stewart, National Snow and Ice Data Center/Image by W. Meier

• Arctic sea ice - thickness and salinity - navy.mil
https://www7320.nrlssc.navy.mil/GLBhycomcice1-12/arctic.html

• CryosphereComputing - by Nico Sun
https://cryospherecomputing.tk

• A 4.5 km resolution Arctic Ocean simulation with the global multi-resolution model FESOM 1.4 - by Qiang Wang et al. 

• Max, M.D. & Lowrie, A. 1993. Natural gas hydrates: Arctic and Nordic Sea potential. In: Vorren, T.O., Bergsager, E., Dahl-Stamnes, A., Holter, E., Johansen, B., Lie, E. & Lund, T.B. Arctic Geology and Petroleum Potential, Proceedings of the Norwegian Petroleum Society Conference, 15-17 August 1990, Tromso, Norway. Norwegian Petroleum Society (NPF), Special Publication 2 Elsevier, Amsterdam, 27-53.
https://www.elsevier.com/books/arctic-geology-and-petroleum-potential/vorren/978-0-444-88943-0

• Extinction by 2027- by Malcolm Light
https://arctic-news.blogspot.com/2021/05/extinction-by-2027.html


• Anomalies of methane in the atmosphere over the East Siberian shelf: Is there any sign of methane leakage from shallow shelf hydrates? - by Shakhova, Semiletov, Salyuk and Kosmach (2008)
https://www.cosis.net/abstracts/EGU2008/01526/EGU2008-A-01526.pdf

• Understanding the Permafrost–Hydrate System and Associated Methane Releases in the East Siberian Arctic Shelf - by Natalia Shakhova, Igor Semiletov and Evgeny Chuvilin 
https://www.mdpi.com/2076-3263/9/6/251

• A Massive Methane Reservoir Is Lurking Beneath the Sea 


Wednesday, September 16, 2020

Temperatures threaten to become unbearable

Many people could face unbearable temperatures soon. 

Temperature anomalies on land in the Northern Hemisphere (red) are spread out much wider and they are more than 0.5°C higher than global land+ocean anomalies (blue).


The pale green and grey trends are both long-term trends based on January 1880-August 2020 NOAA data. The short-term red and blue trends, based on January 2013-August 2020 NOAA data, are added to show the potential for a rapid rise. How could temperatures possibly rise this fast? 

A rapid temperature rise could eventuate by 2026 due to a number of contributing factors:
• crossing of the latent heat and methane tipping points
• moving toward an El Niño 
• entering solar cycle 25
• changes in aerosols
• feedbacks kicking in more strongly as further tipping points get crossed.

Crossing the Latent Heat and Methane Hydrate Tipping Points

The image below, updated from an earlier post, shows two such tipping points.


The August 2020 ocean temperature anomaly on the Northern Hemisphere was 1.13°C above the 20th century average. The image shows a trend based on January 1880-August 2020 NOAA data. The latent heat tipping point is estimated to be 1°C above the 20th century average. Crossing the latent heat tipping point threatens to cause the methane hydrates tipping point to be crossed, estimated to be 1.35°C above the 20th century average.

Keep in mind that above images show temperature anomalies from the 20th century average, which is NOAA's default baseline. As an earlier analysis points out, when using a 1750 baseline and when using ocean air temperatures and higher Arctic anomalies, we may have already crossed both the 1.5°C and the 2°C thresholds that politicians at the Paris Agreement pledged would not get crossed.

Natural Variability - El Niño and Solar Cycle

Currently, we are currently in a La Niña period, which suppresses air temperatures.

Only a thin layer of sea ice remained left in the Arctic, with extent almost as low as it was in 2012 around this time of year, as discussed in the previous post. As air temperatures dropped in September 2020, Arctic sea ice extent started to increase again about September 15, 2020. This made that a patch of sea ice remained present at the surface of the Arctic Ocean, despite the dramatic thinning of the sea ice. 

When an El Niño event returns, conditions will get worse. 


How long will it take before we'll reach the peak of the upcoming El Niño? NOAA says
El Niño and La Niña episodes typically last nine to 12 months, but some prolonged events may last for years. While their frequency can be quite irregular, El Niño and La Niña events occur on average every two to seven years. Typically, El Niño occurs more frequently than La Niña.
The temperature rise is strongest in the Arctic, as illustrated by the zonal mean temperature anomaly map below. The map has latitude on the vertical axis and shows anomalies as high as 4.83°C or 8.69°F in the Arctic. The North Pole is at the top of the map, at 90° North, the Equator is in the middle, at 0°, and the South Pole is at the bottom, at -90° South. And yes, NASA's default baseline is 1951-1980, so anomalies are even higher when using a 1750 baseline. 


So, what could make the difference next year is an upcoming El Niño. Solar irradiance is also on the rise, in line with the 11-year Solar Cycle.


Above image shows a NOAA graph depicting the current Solar Cycle (24) and the upcoming Solar Cycle (25). 

In 2019, Tiar Dani et al. analyzed a number of studies and forecasts pointing at the maximum in the upcoming Solar Cycle occurring in the year 2023 or 2024.

The analysis found some variation in intensity between forecasts, adding images including the one on the right, which is based on linear regression and suggests that the Solar Cycle 25 may be higher than the previous Solar Cycle 24. 

In 2012, Patrick (Pádraig) Malone analyzed factors critical in forecasting when an ice-free day in the Arctic sea first might occur. 

Patrick concluded that once solar activity moved out of the solar minimum, Arctic sea ice extent would start to crash. Accordingly, a Blue Ocean Event could occur as early as 2021, as illustrated by the image below.  


Further Tipping Points and Feedbacks

Further tipping points and feedbacks can start kicking in more strongly as one tipping point gets crossed. At least ten tipping points apply to the Arctic, as discussed in an earlier post and it looks like the latent heat tipping point has already been crossed. 

Ocean heat is very high in the North Atlantic and the North Pacific, and heat continues to enter the Arctic Ocean. 


Arctic sea surface temperatures and air temperature are now high since ocean heat, previously consumed by sea ice, is now coming to the surface where the sea ice has disappeared.

As above image shows, sea surface temperature anomalies in the Arctic Ocean on September 14, 2020, were as high as 9.3°C or 16.8°F (at the location marked by green circle), compared to the daily average during the years 1981-2011. 

These high sea surface temperature anomalies occur at locations where the daily average during the years 1981-2011 was around freezing point at this time of year.

Part of this ocean heat is rising into the atmosphere over the Arctic Ocean, resulting in high air temperatures that in turn prevent formation of sea ice thick enough to survive until the next melting season. The image on the right shows a forecast of Arctic air temperatures (2 m) that are 5°C higher than 1979-2000 (forecast for October 5, 2020, 18Z run Sep 26, 2020 06Z). 

Methane Danger is High


Ominously, peak methane levels of 2762 parts per billion (ppb) were recorded by the MetOp-1 satellite on the morning of September 20, 2020, at 586 milibar (mb), as above image shows.


Mean methane levels of 1925 ppb were recorded by the MetOp-1 satellite on the morning of September 20, 2020, at 293 mb, as above image shows.


Peak methane levels of 2813 ppb were recorded by the MetOp-1 satellite on the afternoon of September 30, 2020, at 469 mb, as above image shows. 


Methane has been rising most at higher altitudes over the past few years. On September 26, 2020 pm, the MetOp-1 satellite recorded a mean global methane level of 1929 ppb at 293 mb, which is equivalent to a height of 9.32 km or 30,57 ft, i.e. in the lower stratosphere over the North Pole (the top of the troposphere over the Equator is higher, at about 17 km).

Why methane is so important

As illustrated by the image on the right, from an earlier post, high methane levels could be reached within decades, and such a scenario could unfold even without sudden big bursts, but merely due to a continuation of a trend based on data up to 2014. This would obviously result in a huge rise in global temperature. 

A huge rise in global temperature would eventuate even earlier in case of a big burst of methane erupting from the seafloor of the Arctic Ocean. 

Methane's initial global warming potential (GWP) is very high. For the first few years after its release, methane is more than 150 times as strong as a greenhouse gas compared to carbon dioxide, as discussed in an earlier post.

How high are current methane levels? NOAA's May 2020 level for methane was 1874.7 ppb

Using a GWP of 150, this translates into 1.8747 x 150 = 281.205 ppm CO₂e. 

NOAA's figures are conservative, given that NOAA measures methane at marine surface level. 

Anyway, when using this conservative NOAA methane figure of 1874.7 ppb which at a GWP of 150 results in 281.205 ppm CO₂e, and when using an additional 413.6 ppm for recent carbon dioxide levels (NOAA's global May 2020 CO₂ level), these two add up to 694.805 ppm CO₂e, which is 505.195 CO₂e away from the cloud feedback tipping point (1200 CO₂e) that can, on its own, raise global temperatures instantly by 8°C. 

This is illustrated by the image on the right, an update from an earlier post

An additional eruption of methane from the Arctic Ocean into the atmosphere of 505.195 CO₂e translates into 505.195 / 150 = 3.368 ppm or 3368 ppb of methane. 

If the current amount of methane in the atmosphere is about 5 Gt, then 3368 ppb of methane corresponds with an amount of methane just under 9 Gt.

Coincidently, a peak level of 3369 ppb was recorded on August 31, 2018, pm. Granted, there is a large difference between a local peak level and a global mean level, but then again, a much smaller burst of methane can trigger the clouds feedback.

Even a relatively small burst of methane could trigger the clouds feedback, given that it will cause huge heating of the Arctic both directly and indirectly, in turn triggering further eruptions of methane from the seafloor of the Arctic Ocean.

Huge direct heating of the Arctic could occur due to methane's high immediate GWP and its even higher Local Warming Potential (LWP) given that the release takes place in the Arctic, while huge indirect heating of Arctic would occur due to the resulting decline of sea ice and of much of the permafrost on land.

Even a relatively small burst of methane could cause not only albedo losses but also releases of carbon dioxide, methane and nitrous oxide and further fast feedbacks such as a rise in clouds and water vapor, especially over the Arctic Ocean, as illustrated by the image on the right, from the extinction page and an earlier post.

Importantly, the initial trigger to a huge temperature rise by 2026 could be an event that is typically categorized under natural variability, such as an El Niño, increased solar irradiance or a storm causing a sudden large influx of hot, salty water into the Arctic Ocean and causing an eruption of seafloor methane. Indeed, a seemingly small forcing can result in total collapse that takes place so rapidly that any political action will be too little, too late.

The video below illustrates the importance of the Precautionary Principle. The video shows how a seemingly small bump by a forklift causes all shelves in a warehouse to collapse. 


The situation is dire and calls for immediate, comprehensive and effective action, as described in the Climate Plan.


Links

• NOAA Global Climate Report - August 2020
https://www.ncdc.noaa.gov/sotc/global/202008

• Multivariate El Niño/Southern Oscillation (ENSO) Index Version 2 (MEI.v2)
https://psl.noaa.gov/enso/mei

• What are El Niño and La Niña?

• NOAA ISIS Solar Cycle Sunspot Number Progression

• Multiple regression analysis predicts Arctic sea ice - by Patrick Malone (Pádraig) Malone 
https://www.facebook.com/Amber.and.Patrick/posts/1140053003062976 

• Prediction of maximum amplitude of solar cycle 25 using machine learning - by Tiar Dani et al. 
https://iopscience.iop.org/article/10.1088/1742-6596/1231/1/012022

• NOAA - Trends in Artmospheric Methane 

• Trends in Atmospheric Carbon Dioxide - global

• When will we die?

• A rise of 18°C or 32.4°F by 2026?

• Most Important Message Ever

• Blue Ocean Event
https://arctic-news.blogspot.com/2018/09/blue-ocean-event.html

• Record Arctic Warming
https://arctic-news.blogspot.com/2016/04/record-arctic-warming.html

• Warning of mass extinction of species, including humans, within one decade


Tuesday, August 18, 2020

Methane Hydrates Tipping Point threatens to get crossed

The July 2020 ocean temperature anomaly on the Northern Hemisphere was 1.11°C or 2°F above the 20th century average, the highest July anomaly on record. The yellow circles onthe image below are July data and red circles are data for other months.

The July 2020 ocean temperature anomaly on the Northern Hemisphere was well above the latent heat tipping point of 1°C above the 20th century average, threatening to soon reach the methane hydrates tipping point of 1.35°C above the 20th century average.


These are only two of ten tipping points that are hitting the Arctic, as described in a earlier post, while additionally there are further tipping points that do not specifically hinge on what happens in the Arctic, e.g. the ozone layer is very vulnerable, as described in an earlier post.

The latent heat tipping point

An earlier analysis indicates that the latent heat tipping point gets crossed when ocean temperature anomalies on the Northern Hemisphere get higher than 1°C above the 20th century average. As above image indicates, the tipping point did get crossed temporarily on several occasions in recent years, but this year it looks to have been crossed irreversibly, as indicated by the trend.

[ Record low volume? ]
As the image on the right indicates, there still is sea ice present at the surface of the Arctic Ocean, so there still is sea ice in terms of volume. However, there now is virtually no ice left underneath the surface of the Arctic Ocean to act as a buffer.

In other words, the sea ice has virtually lost its capacity to act as a buffer to consume further heat entering the Arctic Ocean.

Once the latent heat tipping point is crossed, further incoming heat will have to get absorbed by the Arctic Ocean, instead of getting consumed by the melting of sea ice, as was previously the case.

As long as there is sea ice in the water, this sea ice will keep absorbing heat as it melts, so the temperature will not rise at the sea surface and remain at zero°C. The amount of energy that is consumed in the process of melting the ice is as much as it takes to heat an equivalent mass of water from zero°C to 80°C.


Ocean Heat

Meanwhile, global heating continues and more than 90% of global heating is going into oceans.


Arctic sea ice is getting very thin and, at this time of year, it is melting rapidly, due to heat entering the Arctic Ocean from above, from the Atlantic Ocean and the Pacific Ocean, and from rivers that end in the Arctic Ocean.

The two images below shows the difference in sea surface temperatures of the Arctic Ocean, between August 4, 2020, 12 GMT and a forecast for August 22, 2020, 12 GMT. The important difference between the two images is the shrinking of the pale blue area in the Arctic Ocean, where the sea surface temperature is below 0°C, and the increase in areas with other tints of blue where the sea surface temperature is above 0°C.


The image below, from a recent post, shows ocean surface temperatures on August 10, 2020, with very high anomalies showing up where the sea ice has disappeared. The image also shows that the Arctic Ocean in many places is very shallow (right panel).

[ from earlier post ]

The dramatic decline of the sea ice becomes more clear when looking at Arctic sea ice volume. The image below, by Nico Sun, shows volume up to August 31, 2020.


The dramatic decline of the sea ice is even more evident when looking at Arctic sea ice thickness. The image below, by Nico Sun, shows thickness up to August 31, 2020.


Below is a Universität Bremen image showing Arctic sea ice thickness on August 29, 2020.


The navy.mil animation below was run on September 15, 2020, and shows Arctic sea ice thickness over 30 days (last 8 frames are forecasts for September 16 - September 23, 2020).


The image below shows a forecast for September 15, run September 14, 2020. 


The image below shows that, on August 30, 2020, the mean air temperature in the Arctic (80°N to 90°N) was still above the freshwater freezing point (0°C or 32°F or 273.15°K), well above the mean temperature for 1958-2002 and also above the year 2012 which had exceptionally high temperatures in September.


As long as the air temperature remains above the freshwater freezing point, the sea ice will keep melting from above, on top of the melting that occurs from below as a result of ocean heat entering the Arctic Ocean from the Atlantic Ocean and the Pacific Ocean.


Above ads.nipr.ac.jp image shows sea ice in 2020 (red line) still shrinking in extent. Arctic sea ice on September 13, 2020, was 3.55 million km², i.e. well below extent for that date in any other year except for 2012, when extent was as low as 3.18 million km² (on September 15 and 16, 2012). 

According to NSIDC, sea ice extent on September 15, 2020, was 3.737 million km², while extent on September 17, 2012, was 3.387 million km².


The image below, updated by the University of Bremen September 10, 2020, shows Arctic sea ice extent perilously close to 2012 extent. Note that the University of Bremen has meanwhile "reprocessed the data".


On the Northern Hemisphere, ocean temperatures are very high at the moment. The image below illustrates that, showing sea surface temperatures as high as 33.8°C on August 26, 2020. For some time to come, water flowing into the Arctic Ocean from the Atlantic Ocean and the Pacific Ocean will therefore remain higher than it used to be.


River water flowing into the Arctic Ocean also contributes to rising temperatures of the water of the Arctic Ocean.

Furthermore, there are numerous feedbacks, e.g. when black carbon from forest fires settles on sea ice, this causes albedo changes in a self-reinforcing feedback loop, i.e. as less sunlicht gets reflected back up into the sky, more sunlight will be absorbed by the sea ice, speeding up its decline.

As confirmed by a recent study, dramatic abrupt climate change is taking place in the Arctic, and another dangerous feedback of the rising heat is stronger storms, as also discussed in an earlier post.


Stronger storms can bring more moisture into the Arctic. Above image shows a forecast for August 29, 2020, 1200Z, with two cyclones hitting the Arctic Ocean and with 100% relative humidity at the North Pole, at 1000 hPa.


Above image shows a cyclone, forecast for August 25, 2020, with wind north of Greenland as fast as 67 km/h or 41 mph.


Above image shows that rain is forecast to fall over the North Pole on August 26, 202, 12Z.

The image on the right is a forecast for August 26, 2020, 21Z. The image shows strong wind over the North Atlantic, while another cyclone is showing up north of Greenland.

Sea ice is very thin at the moment, so it is vulnerable to get broken up into small small pieces, thus speeding up its melting, as warm water can more easily reach the broken-up pieces from all sides.

Such storms can batter the sea ice, and they can come with rain, further devastating the sea ice by speeding up melting and creating melt-pools on top of the ice with a low albedo.

The image on the right shows a forecast for August 29, 2020. Rain is showing up north of Greenland, as another cyclone is forecast to hit the area. The cyclone is forecast to have strong winds spinning counter-clockwise, thus threatening to speed up the drift of the sea ice north of Greenland toward Fram Strait.

A sequence of cyclones could in a short time push much of the thickest of the remaining sea ice out of the Arctic Ocean through Fram Strait.

The methane hydrates tipping point

As discussed in earlier posts such as this one, the rising temperature of the Arctic Ocean threatens to destabilize methane hydrates contained in sediments at the seafloor of the Arctic Ocean.

As the top image shows, the methane hydrates tipping point could be crossed soon, as the Arctic Ocean is heating up dramatically, which is in part the result of the latent heat tipping point getting crossed, which makes that the temperature of the Arctic Ocean can rise very rapidly.

The methane hydrates tipping point threatens to get crossed as ocean temperature anomalies on the Northern Hemisphere become higher than 1.35°C above the 20th century average, which threatens to occur early next year.

Because the Arctic Ocean in many places is very shallow, heat can quickly reach sediments at the seafloor, which threatens to destabilize methane hydrates. The water of the Arctic Ocean is particularly shallow over the East Siberian Arctic Shelf (ESAS), making that the water there can warm up very quickly during summer heat peaks with heat reaching the seafloor and penetrating cracks in frozen sediments at the seafloor, which can lead to abrupt destabilization of methane hydrates contained in these sediments.

As discussed in an earlier post, the loss of subsurface sea ice is only one of ten tipping points hitting the Arctic. As the temperature of the oceans keeps rising, more heat will reach sediments at the seafloor of the Arctic Ocean that contain vast amounts of methane, as discussed in this page and this post.


Large abrupt methane releases in one spot will quickly deplete the oxygen in shallow waters, making it harder for microbes to break down the methane there, while methane that is rising through waters that are only shallow will also be able to enter the atmosphere very quickly, leaving little time for microbes to break down the methane.

As illustrated by the 2012 image on the right, a large abrupt release of methane from hydrates in the Arctic can have more warming impact than all carbon dioxide emitted by burning of fossil fuel in a year. This is due to the high global warming potential (GWP) of methane following its release.

As this heating is concentrated in the Arctic, it will contribute to further methane releases from hydrates in the Arctic, in another self-reinforcing feedback loop.

The situation is extremely dangerous, given the vast amounts of methane present in sediments in the ESAS and given that there is very little hydroxyl in the air over the Arctic to break down the methane.

[ from earlier post ]

Ominously, the MetOp-1 satellite recorded a peak methane level of 2945 parts per billion (ppb), at 586 mb on the afternoon of August 18, 2020.


Two days later, the MetOp-1 satellite recorded a peak methane level of 2778 ppb, at 469 mb on the afternoon of August 20, 2020, while mean methane levels reached 1907 ppb.


That afternoon, on August 20, 2020, the MetOp-1 satellite recorded an even higher methane level, of 1923 ppb, at 293 mb, i.e. higher up in the atmosphere.


The danger is further illustrated by the image below, posted in February 2019 and showing a potential rise of 18°C or 32.4°F from 1750 by the year 2026.


Indeed, a rise of 18°C could eventuate by 2026, as illustrated by the image below and as discussed in an earlier post.


The situation is dire and calls for immediate, comprehensive and effective action, as described in the Climate Plan.


Links

• NOAA Global Climate Report - July 2020
https://www.ncdc.noaa.gov/sotc/global/202007

• Danish Meteorological Institute - 5 Day Ocean Forecast - Universal (Greenwich) Time
http://ocean.dmi.dk/anim/index.uk.php

• Danish Meteorological Institute - sea ice thickness and volume
http://polarportal.dk/en/sea-ice-and-icebergs/sea-ice-thickness-and-volume

• Danish Meteorological Institute - Arctic temperature
http://ocean.dmi.dk/arctic/meant80n.uk.php

• Danish Meteorological Institute - Arctic sea ice extent
http://ocean.dmi.dk/arctic/icecover.uk.php

• NOAA ocean heat content
https://www.nodc.noaa.gov/OC5/3M_HEAT_CONTENT/index.html

• MetOp satellite - methane
https://www.ospo.noaa.gov/Products/atmosphere/soundings/iasi

• Arctic sea ice - thickness - navy.mil
https://www7320.nrlssc.navy.mil/GLBhycomcice1-12/arctic.html

• Arctic sea ice - thickness - Universität Bremen
https://seaice.uni-bremen.de/databrowser

• Climate reanalyzer - precipitation, wind and pressure forecasts
https://climatereanalyzer.org/wx/fcst/?mdl_id=gfs&dm_id=world-ced&wm_id=prcp-mslp-gph500

• New release: Arctic warming satisfies criteria for abrupt climate change https://www.bjerknes.uib.no/en/article/news/arctic-warming-satisfies-criteria-abrupt-climate-change

• Past perspectives on the present era of abrupt Arctic climate change - by Eystein Jansen et al. https://www.nature.com/articles/s41558-020-0860-7

• Copernicus Atmosphere Monitoring Service
https://atmosphere.copernicus.eu/charts/cams

• Arctic sea ice extent - NSIDC
http://nsidc.org/arcticseaicenews/charctic-interactive-sea-ice-graph

• Arctic sea ice extent - Vishop, Arctic Data archive System, National Institute of Polar Research, Japan
https://ads.nipr.ac.jp/vishop/#/extent

• Arctic sea ice extent - University of Bremen 
https://seaice.uni-bremen.de/data/amsr2/today/extent_n_running_mean_amsr2_previous.png

• North Hole 2020?
https://arctic-news.blogspot.com/2020/08/north-hole-2020.html

• Arctic Hit By Ten Tipping Points
https://arctic-news.blogspot.com/2020/04/arctic-hit-by-ten-tipping-points.html

• Why stronger winds over the North Atlantic are so dangerous
https://arctic-news.blogspot.com/2020/02/why-stronger-winds-over-north-atlantic-are-so-dangerous.html

• Very High Greenhouse Gas Levels
https://arctic-news.blogspot.com/2020/05/very-high-greenhouse-gas-levels.html

• Critical Tipping Point Crossed In July 2019
https://arctic-news.blogspot.com/2019/09/critical-tipping-point-crossed-in-july-2019.html

• Fast Path to Extinction
https://arctic-news.blogspot.com/2020/06/fast-path-to-extinction.html

• Crossing the Paris Agreement thresholds
https://arctic-news.blogspot.com/p/crossing.html

• 2°C crossed
https://arctic-news.blogspot.com/2020/03/2c-crossed.html

• Why America should lead on climate
https://arctic-news.blogspot.com/2016/01/why-america-should-lead-on-climate.html

• Methane's Role in Arctic Warming
https://arctic-news.blogspot.com/2016/02/methanes-role-in-arctic-warming.html

• The Threat
https://arctic-news.blogspot.com/p/threat.html

• When will we die?
https://arctic-news.blogspot.com/2019/06/when-will-we-die.html

• A rise of 18°C or 32.4°F by 2026?
https://arctic-news.blogspot.com/2019/02/a-rise-of-18c-or-324f-by-2026.html

• Most Important Message Ever
https://arctic-news.blogspot.com/2019/07/most-important-message-ever.html

• Climate Plan
https://arctic-news.blogspot.com/p/climateplan.html