The above image, adapted from Climate Reanalyzer, shows that on September 8, 2023, the North Atlantic sea surface reached a new record high temperature, of 25.4°C, even higher than the record reached the day before.
The situation is critical! More heat entering the Arctic Ocean threatens to destabilize hydrates and cause huge amounts of methane to erupt and enter the atmosphere.
The image on the right, adapted from NASA Worldview, shows the poor state of the sea ice.
On September 8, 2023, the Polarstern reached the North Pole. The image below shows the research vessel and the sea ice at the North Pole.
#Polarstern reaches the #NorthPole for the seventh time 🫶Five weeks after setting sail from Tromsø, our research vessel makes a stop at the northernmost point on Earth. #AWIhttps://t.co/iNxZYZUSk3
The image on the right, adapted from University of Bremen, shows Arctic sea ice concentration and the route followed by the Polarstern.
The threat is that, as the water of the Arctic Ocean keeps heating up, heat will reach the seafloor and destabilize methane hydrates contained in sediments at the seafloor, resulting in eruptions of huge amounts of methane.
Erupting from the hydrates occurs at great force, since the methane expands 160 when decompressed, resulting in the methane rapidly rising in the form of plumes, leaving little or no opportunity for microbes to decompose the methane in the water column. Furthermore, the atmosphere over the Arctic contains very little hydroxyl, resulting in methane persisting in the air over the Arctic much longer than elsewhere.
After months of very high temperatures, the Arctic reached a new record high temperature for the time of year, i.e. 1.52°C on September 10, 2023, an anomaly of 2.25°C.
Meanwhile, global sea ice extent is much lower than in any other year on record for this time of year.
Ominously, very high methane levels continue to be recorded at Barrow, Alaska, U.S.
The image below, adapted from Climate Reanalyzer, shows that the World Sea Surface Temperature (60°South - 60°North) was at a record high of 21.1°C or 69.98°F for the third day in a row on August 23, 2023. As the image also shows, sea surface temperatures over the past few months have been much higher for the time of year than in any other year on record.
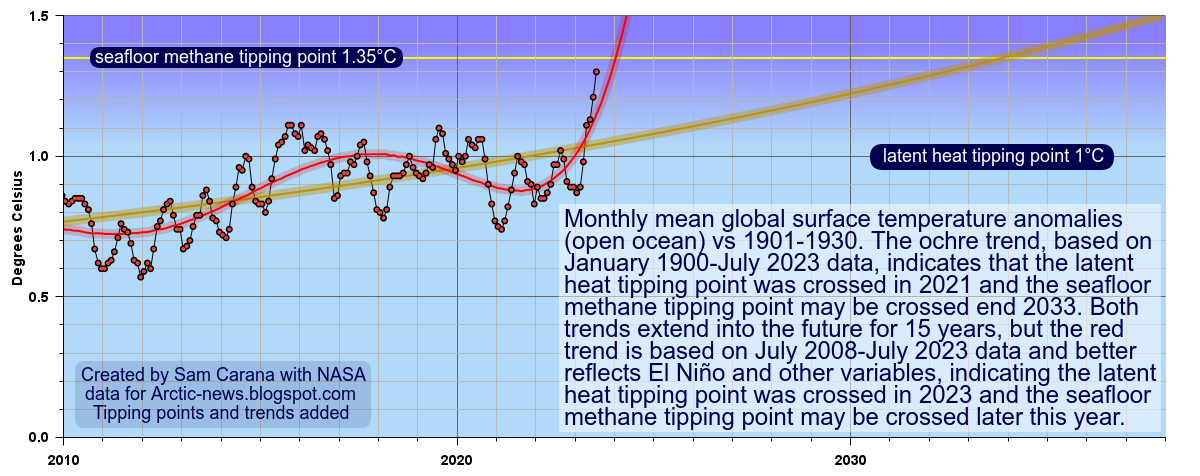
The image below shows why this recent sea surface temperature rise is so worrying. The image below is based on NASA data for monthly mean global surface temperature anomalies (open ocean) vs 1901-1930. The ochre trend, based on January 1900-July 2023 data, indicates that the latent heat tipping point was crossed in 2021 and the seafloor methane tipping point may be crossed by the end of 2033. Both trends extend into the future for 15 years, but the red trend is based on July 2008-July 2023 data and better reflects El Niño and other variables, and this red trend indicates that the latent heat tipping point was crossed in 2023 and the seafloor methane tipping point may be crossed later this year.
[ click on images to enlarge ]
Sea ice constitutes a latent heat buffer, consuming incoming heat as it melts. While the ice is melting, all energy (at 334 J/g) goes into changing ice into water and the temperature remains at 0°C (273.15K or 32 °F). Once all ice has turned into water, all subsequent energy goes into heating up the water, and will do so at 4.18 J/g for every 1°C the temperature of the water rises.
Loss of this buffer is linked to subsequent destabilization of methane hydrates. So, there are two tipping points that are linked, and the latent heat tipping point gets crossed in the Arctic before the seafloor methane tipping point gets reached.
The situation is particularly precarious in the Arctic, as the North Atlantic Ocean is very hot and the Gulf Stream keeps pushing hot water toward the Arctic Ocean, while Arctic sea ice has become very thin. The image on the right, from Uni of Bremen, shows that on July 25, 2023, there was virtually no Arctic sea ice left that was more than 30 cm thick.
The latent heat tipping point is the point where Arctic sea ice loss is such that further incoming ocean heat that was previously consumed as Arctic sea ice melted, instead gets absorbed by the Arctic Ocean.
[ sea surface temperature anomaly ]
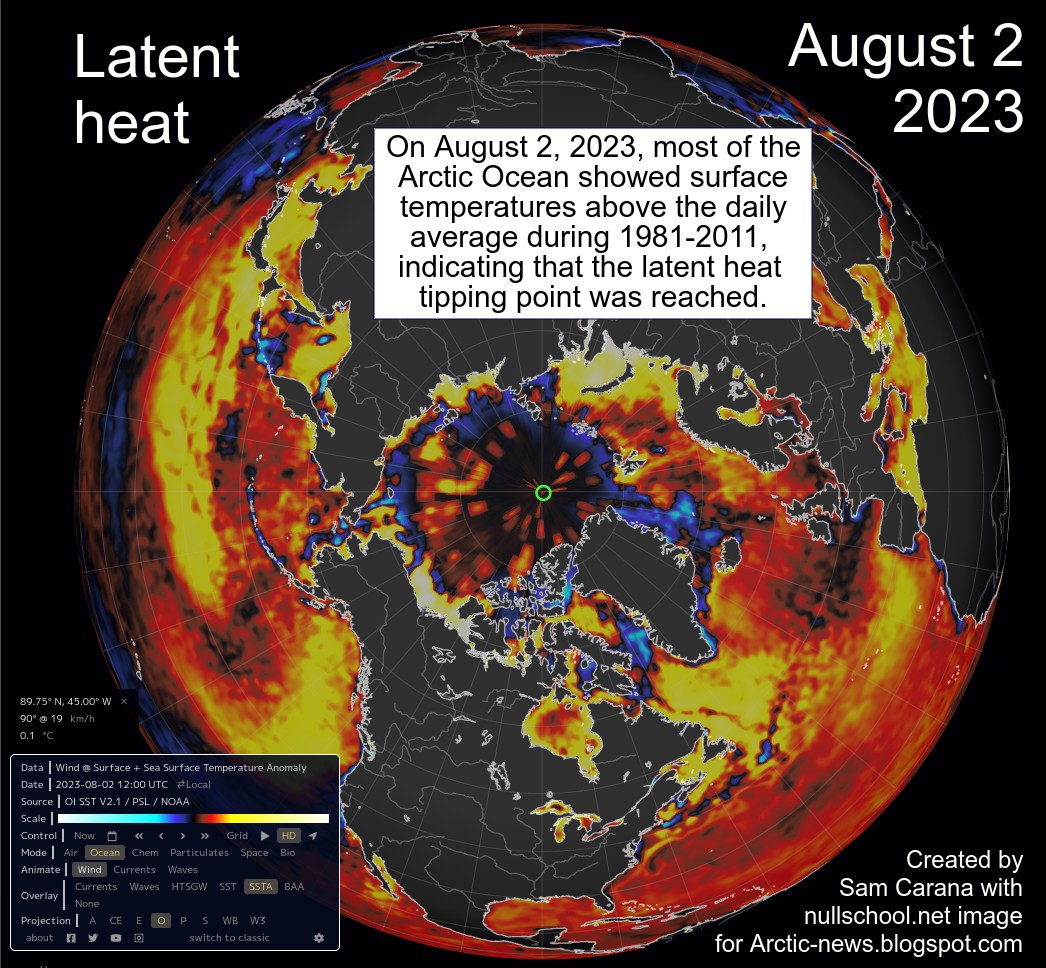
The image on the right, adapted from nullschool.net, shows that on August 2, 2023, most of the Arctic Ocean was showing surface temperatures above the daily average during 1981-2011, indicating that the latent heat tipping point was reached. The latent heat tipping point is estimated to correspond with an ocean temperature anomaly of 1°C above the long term average, 1901-1930 on the above image.
The image underneath, also from nullschool.net, shows the situation on August 20, 2023, when temperatures at the North Pole had been above zero for more than a day and temperatures were forecast to go below zero only twice briefly afterwards, for the period up to August 24, 2023 19:00 UTC (which is as far as the forecast went at the time.
[ surface temperature ]
This is a further indication that the latent heat tipping point has been reached and that no more heat can be consumed by sea ice melting.
How much sea ice is left? What does the sea ice look like, near the North Pole? Satellite images can give a good impression, but clouds can obscure the view. A clearer view can be obtained by comparing images over several days.
An animation can reveal how much, or rather how little sea ice is left, and to what extent water of the Arctic Ocean is visible.
[ Satellite view, click on images to enlarge ]
The animation on the right is made with four NASA Worldview images, showing the situation on August 11, 15, 16 and 19, 2023.
The second tipping point, the seafloor methane tipping point, occurs as more heat reaches the seafloor where it destabilizes hydrates contained in sediments at the seafloor.
This tipping point comes with multiple self-reinforcing feedback loops, such as explosive growth in methane volume setting off further destabilization, rapid rise of Arctic temperatures, loss of permafrost and loss of albedo, and release of further greenhouse gases.
Crossing of the seafloor methane tipping point will occur later than crossing of the latent heat tipping point, so the seafloor methane tipping point is estimated to correspond with a higher ocean temperature anomaly.
The current situation is particularly precarious in the Arctic, as the North Atlantic Ocean is very hot and the Gulf Stream keeps pushing hot water toward the Arctic Ocean, while Arctic sea ice has become very thin (image right) and the latent heat tipping point has been crossed.
As the temperature of the Arctic Ocean keeps rising, more heat can reach sediments located at the seafloor, since much of the Arctic Ocean is very shallow and sediments at the seafloor of the Arctic Ocean can contain vast amounts of methane.
The danger is that further heat will destabilize hydrates in these sediments, leading to explosive eruptions of methane, as its volume increases 160 to 180-fold when leaving the hydrates, and resulting in huge eruptions of methane both from the destabilizing hydrates and from methane that is present in the form of free gas underneath the hydrates.
The above image, from an earlier post, illustrates that warnings have been given before about the danger of these two tipping points getting crossed in the Arctic. In the above image, the trends are based on annual sea surface temperature data for the Northern Hemisphere. The seafloor methane tipping point is estimated to get crossed when the ocean temperature anomaly on the Northern Hemisphere goes beyond 1.35°C above its long term average.
The Argo Float 7900549 compilation image below illustrates that the highest water temperatures in the Arctic Ocean can occur at a depth of approximately 100 meters. The image shows temperatures as high as 5°C at that altitude.
Stronger winds along the path of the Gulf Stream can at times speed up sea currents that travel underneath the surface. As a result, huge amounts of hot, salty water can travel from the Atlantic Ocean into the Arctic Ocean, abruptly pushing up temperatures and salinity levels at the bottom of the Arctic Ocean, which in many places is very shallow.
The above image shows details of Argo float 9701007, further illustrating the danger that heat can reach the seafloor. North of Norway, where the water is less than 400 m deep, temperatures higher than 5°C show up throughout the vertical water column, up to August 10, 2023, when temperatures above 11°C were recorded close to the sea surface. The colored inset also shows that greater mixing down of heat occurred from October to December 2022, as the sea ice started to return and seal off the surface, preventing heat transfer from ocean to atmosphere, as also discussed at FAQ #11.
Below is another image adapted from Climate Reanalyzer, showing that the sea surface temperature of the North Atlantic Ocean has for months been much higher for the time of year than it was in previous years on record. Eight causes behind this have been discussed in an earlier post. The image below shows the situation on August 28, 2023, with the North Atlantic sea surface temperature reaching a record high of 25.34°C or 77.61°F.
The image below, adapted from NOAA, shows how the Gulf Stream is pushing ocean heat toward the Arctic Ocean, while sea surface temperatures show up as high as 33.6°C or 92.48°F on August 17, 2023.
[ 2022 animation ]
Studies, some of them dating back more than two decades, show that over the shallow East Siberian Arctic Shelf (ESAS) winds at times can mix the water column from the top to the bottom. A 2005 study of the ESAS led by Igor Semiletov recorded water temperatures at the seafloor, in September 2000, of 4.7°C at 20m depth at one location and 2.11°C at 41m depth at another location, with salinity levels of 29.7‰ and of 31.7‰, respectively.
A deformed Jet Stream, in combination with a cyclone, could similarly result in strong winds abruptly pushing a huge amount of heat through the Bering Strait into the Arctic Ocean.
The animation on the right shows how remnants of Typhoon Merbok were forecast to enter the Arctic Ocean through the Bering Strait from September 17 to 19, 2022.
The image below, adapted from Climate Reanalyzer, shows that the (2-meter) air temperature in the Arctic was 3.79°C on August 25, 2023, a record high for the time of year and 2.08°C higher than the 1979-2011 mean for that day.
The image below illustrates how incoming ocean heat that previously was consumed in the process of melting of the sea ice, is now causing the water of the Arctic Ocean to heat up, with more heat reaching the seafloor of the Arctic Ocean, which has seas that in many places are very shallow.
[ Latent heat loss, feedback #14 on the Feedbacks page ]
Further adding to the danger is that destabilization of methane hydrates can cause huge amounts of methane to erupt with great force in the form of plumes. Consequently, little of the methane can be broken down in the water by microbes, while there is very little hydroxyl in the atmosphere over the Arctic Ocean to break down the methane that enters the atmosphere.
Ominously, some very high methane levels were recorded recently at Barrow, Alaska, as illustrated by the NOAA images below.
The most recent monthly methane average recorded at Barrow, Alaska, is above 2080 parts per billion.
In the video below, Guy McPherson describes the dire situation.
Climate Emergency Declaration
A catastrophe of unimaginable proportions is unfolding. Life is disappearing from Earth and runaway heating could destroy all life. At 5°C heating, most life on Earth will have disappeared. When looking only at near-term human extinction, 3°C will likely suffice.
The Blob is a large mass of water with relatively high heat content, floating at the surface and underneath the surface of the North Pacific Ocean. The Blob did appear several times before, including in 2016, which was a strong El Niño year. The above image shows high sea surface temperature anomalies in the North Pacific on August 10, 2023, raising the question of whether this constitutes a return of the Blob.
As temperatures rise, the Arctic is heating more rapidly than the rest of the world. The narrowing temperature difference between the Arctic and the Tropics is weakening the speed at which the jet stream circumnavigates Earth and this is making the jet stream more wavy.
In a 2012 study, Jennifer Francis et al. warned that this makes atmospheric blocking events in the Northern Hemisphere more likely, aggravating extreme weather events related to stagnant weather conditions, such as droughts, flooding and heatwaves. The Blob appears to be the marine version of a heatwave on land.
The image below shows that, on August 12, 2023, sea surface temperatures were as much as 7°C or 12.6°F higher than 1981-2011 in the Pacific Ocean (at the green circle, follow the arrow). A strongly deformed Jet Stream shows many circular wind patterns, prolonging, intensifying and increasing the occurrence of extreme weather events such as accumulation of heat during heatwaves.
Is the Kuroshio Current slowing down?
The Kuroshio Current is an ocean current that carries heat along its path in the North Pacific, similar to the Gulf Stream in the North Atlantic Ocean. Is the Kuroshio Current slowing down as temperatures rise and is such slowing down causing hot water to accumulate in the western part of the North Pacific, leading to a return of a new Blob moving across the North Pacific toward the coast of North America?
The North Atlantic has been experiencing record high sea surface temperatures recently. A return of the Blob increases the danger of more heat reaching sediments at the seafloor of the Arctic Ocean.
[ 2022 animation ]
The animation on the right shows how remnants of Typhoon Merbok were forecast to enter the Arctic Ocean through the Bering Strait from September 17 to 19, 2022.
Studies, some of them dating back more than two decades, show that over the shallow East Siberian Arctic Shelf (ESAS) winds at times can mix the water column from the top to the bottom. A 2005 study of the ESAS led by Igor Semiletov recorded water temperatures at the seafloor, in September 2000, of 4.7°C at 20m depth at one location and 2.11°C at 41m depth at another location, with salinity levels of 29.7‰ and of 31.7‰, respectively.
A deformed Jet Stream, in combination with a cyclone, could result in strong winds abruptly pushing a huge amount of heat through the Bering Strait into the Arctic Ocean. This could cause methane hydrates to destabilize and huge amounts of methane to erupt from the seafloor and enter the atmosphere.
The world temperature was at a record high 17.23°C or 63.01°F on July 6, 2023 (black). The maximum temperature in 2022 (orange) and in 2016 (grey) was 16.92°C or 62.46°F (on July 24, 2022, and on August 13+14, 2016). The year 2016 is important, since there was a strong El Niño in 2016 and we're now again in an El Niño.
As the image below adds, the 17.23°C temperature recorded on July 6, 2023, is a daily value, but if indicative for July 2023, the closest value for CMIP5 RCP8.5 would be 17.255°C, projected to occur in July 2035 (13 years away from now).
[ The international consortium Coupled Model Intercomparison Project (CMIP) defines scenarios for use in climate projections. Its CMIP5 scenario (an average of 39 models of near-surface temperature and precipitation, and mean sea level pressure) can be used in combination with Representative Concentration Pathways (RCP). ]
Why is the temperature rising so fast?
The image below mentions a number of contributors, with charts added from an earlier post.
[ click on images to enlarge ]
1. Emissions are high and greenhouse gas levels keep rising, increasing Earth's Energy Imbalance.
2. We did come out of a La Niña that has for years been suppressing temperatures and we are now in an El Niño. A 2023 study led by Tao Lian predicts the current El Niño to be strong. Moving from the bottom of a La Niña to the peak of a strong El Niño could make a difference of more than half a degree Celsius, as discussed in an earlier post. Temperature anomalies can be very high during an El Niño. The image below shows that February 2016 on land was 3.28°C (5.904°F) hotter than 1880-1896, and 3.68°C (6.624°F) hotter compared to February 1880 on land. Note that 1880-1896 is not pre-industrial, the rise will be even larger when using a genuinely pre-industrial base.
The above image, from an earlier post, adds a poignant punchline: Looking at global averages over long periods is a diversion, peak temperature rise is the killer!
[ click on images to enlarge ]
3. The June 2023 number of sunspots is more than twice as high as predicted, as illustrated by the image on the right, from an earlier post and adapted from NOAA. If this trend continues, the rise in sunspots forcing from May 2020 to July 2025 may well make a difference of more than 0.25°C, a recent analysis found.
4. The January 2022 submarine volcano eruption near Tonga did add a huge amount of water vapor to the atmosphere, as discussed in an earlier post and also at facebook. Since water vapor is a potent greenhouse gas, this further contributes to speeding up the temperature rise. A 2023 study calculates that the eruption will have a warming effect of 0.12 Watts/m² over the next few years.
5. There are further things that contribute to the temperature rise, such as reductions of Sahara dust and of sulfur aerosols co-emitted with fossil fuel combustion that previously masked the temperature rise.
The above points apply to the global temperature rise. The North Atlantic sea surface temperature is rising even stronger than the global rise, due to the following points:
The narrowing temperature difference between the Arctic and the Tropics is slowing down the flow of air from the Tropics to the Arctic, deforming the Jet Stream, and that can strongly prolong and amplify extreme weather events in the Northern Hemisphere, and result in stronger heating up of the North Atlantic.
This is also slowing down AMOC, causing more hot water to accumulate in the North Atlantic and to reach the Arctic Ocean, resulting in strong melting of sea ice from below and thus strong thinning.
Additionally, as temperatures rise, increased stratification further speeds up the sea surface temperature rise.
As the North Atlantic Ocean heats up and as cold air from the Arctic can more deeply descend over North America (due to Jet Stream deformation), the temperature difference between land and oceans widens, especially during the Northern Winter, and this can result in storms abruptly pushing strong wind along the path of the Gulf Stream, pushing ocean heat into the Arctic Ocean, with stronger evaporation occurring over the North Atlantic and with stronger precipitation (rain, snow, etc.) occurring further down the path of the Gulf Stream. This stronger evaporation cools the surface of the North Atlantic.
This cooling, together with cooling from increased meltwater, also results in formation of a cold freshwater lid on top of the North Atlantic, also because freshwater is less dense than saltwater.
This lid on top of the North Atlantic enables more hot water to flow underneath this lid into the Arctic Ocean, with the danger that more heat will reach sediments at the seafloor of the Arctic Ocean and destabilize hydrates, resulting in eruption of huge amounts of methane.
This sea surface cooling has until now covered up the full extent of the rise in ocean heat in the North Atlantic, but - as illustrated by the image below - the continued rise in ocean heat now is overwhelming this cooling.
The image below shows that the North Atlantic sea surface temperature was 23.3°C on June 21, 2023 (on the black line), 0.9°C higher than the 22.4°C on June 21, 2022 (on the orange line). A record high of 24.9°C was reached on September 4, 2022, even while La Niña at the time was suppressing the temperature, whereas there now is an El Niño, so the outlook is grim.
Feedbacks and developments that make the outlook even more threatening
Globally, methane rose to 1924.99 ppb in December 2022. The image below has a polynomial trend added that is based on April 2018 to December 2022 NOAA global methane data and is pointing at 1200 ppm CO₂e (carbon dioxide equivalent) getting crossed in 2027. The Clouds Tipping Point, at 1200 ppm CO₂e, could be crossed and this on its own could result in a further rise of 8°C. This tipping point could be crossed as early as in 2027 due to forcing caused by the rise in methane alone. When further forcing is taken into account, this could happen even earlier than in 2027.
On February 22, 2023, Antarctic sea ice area was only 1,050,708 km² in size, as discussed in an earlier post. Since that time, Antarctic sea ice has been growing at a much slower pace than in previous years. On July 4, 2023, Antarctic sea ice area was 9,385,739 km² in size, and sea ice has actually been falling in size recently, as illustrated by the Nico Sun image on the right. Less sea ice means that sunlight previously reflected back into space by the sea ice is now instead getting absorbed by the Southern Ocean, in a self-reinforcing feedback loop that results in further sea ice loss, in turn further speeding up the temperature rise and making the weather ever more extreme.
This dire situation spells bad news regarding the temperature rise to come, the more so since, on top of these dire conditions, there are feedbacks and further developments that make the outlook even more threatening.
A huge temperature rise could be triggered abruptly, due to a multitude of feedbacks and further developments that could strongly deteriorate the situation even further, such as by causing more water vapor to get added to the atmosphere, as discussed at Moistening Atmosphere and Extreme Heat Stress.
Changes in aerosols are discussed in earlier posts such as this post and this post. The upcoming temperature rise on land on the Northern Hemisphere could be so strong that much traffic, transport and industrial activity will grind to a halt, resulting in a reduction in cooling aerosols that are now masking the full wrath of global heating. These are mainly sulfates, but burning of fossil fuel and biomass also emits iron that currently helps photosynthesis of phytoplankton in oceans, as a 2022 study points out, and less iron means less drawdown of carbon dioxide.
Without these emissions, the temperature is projected to rise strongly, while there could be an additional temperature rise due to an increase in warming aerosols and gases as a result of more biomass and waste burning and forest fires.
The image on the right, from the extinction page, includes a potential rise of 1.9°C by 2026 as the sulfate cooling effect falls away and an additional rise of 0.6°C due to an increase in warming aerosols by 2026, as discussed in this post and earlier posts.
The image on the right indicates that the rise from pre-industrial to 2020 could be as much as 2.29°C. Earth's energy imbalance has grown since 2020, so the rise up to now may be even higher.
Climate Tipping Points and further Events and Developments
The temperature could also be pushed up further due to reductions in the carbon sink on land. An earlier post mentions a study that found that the Amazon rainforest is no longer a sink, but has become a source, contributing to warming the planet instead; another study found that soil bacteria release CO₂ that was previously thought to remain trapped by iron; another study found that forest soil carbon does not increase with higher CO₂ levels; another study found that forests' long-term capacity to store carbon is dropping in regions with extreme annual fires; another earlier post discussed the Terrestrial Biosphere Temperature Tipping Point, coined in a study finding that at higher temperatures, respiration rates continue to rise in contrast to sharply declining rates of photosynthesis, which under business-as-usual emissions would nearly halve the land sink strength by as early as 2040.
This earlier post also discusses how CO₂ and heat taken up by oceans can be reduced. A 2021 study on oceans finds that, with increased stratification, heat from climate warming less effectively penetrates into the deep ocean, which contributes to further surface warming, while it also reduces the capability of the ocean to store carbon, exacerbating global surface warming. A 2022 study finds that ocean uptake of CO₂ from the atmosphere decreases as the Meridional Overturning Circulation slows down. An earlier analysis warns about growth of a layer of fresh water at the surface of the North Atlantic resulting in more ocean heat reaching the Arctic Ocean and the atmosphere over the Arctic, while a 2023 study finds that growth of a layer of fresh water decreases its alkalinity and thus its ability to take up CO₂, a feedback referred to as the Ocean Surface Tipping Point.
The above image depicts only one sequence of events, or one scenario out of many. Things may eventuate in different orders and occur simultaneously, i.e. instead of one domino tipping over the next one sequentially, many events may occur simultaneously and reinforce each other. Further events and developments could be added to the list, such as ocean stratification and stronger storms that can push large amounts of warm salty water into the Arctic Ocean.
While loss of Arctic sea ice and loss of Permafrost in Siberia and North America are often regarded as tipping points, Antarctic sea ice loss, and loss of the snow and ice cover on Greenland, on Antarctica and on mountaintops such as the Tibetan Plateau could also be seen as tipping points. Another five tipping points are:
Altogether, the rise from pre-industrial to 2026 could be more than 18.44°C, while humans are likely to go extinct with a rise of 3°C, as illustrated by the image below, from an analysis discussed in an earlier post.
This should act as a warning that near-term human extinction could occur soon. In the video below, Guy McPherson discusses how fast humans could go extinct.
The animation below shows that, while clouds can obscure a closer look, sea ice is clearly very thin with the thickest ice breaking up near the top of Greenland, some 750 km from the North Pole.
The Uni of Bremen image below shows Arctic sea ice thickness on June 28, 2023.
The danger is that, as El Niño strengthens, there will be massive loss of Arctic sea ice over the coming months, with water in the Arctic Ocean heating up strongly due to loss of the latent heat buffer and loss of albedo, while huge amounts of ocean heat keep entering the Arctic Ocean from the Atlantic Ocean and the Pacific Ocean.
The image below shows that the North Atlantic sea surface temperature was 23.5°C on June 28, 2023 (on the black line), 0.9°C higher than the 22.6°C on June 28, 2022 (on the orange line). A record high of 24.9°C was reached on Sept. 4, 2022, even while La Niña was suppressing the temperature. This time, there's an El Niño.
The image below, adapted from NOAA, shows ocean heat moving toward the Arctic along the path of the Gulf Stream on June 25, 2023, while sea surface temperatures on the map are as high as 32.6°C.
In addition, the Jet Stream is strongly deformed, and this threatens to strengthen heatwaves extending over the Arctic Ocean and causing hot water from rivers to enter the Arctic Ocean, and to strengthen storms accelerating the flow of ocean heat into the Arctic Ocean, while fires and storms contribute to darkening of the sea ice, further speeding up its demise.
The danger is that, as El Niño strengthens and as ocean heat keeps entering the Arctic Ocean from the Atlantic Ocean and the Pacific Ocean, a huge amount of heat will abruptly be pushed into the Arctic Ocean.
This danger is illustrated by the image on the right, from an earlier post, showing the Jet Stream pushing wind at a speed of 126 km/h (78 mph) up through Fram Strait (at the green circle) into the Arctic Ocean on June 21, 2023.
This situation threatens to cause massive loss of Arctic sea ice over the coming months, with water in the Arctic Ocean heating up strongly due to loss of the latent heat buffer and loss of albedo.
This in turn threatens to trigger methane eruptions from the seafloor of the Arctic Ocean, a threat that has been described many times before, such as here, here and here.
[ Latent heat loss, feedback #14 on the Feedbacks page ]
Loss of Arctic sea ice albedo, loss of the latent heat buffer and eruption of seafloor methane all constitute tipping points that threaten to abruptly accelerate the temperature rise in the Arctic, further speeding up loss of permafrost in Siberia and North America and thus threatening to trigger further releases of greenhouse gases.
In addition, there are further events and developments that could unfold and make things even worse.
The upcoming temperature rise on land on the Northern Hemisphere could be of such a severity that much traffic, transport and industrial activity will grind to a halt, resulting in a reduction in cooling aerosols that are now masking the full wrath of global heating. Without these cooling aerosols, the temperature is projected to rise strongly, while there could be an additional temperature rise due to an increase in warming aerosols and gases as a result of more biomass and waste burning and forest fires. Furthermore, as traffic slows down, there will be less nitrogen oxide emissions, which could result in less hydroxyl to curtail methane.
The bar on the right depicts the threat, as discussed at the Extinction page.


