Showing posts with label jet stream. Show all posts

Sunday, February 9, 2020

Why stronger winds over the North Atlantic are so dangerous

The image below shows high temperatures over Antarctica. News reports show that temperatures as high as 18.3°C or 65°F were recently recorded on Antarctica. The image also shows high temperatures for the time of year over the North Atlantic, with strong winds along the path of the Gulf Stream.

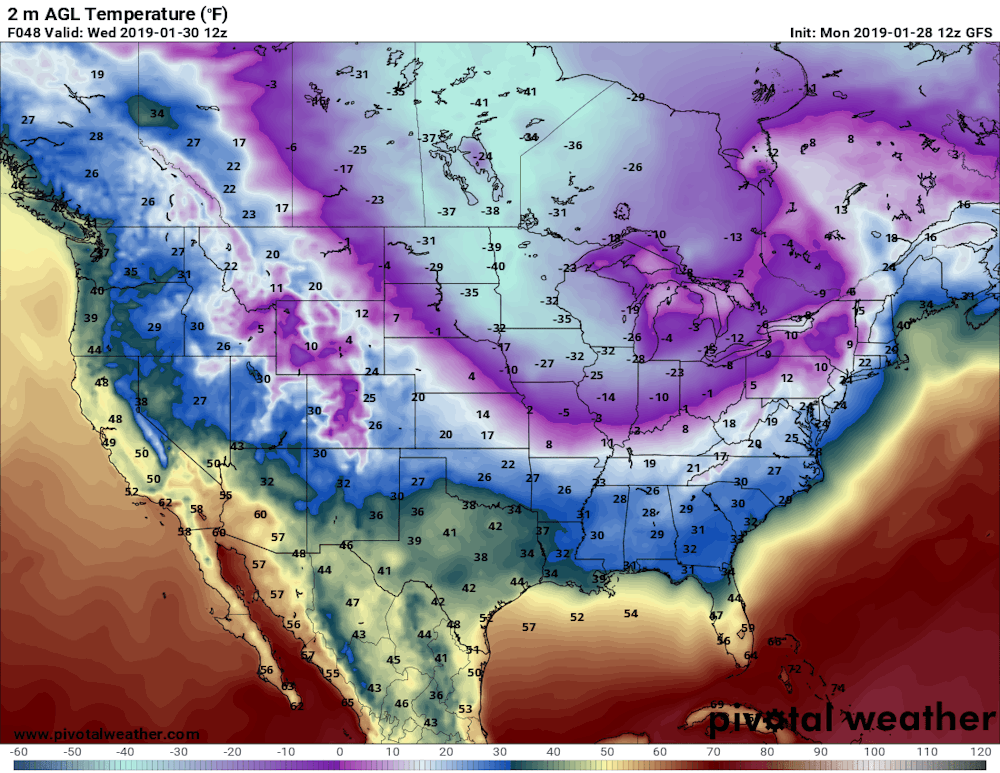
Wind and temperature on February 8, 2020 at 18:00 UTC, near sea level (~100m, at 1000hPa)
The image below shows that wind speeds as high as 430 km/h or 267 miles per hour (mph) were recorded (at 250 hPa, jet stream, at green circle).

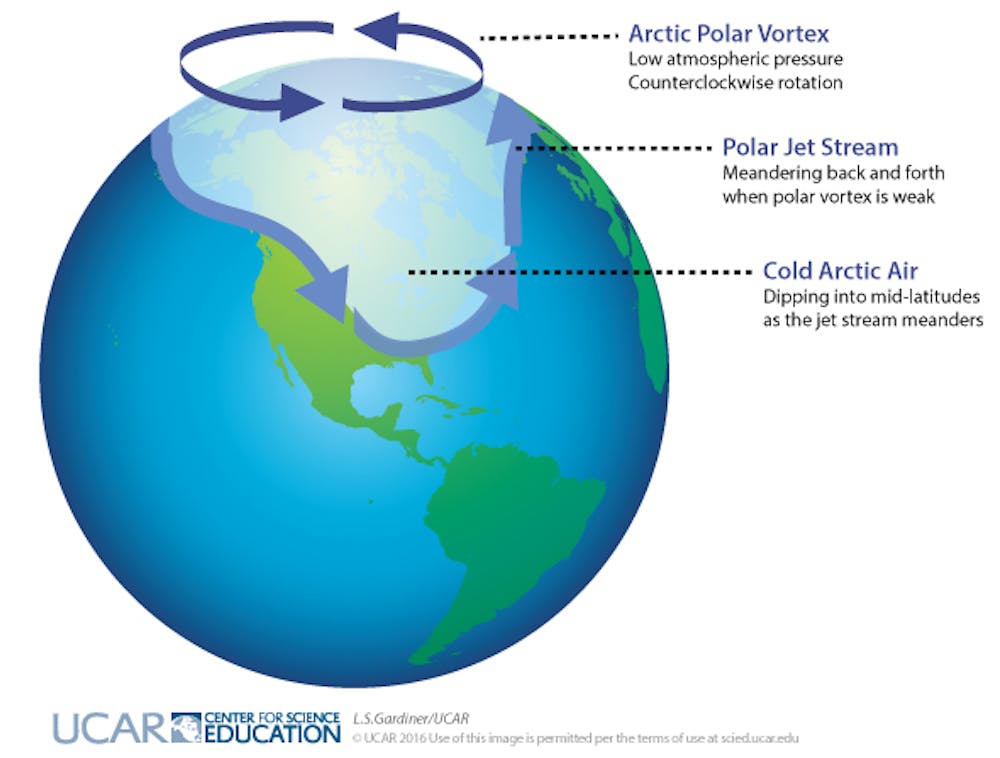
Wind on February 8, 2020 at 18:00 UTC, at 250 hPa (jet stream)
Above image also shows that Instantaneous Wind Power Density at the time was as high as 330.1 kW/m² (at the green circle). This is almost as strong as the wind was in 2015. Then, the Jet Stream at a nearby location reached a similar speed while Instantaneous Wind Power Density was slightly higher, at 338.3 kW/m².

So, why are stronger winds over the North Atlantic so dangerous?


Emissions by people heat up the air, which heats up oceans and makes winds stronger, in turn speeding up global ocean currents.

A recent study found increased kinetic energy in about 76% of the upper 2,000 meters of global oceans, as a result of intensification of surface winds since the 1990s.

As oceans heat up, more water evaporates from the sea surface. This evaporation will cool the sea surface somewhat, thus making that the sea surface can be colder than the water underneath the sea surface. Some of the water vapor will return to the ocean in the form of precipitation, but for each degree Celsius of warming, the atmosphere will hold 7% more water vapor, so much of the water vapor will remain in the atmosphere.

More water vapor in the atmosphere will further speed up global heating, since water vapor is a potent greenhouse gas.

Much of the water vapor will also get blown further along the path of the Gulf Stream in the direction toward the Arctic before precipitating, thus contributing - along with meltwater - to the formation of a cold freshwater lid at the surface of the ocean.

Stronger winds along the path of the Gulf Stream can make huge amounts of warm, salty water travel underneath this cold freshwater lid toward the Arctic, pushing up temperatures and salinity levels at the bottom of the Arctic Ocean and threatening to destabilize methane hydrates that are contained in sediments at the seafloor of the Arctic Ocean.

In summary, stronger winds can trigger huge eruptions of methane. Another recent study found that Arctic permafrost thaw plays a greater role in climate change than previously estimated. All this should be reason to take strong action to reduce this danger.

Emissions keep rising

Sadly, emissions show no sign of decline. The daily average CO₂ level at Mauna Loa, Hawaii was 416.08 ppm on February 10, 2020, higher than it has been for millions of years.


Since the annual peak is typically reached in May, even higher levels can be expected soon.


During the Paleocene–Eocene Thermal Maximum (PETM), about 55.5 million years ago, massive amounts of carbon dioxide were released into the atmosphere. The period lasted for some 200,000 years and global temperatures increased by 5–8°C. From the way emissions are rising now, it looks like we could reach even higher CO₂e forcing soon.


Indeed, the situation at Barrow, Alaska, doesn't look better, as illustrated by the image below, showing CO₂ levels up to February 13, 2020.


Very worrying is the rise in methane levels, as illustrated by the image below.


The image below shows methane levels at Barrow, Alaska, up to February 13, 2020.


High methane levels were recorded over the East Siberian Arctic Shelf (ESAS) by the MetOp-2 satellite on February 10 & 11, 2020, pm at 469 mb.


In the video below, recorded January 3, 2020, Guy McPherson and Josef Lauber discuss the track we're on.


Below is a video of an earlier discussion (February 25, 2019) between Guy McPherson and Josef Lauber.


The situation is dire and calls for immediate, comprehensive and effective action, as described in the Climate Plan.


Links

• Climate Plan
https://arctic-news.blogspot.com/p/climateplan.html

• News release: Global ocean circulation is accelerating from the surface to the abyss
https://www.eurekalert.org/pub_releases/2020-02/aaft-goc020320.php

• Deep-reaching acceleration of global mean ocean circulation over the past two decades - by Shijian Hu et al.
https://advances.sciencemag.org/content/6/6/eaax7727

• Arctic permafrost thaw plays greater role in climate change than previously estimated
https://www.colorado.edu/today/2020/02/03/arctic-permafrost-thaw-plays-greater-role-climate-change-previously-estimated

• The Arctic’s thawing ground is releasing a shocking amount of dangerous gases
https://www.nationalgeographic.com/science/2020/02/arctic-thawing-ground-releasing-shocking-amount-dangerous-gases

• Cold freshwater lid on North Atlantic 
https://arctic-news.blogspot.com/p/cold-freshwater-lid-on-north-atlantic.html

• Carbon release through abrupt permafrost thaw - by Merritt Turetsky et al.
https://www.nature.com/articles/s41561-019-0526-0

• NOAA Global CH4 Monthly Means
https://www.esrl.noaa.gov/gmd/ccgg/trends_ch4


Thursday, August 8, 2019

July 2019 Hottest Month On Record


The July 2019 temperature was on a par with, and possibly marginally higher than, that of July 2016, according to a World Meteorological Organization (WMO) news release pointing an image by the Copernicus Climate Change Programme that is used as the background for above image.

Previously, July 2016 was the hottest July on record with a global land and ocean temperature of 16.67°C (62.01°F), or 3.25°C above the pre-industrial temperature of 13.42°C (56.16°F) and surpassing the record set before that, in July 2015.

The July 2019 Surface Temperature was 16.7°C in real temperatures (as opposed to anomalies), as illustrated by the image on the right, supplied by James Hansen and constructed using Dr. Phil Jones climatology and GISS 250 km smoothing of anomalies.

The image also shows, James Hansen adds, that the monthly mean of the daily mean (not daily maximum) exceeded 35°C (95°F) in parts of North Africa and the Middle East.

The month July typically is the hottest month of the year. July 2019 was 2.34°C (or 4.21°F) hotter than the 1980-2015 annual global mean, and July 2019 was the hottest July on record, making it the hottest month on record to date.

According to NASA data, July 2016 was 2.26°C hotter than the 1980-2015 annual global mean, and August 2016 was actually the previously hottest month on record with 2.31°C above the 1980-2015 annual mean, so August 2019 could be even hotter, which is quite remarkable given that we're currently in an El Niño-neutral period.

There's a spread of more than 3°C between the coldest and hottest monthly temperatures, in line with the seasonal cycle. Since the land/sea ratio is larger on the Northern Hemisphere and land heats up faster than oceans, July typically is the hottest month of the year, so the annual mean temperature for the year 2019 will be somewhat lower than the temperature for July 2019.


Above image takes another perspective, showing NASA Land and Ocean Temperature Index (LOTI) data that are adjusted 0.78° to reflect a 1750 baseline (as opposed to NASA's default 1951-1980 baseline), to reflect ocean air temperatures (as opposed to sea surface temperatures) and higher polar anomaly (to better reflect absent data).

Two trends are added, based on the adjusted data, as described in an earlier analysis. The blue long-term trend is based on 1880-July 2019 data and points at a 3°C (or 5.4°F) rise by 2026. The red short-term trend is based on 2012-July 2019 data, to better illustrate El Niño/La Niña variability and the danger that large methane eruptions from the seafloor of the Arctic Ocean could result in near-term human extinction.

NASA's LOTI anomaly of 0.93°C above 1951-1980 for July 2019 becomes 1.71°C above pre-industrial when adjusted as described above. The trends also show that it could be 1.85°C above pre-industrial, in line with the earlier analysis that already pointed at a potential mean temperature for 2019 of 15.27°C, or 1.85°C above pre-industrial. Depending on what will happen in the Arctic and on further variables such as the strength of El Niño over the remainder of the year, 2019 could even cross the 2°C guardrail that politicians at the Paris Agreement pledged would not be crossed.


Above image shows the worrying rise of Northern Hemisphere sea surface temperature anomalies from the 20th century average, with the added trend illustrating the danger that this rise will lead to Arctic sea ice collapse and large methane eruptions from the seafloor of the Arctic Ocean, further accelerating the temperature rise.

Unbearable heat

As temperatures keep rising, there are places on the northern hemisphere where the July heat is becoming ever harder to bear.

The image on the right shows that on July 29, 2019, it felt like it was as hot as 57.2°C or 135°F in China (in the area marked by the green circle).

How could it get this hot? As the image underneath on the right shows, the temperature in that area was 35.1°C or 95.1°F (at the right circle), while it was much hotter at some places elsewhere in China, e.g. it was 41.5°C or 106.6°F at the left circle on July 29, 2019.

What made the weather so hard to bear was a combination of high temperature and high relative humidity, which was 81% in the area at the circle on the right at the time.

The jet stream is becoming ever more deformed as the Arctic heats up faster than the rest of the world. On July 29, 2019, the jet stream was all over the place, with a strong presence north of the circle, which made warm, moist air from the south move over China.

Since the Arctic continues to heat up faster than the rest of the world, such situations are likely to become more common. As noted in an earlier post, cyclones can increase humidity, making conditions worse. New research has meanwhile emerged pointing at the increasing risk associated with the combination of cyclones and heatwaves.

Wet Bulb Temperature

The temperature in that area of 35.1°C, at 81% relative humidity and a pressure level of 1004 hPa, translates into a wet bulb temperature of 32.11°C.

Had the temperature remained at 35.1°C, but had relative humidity kept rising to 100%, i.e. rainfall, the wet bulb temperature threshold of 35°C would have been exceeded (35.01°C). Alternatively, had relative humidity remained at 81%, but had the temperature kept rising to 38.2°C, the wet bulb temperature threshold of 35°C would equally have been exceeded (35.07°C), showing how dangerous the situation is. A wet bulb temperature of 35°C can be lethal, as the human body will be unable to lose heat, even when the wind is strong and no matter how much one drinks or sweats.

The situation is dire and calls for comprehensive and effective action, as described in the Climate Plan.


Links

• Another exceptional month for global average temperatures, Copernicus Climate Change Service, ECMWF
https://climate.copernicus.eu/another-exceptional-month-global-average-temperatures

• July matched, and maybe broke, the record for the hottest month since analysis began
https://public.wmo.int/en/media/news/july-matched-and-maybe-broke-record-hottest-month-analysis-began

• NOAA Global Climate Report - July 2016
https://www.ncdc.noaa.gov/sotc/global/201607

• July 2019 Global Temperature Update, by James Hansen
http://www.columbia.edu/~mhs119/Temperature/Emails/July2019.pdf

• An emerging tropical cyclone–deadly heat compound hazard, by Tom Matthews et al. (2019)
https://www.nature.com/articles/s41558-019-0525-6

• Most Important Message Ever
https://arctic-news.blogspot.com/2019/07/most-important-message-ever.html

• Temperature
https://arctic-news.blogspot.com/p/temperature.html

• How Much Warming Have Humans Caused?
https://arctic-news.blogspot.com/2016/05/how-much-warming-have-humans-caused.html

• It could be unbearably hot in many places within a few years time
https://arctic-news.blogspot.com/2016/07/it-could-be-unbearably-hot-in-many-places-within-a-few-years-time.html

• Peaks Matter
https://arctic-news.blogspot.com/2018/08/peaks-matter.html

• Extinction Alert
https://arctic-news.blogspot.com/2019/02/extinction-alert.html

• Climate Plan
https://arctic-news.blogspot.com/p/climateplan.html


Sunday, June 16, 2019

High Temperatures over the Arctic


Melt extent over Greenland was well over 40% on June 12, 2019.

The surface melt map that day (on the right) shows many coastal areas for which data are missing, as indicated by the grey color.

As the June 13, 2019, NASA Worldview satellite image (underneath, right) shows, snow and ice in many coastal areas has melted away.

Four nullschool images are added below. The first one shows air temperatures over Greenland as high as 22.7°C or 72.9°F on June 13, 2019, at 1000 mb. Also note the high temperatures visible over East Siberia and the East Siberian Arctic Shelf (ESAS).

A second nullschool image shows that a temperature of 0.9°C or 33.5°F was recorded at the North Pole on June 15, 2019. Temperatures above the melting point of ice have been recorded at the North Pole for some time now.

The third nullschool image shows that temperatures as high as 30.5°C or 86.8°F are forecast for June 19, 2019, near Tiksi, which is on the coast of Siberia where the Lena River flows into the Laptev Sea and the Arctic Ocean.

What causes this? As the Arctic is heating up faster than the rest of the world, the path of the jet stream is changing. On June 19, 2019, the jet stream is forecast to move from Siberia to the Laptev Sea at speeds as high as 192 km/h or 119 mph.

The satellite image shows smoke from fires getting pushed by strong winds over the Laptev Sea on June 16, 2019. Smoke settling on ice makes it darker, further speeding up the melting.
[ Temperatures over Greenland as high as 22.7°C or 72.9°F on June 13, 2019, at 1000 mb ]
[ Temperature of 0.9°C or 33.5°F at the North Pole on June 15, 2019 ]
[ temperatures as high as 30.5°C or 86.8°F are forecast for June 19, 2019, near Tiksi, Siberia ]
[ jet stream is forecast to move from Siberia to the Laptev Sea as fast as at 192 km/h or 119 mph June 19, 2019 ]
[ fires getting pushed by strong winds on June 16, 2019, over the Laptev Sea (at bottom of image)  ]
In conclusion, temperatures over the Arctic are high. Changes to the jet stream due to the rapid heating of the Arctic are causing hot air to move deep into the Arctic, including over the Laptev Sea all the way to the North Pole, while high temperatures in Siberia are warming up the water of rivers, causing warm water to flow into the Arctic Ocean.  

The situation is dire and calls for comprehensive and effective action, as described in the Climate Plan.


Sunday, April 14, 2019

As Winds Start To Growl


Late last month, wind patterns over the North Pacific and North America resembled a screaming face.

The Arctic was as much as 7.7°C or 13.86°F warmer than 1979-2000, while in parts of Alaska the temperature anomaly was at the top end of the scale, i.e. 30°C or 54°F above 1979-2000.

On April 14, 2019, wind patterns over the North Atlantic resembled a growling face, as highlighted by the red ellipse on the image.

Temperatures over Greenland were as high as 14.9°C or 58.7°F at 1000 hPa at the spot marked by the green circle.

On the left, the image shows winds at 250 hPa dipping over the U.S., enabling cold winds to descend deep down over North America.


Temperatures in Colorado that day were as low as -13.5°C or 7.6°F, as illustrated by above image.

The map below shows the jet streams stretched out from North Pole to South Pole, while the jet stream is also crossing the Equator over the Pacific Ocean.


Meanwhile, Arctic sea ice extent remains at a record low for the measurements at ads.nipr.ac.jp for the time of year. As the image below shows, Arctic sea ice extent was 12.9 million km² on April 14, 2019.


The situation is dire and calls for comprehensive and effective action, as described at the Climate Plan.


Links

• An infinite scream passing through nature
https://arctic-news.blogspot.com/2019/04/an-infinite-scream-passing-through-nature.html

• Arctic Warming Up Fast
https://arctic-news.blogspot.com/2019/03/arctic-warming-up-fast.html

• Climate Plan
https://arctic-news.blogspot.com/p/climateplan.html


Monday, April 1, 2019

An infinite scream passing through nature


Wind patterns on March 30, 2019, resembled what Edvard Munch wrote in his diary in 1892, i.e. "I sensed an infinite scream passing through nature", a feeling Munch expressed in his iconic artwork The Scream, part of which is added on the right in above image.


Indeed, at the end of March 2019, it felt like an infinite scream passing through nature! On March 31, 2019, 12:00 UTC, the Arctic was 7.7°C or 13.86°F warmer than 1979-2000, as above image shows, while in parts of Alaska the anomaly was at the top end of the scale, i.e. 30°C or 54°F above 1979-2000, as discussed in an earlier post.

What caused this to eventuate? Firstly, as the Arctic is warming faster than the rest of the world, the temperature difference between the North Pole and the Equator is narrowing, which is slowing down the overall speed at which the jet stream is circumnavigating Earth, while it also is making the jet stream wavier, enabling warm air from the Atlantic Ocean and Pacific Ocean to more easily enter the Arctic, while also enabling cold air from the Arctic to more easily descend over Asia and North America.


At the same time, global warming is making oceans warmer. Sea surface temperatures were high in the path of the jet stream on March 15, 2019, as above image shows. The sea surface was 10.8°C or 19.4°F warmer than 1981-2011 at the green circle in the left panel of above image. On that day, surface air temperature there was as high as 7.9°C or 46.2°F, and there were cyclonic wind patterns, as the right panel of above image shows.

High sea surface temperatures are causing winds over oceans to get much stronger than they used to be at this time of year.

The image on the right shows that, on March 15, 2019, the jet stream reached speeds as high as 386 km/h or 240 mph at the green circle. These stronger winds then collide at high speed with the air in front of them. This collision occurs with an even greater force, due to low temperatures over North America and due to the lower overall speed at which the jet stream circumnavigates Earth. All this makes that air gets strongly pushed aside toward the Arctic and the Equator.

On March 30, 2019, strong winds pushed warm air into Bering Strait, resulting in temperatures as high as 2.5°C or 36.4°F, as the image below illustrates.


On March 30, 2019, Arctic sea ice extent fell to a record low for the time of year, as discussed in an earlier post. Ominously, methane reached peak levels as high as 2,967 ppb on March 29, 2019, as the image below shows.


With Arctic sea ice extent this low and with temperatures rising relentlessly, fears are that the sea ice won't be able to act as a buffer to absorb heat for long, and that a strong influx of warm, salty water will reach the seafloor of the Arctic Ocean and trigger methane eruptions from destabilizing hydrates.

The situation is dire and calls for comprehensive and effective action, as described at the Climate Plan.


Links

• Arctic Warming Up Fast
https://arctic-news.blogspot.com/2019/03/arctic-warming-up-fast.html

• Climate Plan
https://arctic-news.blogspot.com/p/climateplan.html


Saturday, February 2, 2019

Global Warming is destroying our Liveable Climate

Global Warming is destroying our Liveable Climate. To illustrate what's going on, have a look at the images below, showing low temperatures in Africa at 32°N latitude and high temperatures near Svalbard at about 78°N latitude.

2018 image
2019 image

Surface air temperatures near Svalbard were as high as 5.2°C or 41.4°F near Svalbard on February 3, 2019. At the same time, it was as cold as -3.5°C or 25.6°F in Africa.

The contrast was even more profound on February 4, 2018, when at those same spots it was as cold as -10°C or 13.9°F in Africa, while at the same time it was as warm as 5.8 or 42.4°F near Svalbard.

How is this possible?

As the Arctic warms up faster than the rest of the world, the temperature difference between the North Pole and the Equator narrows, making the jet stream wavier, thus enabling cold air from the Arctic to descend further south, as illustrated by the image on the right, showing instantaneous wind power density at 250 hPa (jet stream) on February 4, 2018.
[ NOAA Climate.gov cartoon by Emily Greenhalgh ]

Furthermore, as oceans get warmer, the temperature difference between land and oceans increases in Winter. This larger temperature difference results in stronger winds that can carry more warm, moist air inland, e.g. into the U.S., as illustrated by the cartoon on the right.

As the jet stream becomes wavier, this also enables more heat to enter the Arctic.

On December 8, 2018, the sea surface temperature near Svalbard was 18.2°C or 32.7°F warmer than 1981-2011. On January 23, 2019, sea surface temperatures at that spot were as high as 18.3°C or 64.9°F, as illustrated by the image on the right, from an earlier post.

A warmer sea surface can cause winds to grow dramatically stronger, and they can push warm, moist air into the Arctic, while they can also speed up sea currents that carry warm, salty water into the Arctic Ocean.

As warmer water keeps flowing into the Arctic Ocean and as air temperatures in the Arctic are now starting to rise on the back of a strengthening El Niño, fears for a Blue Ocean Event are rising.

Rivers can also carry huge amounts of warm water from North America and Siberia into the Arctic Ocean, as these areas are getting hit by ever stronger heatwaves that are hitting the Arctic earlier in the year.

With Arctic sea ice at a low, it won't be able to act as a buffer to absorb heat for long, with the danger that an influx of warm, salty water will reach the seafloor and trigger methane eruptions.

Ominously, the image below shows peak methane levels as high as 2764 ppb on February 2, 2019.


The situation is dire and calls for comprehensive and effective action, as described in the Climate Plan.

See also Dave Borlace's video below:


Links

• How frigid polar vortex blasts are connected to global warming, by Jennifer Francis
https://arctic-news.blogspot.com/2019/02/how-frigid-polar-vortex-blasts-are-connected-to-global-warming.html

• Are record snowstorms proof that global warming isn’t happening?
https://www.climate.gov/news-features/climate-qa/are-record-snowstorms-proof-global-warming-isn%E2%80%99t-happening

• Accelerating growth of carbon dioxide in the atmosphere
https://arctic-news.blogspot.com/2019/01/accelerating-growth-of-carbon-dioxide-in-the-atmosphere.html

• Dangerous situation in Arctic
https://arctic-news.blogspot.com/2018/11/dangerous-situation-in-arctic.html

• Blue Ocean Event
https://arctic-news.blogspot.com/2018/09/blue-ocean-event.html

• Climate Plan
https://arctic-news.blogspot.com/p/climateplan.html

• Extinction
https://arctic-news.blogspot.com/p/extinction.html


Friday, February 1, 2019

How frigid polar vortex blasts are connected to global warming

by Jennifer Francis, Rutgers University

File 20190128 39344 1rjndrb.jpg?ixlib=rb 1.1
Bundled up against the cold in downtown Chicago, Sunday, Jan. 27, 2019.
AP Photo/Nam Y. Huh

A record-breaking cold wave is sending literal shivers down the spines of millions of Americans. Temperatures across the upper Midwest are forecast to fall an astonishing 50 degrees Fahrenheit (28 degrees Celsius) below normal this week – as low as 35 degrees below zero. Pile a gusty wind on top, and the air will feel like -60 F.


Predicted near-surface air temperatures (F) for Wednesday morning, Jan. 30, 2019. Forecast by NOAA’s Global Forecast System model. Pivotal Weather, CC BY-ND
This cold is nothing to sneeze at. The National Weather Service is warning of brutal, life-threatening conditions. Frostbite will strike fast on any exposed skin. At the same time, the North Pole is facing a heat wave with temperatures approaching the freezing point – about 25 degrees Fahrenheit (14 C) above normal.


Predicted near-surface air temperature differences (C) from normal, relative to 1981-2010.
Pivotal Weather, CC BY-ND
What is causing this topsy-turvy pattern? You guessed it: the polar vortex.

In the past several years, thanks to previous cold waves, the polar vortex has become entrenched in our everyday vocabulary and served as a butt of jokes for late-night TV hosts and politicians. But what is it really? Is it escaping from its usual Arctic haunts more often? And a question that looms large in my work: How does global warming fit into the story?


Jimmy Fallon examines the pros and cons of the polar vortex.

Rivers of air

Actually, there are two polar vortices in the Northern Hemisphere, stacked on top of each other. The lower one is usually and more accurately called the jet stream. It’s a meandering river of strong westerly winds around the Northern Hemisphere, about seven miles above Earth’s surface, near the height where jets fly.

The jet stream exists all year, and is responsible for creating and steering the high- and low-pressure systems that bring us our day-to-day weather: storms and blue skies, warm and cold spells. Way above the jet stream, around 30 miles above the Earth, is the stratospheric polar vortex. This river of wind also rings the North Pole, but only forms during winter, and is usually fairly circular.


Dark arrows indicate rotation of the polar vortex in the Arctic; light arrows indicate the location of the polar jet stream when meanders form and cold, Arctic air dips down to mid-latitudes. L.S. Gardiner/UCAR, CC BY-ND
Both of these wind features exist because of the large temperature difference between the cold Arctic and warmer areas farther south, known as the mid-latitudes. Uneven heating creates pressure differences, and air flows from high-pressure to low-pressure areas, creating winds. The spinning Earth then turns winds to the right in the northern hemisphere, creating these belts of westerlies.

Why cold air plunges south

Greenhouse gas emissions from human activities have warmed the globe by about 1.8 degrees Fahrenheit (1 C) over the past 50 years. However, the Arctic has warmed more than twice as much. Amplified Arctic warming is due mainly to dramatic melting of ice and snow in recent decades, which exposes darker ocean and land surfaces that absorb a lot more of the sun’s heat.

Because of rapid Arctic warming, the north/south temperature difference has diminished. This reduces pressure differences between the Arctic and mid-latitudes, weakening jet stream winds. And just as slow-moving rivers typically take a winding route, a slower-flowing jet stream tends to meander.

Large north/south undulations in the jet stream generate wave energy in the atmosphere. If they are wavy and persistent enough, the energy can travel upward and disrupt the stratospheric polar vortex. Sometimes this upper vortex becomes so distorted that it splits into two or more swirling eddies.

These “daughter” vortices tend to wander southward, bringing their very cold air with them and leaving behind a warmer-than-normal Arctic. One of these eddies will sit over North America this week, delivering bone-chilling temperatures to much of the nation.

Deep freezes in a warming world

Splits in the stratospheric polar vortex do happen naturally, but should we expect to see them more often thanks to climate change and rapid Arctic warming? It is possible that these cold intrusions could become a more regular winter story. This is a hot research topic and is by no means settled, but a handful of studies offer compelling evidence that the stratospheric polar vortex is changing, and that this trend can explain bouts of unusually cold winter weather.

Undoubtedly this new polar vortex attack will unleash fresh claims that global warming is a hoax. But this ridiculous notion can be quickly dispelled with a look at predicted temperature departures around the globe for early this week. The lobe of cold air over North America is far outweighed by areas elsewhere in the United States and worldwide that are warmer than normal.


Predicted daily mean, near-surface temperature (C) differences from normal (relative to 1979-2000) for Jan. 28-30, 2019. Data from NOAA’s Global Forecast System model.
Climate Reanalyzer, Climate Change Institute, University of Maine., CC BY-ND
Symptoms of a changing climate are not always obvious or easy to understand, but their causes and future behaviors are increasingly coming into focus. And it’s clear that at times, coping with global warming means arming ourselves with extra scarfs, mittens and long underwear.

Jennifer Francis, Visiting Professor, Rutgers University

This article is republished from The Conversation under a Creative Commons license. Read the original article.


Monday, September 10, 2018

Blue Ocean Event

Blue Ocean Event as part of four Arctic tipping points

What will be the consequences of a Blue Ocean Event, i.e. the disappearance of virtually all sea ice from the Arctic Ocean, as a result of the warming caused by people?


Paul Beckwith discusses some of the consequences in the video below. As long as the Arctic Ocean has sea ice, most sunlight gets reflected back into space and the 'Center-of-Coldness' remains near the North Pole, says Paul. With the decline of the sea ice, however, the 'Center-of-Coldness' will shift to the middle of Greenland. Accordingly, we can expect the jet streams to shift their center of rotation 17° southward, i.e. away from the North Pole towards Greenland, with profound consequences for our global weather patterns and climate system, for plants and animals, and for human civilization, e.g. our ability to grow food.


Also see Paul's video below, The Arctic Blue-Ocean-Event (BOE). When? Then What?


Changing Winds

As global warming continues, the additional energy in the atmosphere causes stronger winds and higher waves.

As the Arctic warms up faster than the rest of the world, the jet streams are getting more out of shape, exacerbating extreme weather events.

The image on the right shows the jet stream crisscrossing the Arctic Ocean on September 10, 2018, with cyclonic wind patterns all over the place.

On the image below, Typhoon Mangkhut is forecast to cause waves as high as 21.39 m or 70.2 ft on September 14, 2018.


The inset on above image shows Typhoon Mangkhut forecast to cause winds to reach speeds as high as 329 km/h or 205 mph at 700 hPa (green circle), while Hurricane Florence is forecast to hit the coast of North Carolina, and is followed by Hurricane Isaac and Hurricane Helene in the Atlantic Ocean.


At 850 hPa, Typhoon Mangkhut reaches Instant Wind Power Density as high as 196.9 kW/m² on September 13, 2018, as illustrated by above image.

The situation is likely to get worse over the next few months, as this is only the start of the hurricane season and El Niño is strengthening, as illustrated by the image on the right.

The image below shows how the occurrence and strength of El Niño has increased over the decades.


Four Arctic Tipping Points

There are numerous feedbacks that speed up warming in the Arctic. In some cases, there are critical points beyond which huge changes will take place rather abruptly. In such cases, it makes sense to talk about tipping points.

1. The albedo tipping point

As Arctic sea ice gets thinner and thinner, a Blue Ocean Event looks more imminent every year. A Blue Ocean Event means that huge amounts of sunlight won't get reflected back into space anymore, as they previously were. Instead, the heat will have to be absorbed by the Arctic. 


At the other hemisphere, the sea ice around Antarctica is at its lowest extent for the time of the year, as illustrated by above image. Global sea ice extent is also at its lowest for the time of the year, as illustrated by the image below.

A Blue Ocean Event will not only mean that additional heat will have to be absorbed in the Arctic, but also that wind patterns will change radically and even more dramatically than they are already changing now, which will also make that other tipping points will be reached earlier. This is why a Blue Ocean Event is an important tipping point and it will likely be reached abruptly and disruptively.

2. The latent heat tipping point

Disappearance of the sea ice north of Greenland is important in this regard. The image on the right shows that most sea ice at the end of August 2018 was less than 1 meter thick.

The image below shows how the sea ice has been thinning recently north of Greenland and Ellesmere Island, an area once covered with the thickest multi-year sea ice. Disappearance of sea ice from this area indicates that we're close to or beyond the latent heat tipping point, i.e. the point where further ocean heat can no longer be consumed by the process of melting the sea ice.

[ The once-thickest sea ice has gone - click on images to enlarge ]
The amount of energy absorbed by melting ice is as much as it takes to heat an equivalent mass of water from zero to 80°C. Without sea ice, additional ocean heat will have to go somewhere else.


Above image shows how much sea surface temperatures in the Arctic have warmed, compared to 1961-1990. The image also shows the extent of the sea ice (white). In the image below, a large area has changed from sea ice to water twelve days later, showing how thin and fragile the sea ice is and how easily it can disappear as the water continues to warm.


As the Arctic is warming faster than the rest of the world, changes have been taking place to the jet streams on the Northern Hemisphere that make it easier for warm air and water to move into the Arctic. This means that warm water is increasingly entering the Arctic Ocean that can no longer be consumed by melting the sea ice from below.

Arctic sea ice extent has remained relatively large this year, since air temperatures over the Arctic Ocean have been relatively low in June and July 2018. At the same time, ocean heat keeps increasing, so a lot of heat is now accumulating underneath the surface of the Arctic Ocean.

[ click on images to enlarge ]
3. Seafloor Methane Tipping Point

As said above, Arctic sea ice has been getting thinner dramatically over the years, and we are now near or beyond the latent heat tipping point.

[ The Buffer has gone, feedback #14 on the Feedbacks page ]
This year, air temperatures over the Arctic Ocean were relatively low in June and July 2018, and this has kept Arctic sea ice extent larger than it would otherwise have been. As a result, a lot of heat has been accumulating underneath the surface of the Arctic Ocean and this heat cannot escape to the atmosphere and it can no longer be consumed by melting. Where will the heat go?

As the temperature of the Arctic Ocean keeps rising, more heat threatens to reach sediments at its seafloor that have until now remained frozen. Contained in these sediments are huge amounts of methane in the form of hydrates and free gas.

Melting of the ice in these sediments then threatens to unleash huge eruptions of seafloor methane that has been kept locked up in the permafrost for perhaps millions of years. Seafloor methane constitutes a third tipping point.

The image on the right features a trend based on WMO data. The trend shows that mean global methane levels could cross 1900 ppb in 2019.

Ominously, methane recently reached unprecedented levels. Peak levels as high as 3369 ppb on August 31, 2018, as shown by the image below on the right.

The next image on the right below shows that mean global levels were as high as 1905 ppb on September 3, 2018.

The third image below on the right may give a clue regarding the origin of these unprecedented levels.

More methane will further accelerate warming, especially in the Arctic, making that each of the tipping points will be reached earlier.

Less sea ice will on the one hand make that more heat can escape from the Arctic Ocean to the atmosphere, but on the other hand the albedo loss and the additional water vapor will at the same time cause the Arctic Ocean to absorb more heat, with the likely net effect being greater warming of the Arctic Ocean.

Additionally, more heat is radiated from sea ice into space than from open water (feedback #23).

How much warming could result from the decline of snow and ice cover in the Arctic?

As discussed, there will be albedo changes, there will be changes to the jet streams, and there will be further feedbacks, adding up to 1.6°C of additional global warming that could eventuate due to snow and ice decline and associated changes in the Arctic.

A further 1.1°C of warming or more could result from releases of seafloor methane over the next few years.

4. Terrestrial Permafrost Tipping Point

Additional warming of the Arctic will also result in further warming due to numerous feedbacks such as more water vapor getting into the atmosphere. Furthermore, more intense heatwaves can occur easier in the Arctic due to changes to jet streams. All this will further accelerate melting of the ice in lakes and in soils on land that was previously known as permafrost. This constitutes a fourth tipping point that threatens to add huge amounts of additional greenhouse gases to the atmosphere. Until now, the permafrost was held together by ice. As the ice melts, organic material in the soil and at the bottom of lakes starts to decompose. The land also becomes increasingly vulnerable to landslides, sinkholes and wildfires. All his can result in releases of CO₂, CH₄, N₂O, soot, etc., which in turn causes further warming, specifically over the Arctic.

In total, a temperature rise of 10°C threatens to occur in as little as a few years time.

The situation is dire and calls for comprehensive and effective action, as described in the Climate Plan.


Links

• Jet Stream Center-of-Rotation to Shift 17 degrees Southward from North Pole to Greenland with Arctic Blue Ocean Event
https://www.youtube.com/watch?v=bFme3C9e-cs

• It could be unbearably hot in many places within a few years time
https://arctic-news.blogspot.com/2016/07/it-could-be-unbearably-hot-in-many-places-within-a-few-years-time.html

• Feedbacks
https://arctic-news.blogspot.com/p/feedbacks.html

• Latent Heat
https://arctic-news.blogspot.com/p/latent-heat.html

• Albedo and more
https://arctic-news.blogspot.com/p/albedo.html

• Warning of mass extinction of species, including humans, within one decade
https://arctic-news.blogspot.com/2017/02/warning-of-mass-extinction-of-species-including-humans-within-one-decade.html

• How much warming have humans caused?
https://arctic-news.blogspot.com/2016/05/how-much-warming-have-humans-caused.html

• The Threat
https://arctic-news.blogspot.com/p/threat.html

• Extinction
https://arctic-news.blogspot.com/p/extinction.html

• Climate Plan
https://arctic-news.blogspot.com/p/climateplan.html