Showing posts with label feedbacks. Show all posts

Thursday, July 9, 2020

Global warming and ice sheet melting: Portents of a Younger dryas-like stadial event

Global warming and ice sheet melting:
Portents of a Younger dryas-like stadial event
by Andrew Glikson


Linear climate projections by the IPCC are difficult to reconcile with the paleoclimate evidence of stadial cooling events which closely succeeded warming peaks, including the Younger dryas (12.9–11.6 kyr ago), Laurentian melt (~8.3 kyr) and earlier interglacial stadials. Each of these events followed peak interglacial temperatures, leading to extensive melting of the ice sheets and transient stadial cooling events. Current global temperature rises in the range of ~ +1.19 ± 0.13 °C (Northern Hemisphere) and higher in the Arctic are consistent with this pattern, leading to the build-up of ice melt pools south of Greenland and around Antarctica. The growth of these pools is likely to progress toward large-scale to a global stadial, inducing differential warming and cooling effects leading to major weather disruptions and storminess, possibly analogous to the Younger dryas and Laurentian melt events.

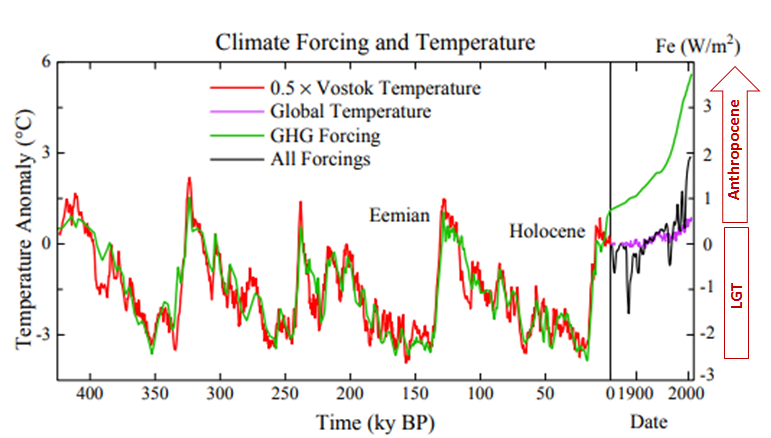
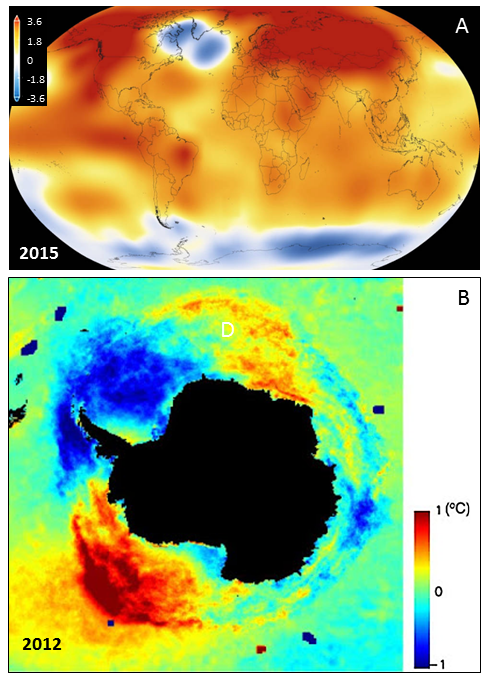
Linear temperature rise projections by the IPCC are unlikely in view of (1) amplifying feedbacks of greenhouse gases and global warming on land and ocean, and (2) stadial cooling effects due to the flow of ice melt water from the large ice sheets into the North Atlantic Ocean and the circum-Antarctic ocean (Figure 1). Apart from the absolute GHG level (~500 ppm CO₂-equivalent), the high rise rate of ~2-3 ppm CO₂/year and thereby temperature is driving dangerous weather events. The extreme rise in greenhouse gases in the atmosphere is evident from a comparison with past climate events (Figure 6). Linear temperature projections and thereby environment change are complicated by storminess due to collisions between air masses of contrasted temperatures. As the Arctic jet stream weakens, warm air currents from the south and freezing air masses from the north cross the boundary, a pattern already manifested by Arctic heat waves and fires and by penetration of freezing air masses into mid-latitudes, i.e. the “Beast from the East” snow storms. The increasing extent of cold ice melt pools around Greenland and Antarctica (Figure 1) suggest such a process is already in progress, signifying an onset of an interglacial stadial, as modelled by Hansen et al. 2016 and Bronselaer et al. (2016).

Figure 1 A. The cold ocean region south of Greenland visible on the NASA's 2015 global mean
temperatures (NASA/NOAA; 20 January 2016), the warmest year on record since 1880;
B. Circum-Antarctic summer surface temperatures, showing the large Weddell Sea and other
cold Sub-Antarctic ocean anomalies related to the flow of ice melt water into the ocean, and a seasonal
warming anomaly in the Ross Sea due to upwelling of warm salty water from the circum-Antarctic current.

Stadial events

Late Pleistocene climate cycles were controlled by orbital parameters of the Milankovitch cycles including eccentricity (~100,000 years), obliquity to the ecliptic plane (~41,000 years) and precession/wobble of the Earth’s axis (~19,000 and ~23,000 years). The Younger dryas of 12,900 to 11,600 years ago following the Allerod BÖlling warm peak and marked by cooling of near -20°C in Greenland and (Figure 2A, B), has major implications for climate change projections for the 21-23rd centuries.

The Younger dryas is the longest of three late Pleistocene stadials (Figure 2A) associated with abrupt climatic changes that took place over the last 16,000 years. According to Steffensen et al. 2008 based on deuterium isotopes in ice cores the abrupt onset of the Younger dryas in Greenland occurred over less than 1 year and ended over less than 3 years (Figure 2B), or about 50 years based on stable water isotopes representing the air temperature record. Evidence for the effects of the Younger dryas stadial has also been identified in tropical and subtropical regions (Shakun and Carlson, 2010) (Figure 3). The underlying factors for the Younger dryas and Laurentian (Figure 4) stadial events are the deglaciation of Northernmost America, flow of cold ice melt water into the North Atlantic Ocean and into North American lakes (Lake Agassiz), and the retreat southward of the North Atlantic Thermohaline Current.

Suggestions of a comet impact origin of the Younger dryas are inconsistent with (1) the recurrence of stadial events following peak interglacial temperatures over the last 420,000 years (Figure 5) and (2) the paucity of clear evidence for a large extraterrestrial impact contemporaneous with the Younger dryas, including the little known age of the radar-detected crater below the Hiawatha Glacier In northwest Greenland.

Figure 2A Air temperatures at the Last glacial maximum (20-16 kyr), BÖlling-Allerod warm peak,
Younger dryas (12,900 to 11,600 years ago) and 8.2 kyr Laurentian stadial event. This image
shows temperature changes, determined as proxy temperatures, taken from the central region

of Greenland's ice sheet during the Late Pleistocene and beginning of the Holocene.

Figure 2B. deuterium evidence for onset cooling temperature and terminal
warming of the Younger dryas stadial event (14,740-11,660) (Steffensen et al. 2008).

Figure 3. Magnitude of late Holocene glacial-interglacial temperature changes
in relation to latitude. Black squares are the Northern Hemisphere (NH),
gray circles the Southern Hemisphere (SH) (Shakun and Carlson, 2010).

The youngest recorded stadial, the Laurentian melt, between ~8,500 and ~8.000 years ago (Figure 4), is indicated by distinctive temperature–CO₂ correlation with global CO₂ decline of ≈25 ppm by volume over ≈300 years, consistent with the lowering of North Atlantic sea-surface temperatures and weakening of the AMOC (Atlantic Meridional Ocean Circulation).

Figure 4 A. The ~8.2 kyr Laurentian stadial event in a coupled climate model (Wiersma et al. 2011);
B. Reconstructed CO₂ concentrations for the interval between ~8,700 and ~6,800 BP, based on
CO 2 extracted from air in Antarctic ice of Taylor Dome (Wagner et al. 2002).
The Younger dryas and the Laurentian stadials are not unique, as peak temperatures in every interglacial event over the last 420,000 years were followed by sharp cooling events (Figure 5). Apart from the absolute level of greenhouse gases (GHG) in the atmosphere the high rate at which GHG concentrations are rising, as shown by comparisons with previous extreme warming events (Figure 6), enhances extreme weather events, as well as retards the ability of fauna and flora to adapt to the new conditions.

Figure 5 (a) Evolution of sea surface temperatures in five glacial-interglacial transitions recorded in
ODP 
1089 at the sub-Antarctic Atlantic Ocean (Cortese et al. 2007). Grey lines – δ 18 O measured on
Cibicidoides plankton; Black lines – sea surface temperature. Marine isotope stage numbers are 
indicated on top of diagrams. Note the stadial following interglacial peak temperatures; (b) the last 
glacial maximum and the last glacial termination. Olds- Oldest dryas; Old – Older dryas; Yd – Younger dryas.

Figure 6 (A) Reconstructed atmospheric CO₂ variations during the Late Cretaceous–early Tertiary
derived from the Stomata indices of fossil leaf cuticles calibrated by using inverse regression
and stomatal ratios (Beerling et al. 2002);
(B) Simulated atmospheric CO₂ at and after the Palaeocene-Eocene boundary (after Zeebe et al. (2009).
Compare the CO₂ ppm/year values with the current rise of 2 to 3 ppm/year;
(C) Global CO₂ and temperature during the last glacial termination (After Shakun et al., 2012)
(LGM - Last Glacial Maximum; OD – Older dryas; BA - Bølling–Allerød; YD - Younger dryas);

The average global land and ocean surface temperature for March 2020 was 1.16°C above the 20th century average global level of 12.7°C. Current CO₂ rise and warming rates exceed that of the Last Glacial Termination (LGT) (21–8 kyr) (Figure 6C), the Paleocene-Eocene Thermal Maximum (PETM) (55.9 Ma) (Figure 6B) and the Cretaceous-Tertiary boundary (K-T) (64.98 Ma) impact event (Figure 6A). The relations between warming rates and the migration of climate zones toward the poles (Figure 7), including changes in the atmosphere and ocean current systems, are in the root of the major environmental changes in these zones.
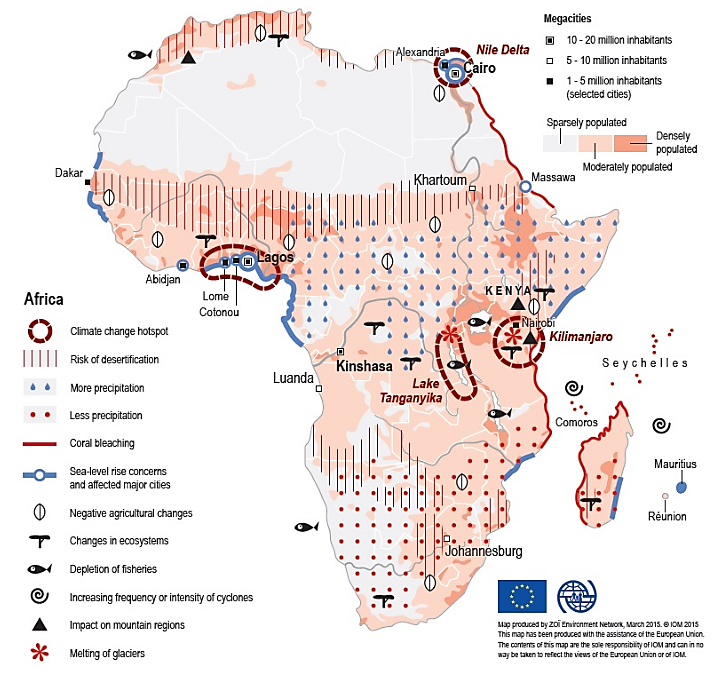
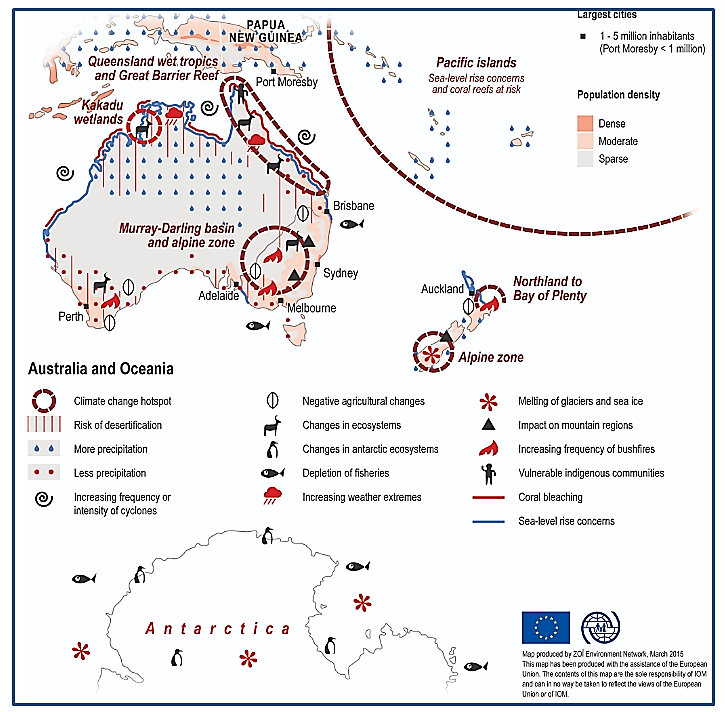
Figure 7. Expansion of the tropical African climate zone (vertical red lines) into subtropical and Mediterranean
climate zones to the north and south (Migration, Environment and Climate Change, International Organization
for Migration, Geneva, Switzerland (Regional Maps on Migration, Environment and Climate Change.

Future Stadial events

IPCC climate change projections for 2100-2300 portray linear to curved temperature progressions (SPM-5). However, amplifying feedbacks and transient cooling events (Stadials) ensuing from the flow of ice melt water into the oceans during peak interglacial warming events, impose abrupt temperature variations (Figure 5). The current flow of ice melt water from Greenland and Antarctica (Figures 8, 9) is leading to regional ocean cooling in the North Atlantic and around Antarctica (Rahmstorf et al, 2015; Hansen et al. (2016); Bronselaer et al. 2018; Purkey et al. 2018; Vernet et al. 2019) (Figures 1, 8). Under high greenhouse gas and temperature rise trajectories (RCP8.5) this implies future stadial events as modelled by Hansen et al. (2016) (Figure 10) and Bronselaer et al. (2018) (Figure 11).

Depending on different greenhouse emission scenarios (IPCC 2019; van Vuren et. al. (2011), including the CO₂ forcing-equivalents of methane (CH4) and nitrous oxide (N2O), the total CO₂–equivalent rise has reached 496 ppm (NOAA, 2019). As the oceans heat contents is rising, upwelling of warm sublayers is melting the leading edges of continental glaciers (Figure 8). This factor and the flow of ice meltwater from leading glacier fronts and grounding lines lead to stratification of the sub-Antarctic ocean and an incipient onset of a southern ocean stadial (Figure 8).

Figure 8. The transition from grounded ice sheet to floating ice shelf and icebergs

Figure 9. Greenland and Antarctic ice mass change. GRACE data are extension of Velicogna et al. (2014)
gravity data. MBM (mass budget method) data are from Rignot et al. (2011). Red curves are gravity data
for Greenland and Antarctica only; small Arctic ice caps and ice shelf melt add to freshwater input.
Satellite and mass balance measurements of the large ice sheets indicate their rapid reduction (Figure 9). Variations in ice thickness, ice drainage and ice velocity data in 176 Antarctic basins between 1979 and 2017 indicate a total mass loss rise from 40 ± 9 Gt/year in 1979–1990 to 50 ± 14 Gt/year in 1989–2000, 166 ± 18 Gt/year in 1999–2009, and 252 ± 26 Gt/year in 2009–2017 (Figure 9). This amounts to an increased melting by more than 6-fold in about 40 years, contributing an average sea level rise of 3.6 ± 0.5 mm per decade, with a cumulative 14.0 ± 2.0 mm since 1979 (Rignot et al. 2019). The mass loss concentrated in areas closest to warm, salty, subsurface, circumpolar deep water (CDW), consistent with enhanced polar westerlies pushing CDW toward Antarctica.

The Greenland ice sheet contains approximately 2,900,000 GtI of ice. During the exceptionally warm Arctic summer of 2019, Greenland lost 600 GtI of ice. Under global GHG and temperature rise this rate is likely to be exceeded. The Greenland ice sheet may not last much longer than a Century. The Antarctic ice sheet weighs approximately 26,500 Gigaton. For a loss greater than ~250 GtI/year it could last for 105 years or less. For accelerated ice melt rates under rising GHG concentrations it could last for significantly shorter time, except for possible negative feedbacks associated with stadial cooling?

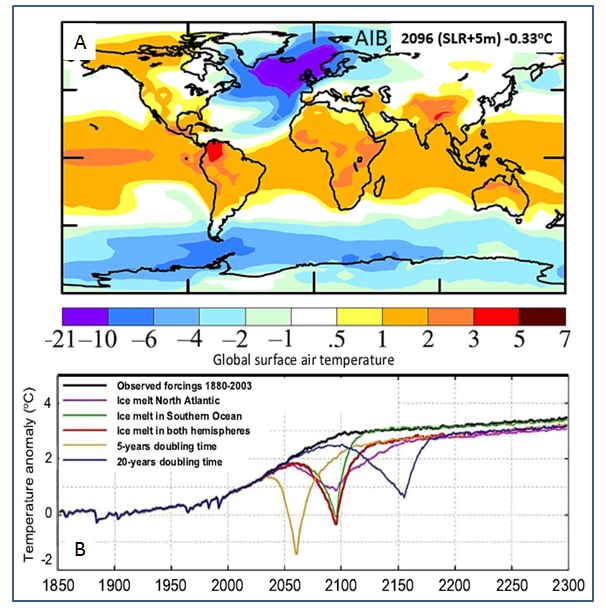
Hansen et al. (2016) suggest that, depending on ice melt rates of the polar ice sheets, transient cooling events (stadials) can be expected to develop over periods dependent on the rates of ice melt (Fig. 10). Stadial cooling of about -2°C lasting for several decades (Figure 10) may affect temperatures in Europe and North America. The model is consistent with a slowdown of the Atlantic Meridional Ocean Circulation (AMOC) (Weaver et al. 2012) and the exceptional growth of a cold water region southeast of Greenland, (Rahmstorf et al, 2015).
Figure 10. A. Model surface air temperature (◦C) change in 2096;
B. Surface air temperature (◦C) relative to 1880–1920 for several ice melt scenarios.

According to Bronselaer et al. (2018) temporal evolution of the global-mean surface-air temperature (SAT) shows meltwater-induced cooling translates to a reduced rate of global warming (Fig. 11), with a maximum divergence between standard models and models which include the effects of meltwater-induced cooling of 0.38 ± 0.02°C in 2055. As stated by the authors “We demonstrate that the inclusion in the model of ice-sheet meltwater reduces global atmospheric warming, shifts rainfall northwards, and increases sea-ice area”, and “Antarctic meltwater is therefore an important agent of climate change with global impact, and should be taken into account in future climate simulations and climate policy.”
Figure 11. The 2080–2100 meltwater-induced sea-air temperature anomaly relative to the standard
RCP8.5 ensemble. Hatching indicates where the anomalies are not significant at the 95% level.

Conclusions


Based on the paleoclimate record, global warming, penetration of cold and warm air masses across weakened polar boundaries, increased ice melting rates, sea level rise and near-surface cooling of large ocean tracts (Figures 10, 11), collisions between warm and cold air and water masses and thereby storminess are likely to determine the future climate of large parts of Earth. With rising greenhouse gas levels and their amplifying feedbacks from land and oceans these developments are likely to persist in the long term. The continuing migration of climate zones toward the poles is likely to be disrupted by developing stadial effects and differential warming and cooling effects, leading to major weather disruptions and storminess. Continuing release of greenhouse gases and their amplifying feedbacks could lead to tropical Miocene-like conditions about 4 to 5 degrees Celsius warmer than late Holocene climate conditions which allowed agriculture and thereby civilization to emerge.


Andrew Glikson
Dr Andrew Glikson
Earth and Paleo-climate scientist
ANU Climate Science Institute
ANU Planetary Science Institute
Canberra, Australia


Books:
The Asteroid Impact Connection of Planetary Evolution
http://www.springer.com/gp/book/9789400763272
The Archaean: Geological and Geochemical Windows into the Early Earth
http://www.springer.com/gp/book/9783319079073
Climate, Fire and Human Evolution: The Deep Time Dimensions of the Anthropocene
http://www.springer.com/gp/book/9783319225111
The Plutocene: Blueprints for a Post-Anthropocene Greenhouse Earth
http://www.springer.com/gp/book/9783319572369
Evolution of the Atmosphere, Fire and the Anthropocene Climate Event Horizon
http://www.springer.com/gp/book/9789400773318
From Stars to Brains: Milestones in the Planetary Evolution of Life and Intelligence
https://www.springer.com/us/book/9783030106027
Asteroids Impacts, Crustal Evolution and Related Mineral Systems with Special Reference to Australia
http://www.springer.com/us/book/9783319745442


Sunday, November 24, 2019

The breach of the Paris Agreement

By Andrew Glikson
Earth and climate scientist
Australian National University


Since its inception the Paris Agreement has been in question due to, among other:
  • its broad definition, specifically holding the increase in the global average temperature to well below 2°C above pre-industrial levels and pursuing efforts to limit the temperature increase to 1.5°C above pre-industrial levels;
  • its non-binding nature; and 
  • accounting tricks by vested interests.
The goal assumes pre-determined limits can be placed on greenhouse gas levels and temperatures beyond which they would not continue to rise. Unfortunately these targets do not appear to take account of the amplifying positive feedback effects from land and oceans under the high cumulative greenhouse gas levels and their warming effects. Thus unfortunately the current high CO₂ levels of about 408 ppm and near-500ppm CO₂-equivalent (CO₂+methane+nitrous oxide) would likely continue to push temperatures upwards.

Significant climate science evidence appears to have been left out of the equation. The accord hinges on the need to reduce emissions, which is essential, but it does not indicate how further temperature rise can be avoided under the conditions of a high-CO₂ atmosphere, which triggers carbon release, unless massive efforts at sequestration (drawdown) of greenhouse gases are undertaken. Inherent in global warming are amplifying positive feedbacks, including albedo (reflection) decline due to the melting of ice and the opening of dark water surfaces, increased water vapor contents of the atmosphere in tropical regions which enhances the greenhouse effect, reduced sequestration of CO₂ by the warming oceans, desiccation of vegetation, fires, release of methane from permafrost and other processes. This means that even abrupt reductions in emissions may not be sufficient to stem global warming, unless accompanied by sequestration of greenhouse gases from the atmosphere to a lower level, recommended as below 350 ppm CO₂ by James Hansen, the leading climate scientist.

The world is on track to produce 50% more fossil fuels than can be burned before reaching the limit prescribed by the Paris Agreement, with currently planned coal, oil and gas outputs making the Paris Agreement goal impossible. Projected fossil fuel production in 2030 being more than is consistent with 2°C, and 120% more than that for 1.5°C.

Unbelievably, according to the International Monetary Fund, “In 2017 the world subsidized fossil fuels by $5.2 trillion, equal to roughly 6.5% of global GDP”, which is more than the total the world spends on human health. Such subsidies cannot possibly be consistent with the Paris Agreement. The pledge to end fossil fuel subsidies by 2025 by the G7 nations, with exceptions by the UK and Japan, may come too late as global CO₂ concentrations, already intersecting the stability limits of the Greenland and Antarctic ice sheets, are rising at a rate of 2 to 3 ppm per year, the highest in many millions of years.

Despite the scientific consensus regarding the anthropogenic origin of global warming, the world’s biggest fossil fuel corporations are taking a defiant stance against warnings that reserves of coal, oil and gas are already several times larger than can be burned if the world’s governments are to meet their pledge to tackle climate change. ExxonMobil said new reserves in the Arctic and Canadian tar sands must be exploited. Peabody Energy, the world’s largest private coal company, said global warming was “an environmental crisis predicted by flawed computer models”. Glencore Xstrata said that governments would fail to implement measures to cut carbon emissions. The World Bank and Bank of England have already warned of the “serious risk” climate action poses to trillions of dollars of fossil fuel assets.

Not to mention the risks to the living Earth and its billions of inhabitants!

The apparent neglect of scientific advice is not an isolated instance. It is not uncommon that climate reports are dominated by the views of economists, lawyers, bureaucrats and politicians, often overlooking the evidence presented by some of the world’s highest climate science authorities. Whereas the IPCC reports include excellent and comprehensive summaries of the peer-reviewed literature, the summaries for policy makers only partly represent the evidence and views of scientific authorities in the field, including those who have identified global warming in the first place.
Figure 2. from: James Hansen, data through June 2019

There exists a tendency in the media to report averages, such as average global temperature values, rather than the increasingly-common high zonal, regional and local anomalies.

For example, the annual mean global temperature rise of for 2018 is about one third the Arctic mean temperature rise (Fig. 2). Given that developments in the Arctic bear major consequences for climate change, the global mean  does not represent the seriousness of the climate crisis.

Another example is the way extremes weather events are reported as isolated instances, neglecting the rising frequency and intensity of hurricanes, storms, fires and droughts, indicated in frequency plots (Fig 3.).

Figure 3. Rise in geophysical, meteorological, hydrologocal and climatological events. Munich RE
It is not until international and national institutions take full account of what climate science is indicating that a true picture of the climate crisis will be communicated to the public.


Andrew Glikson
Dr Andrew Glikson
Earth and climate scientist
Australian National University


Books:
- The Archaean: Geological and Geochemical Windows into the Early Earth
- The Asteroid Impact Connection of Planetary Evolution
- Asteroids Impacts, Crustal Evolution and Related Mineral Systems with Special Reference to Australia
- Climate, Fire and Human Evolution: The Deep Time Dimensions of the Anthropocene
- The Plutocene: Blueprints for a Post-Anthropocene Greenhouse Earth
- Evolution of the Atmosphere, Fire and the Anthropocene Climate Event Horizon
- From Stars to Brains: Milestones in the Planetary Evolution of Life and Intelligence


Tuesday, November 5, 2019

A record CO2 rise rate since the KT dinosaur extinction 66 million years ago

By Andrew Glikson
Earth and climate scientist
Australian National University

As the concentration of atmospheric CO₂ has risen to 408 ppm and the total greenhouse gas level, including methane and nitrous oxide, combine to near 500 parts per million CO₂-equivalent, the stability threshold of the Greenland and Antarctic ice sheets, currently melting at an accelerated rate, has been exceeded. The consequent expansion of tropics and the shift of climate zones toward the shrinking poles lead to increasingly warm and dry conditions under which fire storms, currently engulfing large parts of South America (Fig. 1), California, Alaska, Siberia, Sweden, Spain, Portugal, Greece, Angola, Australia and elsewhere have become a dominant factor in the destruction of terrestrial habitats.

Figure 1. Sensors on NASA satellites Terra and Aqua captured a record of thousands of points
of fire in Brazil in late August. Credit: NASA Earth Observatory
Since the 18th century, combustion of fossil fuels has led to the release of more than 910 billion tons of carbon dioxide (GtCO₂) by human activity, raising CO₂ to about 408.5 ppm (Fig. 2), as compared to the 280-300 ppm range prior to the onset of the industrial age. By the early-21st century the current CO₂ rise rate has reached of 2 to 3 ppm/year.

Figure 2. Global temperature and carbon dioxide - Climate Central
Allowing for the transient albedo enhancing effects of sulphur dioxide and other aerosols, mean global temperature has potentially reached ~2.0 degrees Celsius above pre-industrial temperatures. Current greenhouse gas forcing and global mean temperatures are approaching Miocene-like (5.3-23 million years-ago) composition.

The current carbon dioxide rise rate exceeds the fastest rates estimated for the K-T asteroid impact (66.4 million years-ago) and the PETM (Paleocene-Eocene Temperature Maximum) hyperthermal event (55.9 million years ago) by an order of magnitude (Fig. 3). The current growth rate of atmospheric greenhouse gases, in particular over the last 70 years or so, may appear gradual in our lifetime, but it constitutes an extreme event in the recorded history of Earth.
Figure 3. Cenozoic CO₂ and temperature rise rates. Current rise rates of CO₂ (2.86 ppm CO2/year) and temperature (0.15-0.20°C per decade since 1975) associated with extreme weather events raise doubt regarding gradual linear climate projections. Instead, chaotic climate conditions may arise from the clash between northward-shifting warm air masses which intersect the weakened undulating Arctic jet stream boundary and freezing polar air fronts penetrating Siberia, North America and Europe.
The definition of a “tipping point” in the climate system is a threshold which, once exceeded, can lead to large changes in the state of the system, or where the confluence of individual factors combines into a single stream. The term “tipping element” describes subcontinental-scale subsystems of the Earth system that are susceptible to being forced into a new irreversible state by small perturbations. In so far as a tipping point can be identified in current developments of the climate system, the weakening of the Arctic boundary, indicated by slowing down and increased disturbance of the jet stream heralds a likely tipping point, an example being the recent ‘Beast from the East” freeze in northern Europe and North America (Fig. 4).

Figure 4. The cold fronts penetrating Europe from Siberia and the North Atlantic and North America from the Arctic, 2018. UK Met Office.
A report by the National Academy Press 2011 states: “As the planet continues to warm, it may be approaching a critical climate threshold beyond which rapid (decadal-scale) and potentially catastrophic changes may occur that are not anticipated.”

Direct evidence for changing climate patterns is provided by the expansion of the tropics and migration of climate zones toward the poles, estimated at a rate of approximately 56-111 km per decade. As the dry subtropical zones shift toward the poles, droughts worsen and overall less rain falls in temperate regions. Poleward shifts in the average tracks of tropical and extratropical cyclones are already happening. This is likely to continue as the tropics expand further. As extratropical cyclones move, they shift rain away from temperate regions that historically rely on winter rainfalls for their agriculture and water supply. Australia is highly vulnerable to expanding tropics as about 60 percent of the continent lies north of 30°S.

Low-lying land areas, including coral islands, delta and low coastal and river valleys would be flooded due to sea level rise to Miocene-like (5.3-23 million years ago) sea levels of approximately 40±15 meters above pre-industrial levels. Accelerated flow of ice melt water flow from ice sheets into the oceans is reducing temperatures over tracts in the North Atlantic and circum-Antarctic oceans. Strong temperature contrasts between cold polar-derived fronts and warm tropical-derived air masses lead to extreme weather events, retarding habitats, in particular over coastal regions. As partial melting of the large ice sheets proceeds the Earth’s climate zones continue to shift polar-ward (Environmental Migration Portal, 2015). This results in an expansion of tropical regions such as existed in the Miocene, reducing the size of polar ice sheets and temperate climate zones.

According to Berger and Loutre (2002) the effect of high atmospheric greenhouse gas levels would delay the next ice age by tens of thousands of years, during which chaotic tropical to hyper-tropical conditions including extreme weather events would persist over much of the Earth, until atmospheric CO₂ and insolation subside. Humans are likely to survive in relatively favorable parts of Earth, such as sub-polar regions and sheltered mountain valleys, where cooler conditions would allow flora and fauna to persist.

To try and avoid a global calamity, abrupt reduction in carbon emissions is essential, but since the high level of CO₂-equivalent is activating amplifying feedbacks from land and ocean, global attempts to down-draw about of 50 to 100 ppm of CO₂ from the atmosphere, using every effective negative emissions, is essential. Such efforts would include streaming air through basalt and serpentine, biochar cultivation, sea weed sequestration, reforestation, sodium hydroxide pipe systems and other methods.

But while $trillions continue to be poured into preparation of future wars, currently no government is involved in any serious attempt at the defense of life on Earth.


Andrew Glikson
Dr Andrew Glikson
Earth and climate scientist
Australian National University

Books:

- The Archaean: Geological and Geochemical Windows into the Early Earth
- The Asteroid Impact Connection of Planetary Evolution
- Asteroids Impacts, Crustal Evolution and Related Mineral Systems with Special Reference to Australia
- Climate, Fire and Human Evolution: The Deep Time Dimensions of the Anthropocene
- The Plutocene: Blueprints for a Post-Anthropocene Greenhouse Earth
- Evolution of the Atmosphere, Fire and the Anthropocene Climate Event Horizon
- From Stars to Brains: Milestones in the Planetary Evolution of Life and Intelligence


Sunday, September 1, 2019

Blueprints of future climate trends

Blueprints of future climate trends

Extreme GHG and temperature rise rates question linear climate projections

Andrew Glikson
Earth and climate scientist
Australian National University
geospec@iinet.net.au

Abstract

The extreme greenhouse gas (GHG) and temperature rise rates since the mid-1970th raise questions over linear climate projections for the 21st century and beyond. Under a rise of CO₂-equivalent reaching +500 ppm and 3.0 W/m⁻² relative to 1750, the current rise rates of CO₂ by 2.86 ppm per and recent global temperature rise rate (0.15-0.20°C per decade) since 1975 are leading to an abrupt shift in state of the terrestrial climate and the biosphere. By mid-21st century at >750 ppm CO₂-e climate tipping points indicated by Lenton et al. 2008 and Schellnhuber 2009 are likely to be crossed. Melting of the Greenland and Antarctic ice sheets has increased by a factor of more than 5 since 1979–1990. As the ice sheets and sea ice melt, the albedo flip between reflective ice surfaces and dark infrared-absorbing water results in significant increase of radiative forcing, and complete removal of Arctic sea ice would result in a forcing of about 0.7 W/m⁻² (Hudson, 2011). The confluence of climate events, including a breach of the circum-Arctic jet stream boundary and a polar-ward migration of climate zones at a rate of 56-111 km per decade, induce world-wide extreme weather events including bushfires, methane release from Arctic permafrost and sediments. For a climate sensitivity of 3±1.5°C per doubling of atmospheric CO₂, global warming has potentially reached between +2°C to +3°C above mean pre-industrial temperatures at a rate exceeding the fastest growth rate over the last 55 million years. As ice melt water flow into the oceans temperature polarities between warming continents and cooling tracts of ocean would further intensify extreme weather events under non-linear climate trajectories. The enrichment of the atmosphere in GHG, constituting a shift in state of the terrestrial climate, is predicted to delay the onset of the next glacial state by some 50,000 years.

GHG and temperature rise

The paleoclimate record suggests that no event since 55 million years ago, the Paleocene-Eocene Thermal Maximum (PETM), when global temperatures rose by more than +5 to +8°C over a period of ~20,000 years, with a subsequent warming period of up to 200,000 years, has been as extreme as atmospheric disruption since the onset of the industrial age about 1750 AD (the Anthropocene), accelerating since 1975. During this period greenhouse gas levels have risen from ~280 ppm to above >410 ppm and to 496 ppm CO₂-equivalent (Figure 1), the increase of CO₂ reaching near-47 percent above the original atmospheric concentration. However, linear climate change projections are rare in the recent climate history (Figure 2) and linear future climate projections may not account for the effects of amplifying feedbacks from land and oceans. Given an Anthropocene warming rate faster by ~X200 times than the PETM (Figure 3), linear warming trajectories such as are projected by the IPCC may overlook punctuated tipping points, transient reversals and stadial events.
Figure 1. Growth of CO₂-equivalent level and the annual greenhouse gas Index (NOAA AGGI).
Measurements of CO₂ to the 1950s are from (Keeling et al., 2008) and from air trapped in ice and
snow between CO₂ concentrations and radiative forcing from all long-lived greenhouse gases.

According to NOAA, GHG forcing in 2018 has reached 3.101 W/m⁻² relative to 1750 (CO₂ = 2.044 W/m⁻²; CH₄ = 0.512 W/m⁻²; N₂O = 0.199 W/m⁻²; CFCs = 0.219 W/m⁻²) with a CO₂-equivalent of 492 ppm (Figure 1). The rise in GHG forcing during the Anthropocene since about 1800 AD, intensifying since 1900 AD and sharply accelerating since about 1975, has induced a mean of ~1.5°C over the continents above pre-industrial temperature, or >2.0°C when the masking role of aerosols is discounted, implying further warming is still in store.

According to Hansen et al. 2008, the rise in radiative forcing during the Last Glacial Termination (LGT - 18,000 -11,000 years BP), associated with enhancing feedbacks, has driven GHG radiative forcing by approximately ~3.0 W/m⁻² and a mean global temperature rise of ~4.5°C (Figure 2), i.e. of similar order as the Anthropocene rise since about 1900. However the latter has been reached within a time frame at least X30 times shorter than the LGT, underpinning the extreme nature of current global warming.
Figure 2. (Hansen et al. 2008). Glacial-temperature and GHG forcing for the last 420,000 years based on the Vostok
ice core, with the time scale expanded for the Anthropocoene. The ratio of temperature and forcing scales is 1.5°C
per 1 W/m⁻². The temperature scale gives the expected equilibrium response to GHG change including slow feedback
surface albedo change. Modern forcings include human-made aerosols, volcanic aerosols and solar irradiance.
The CO₂-equivalent levels and radiative forcing levels constitute a rise from Holocene levels (~280 ppm CO₂) to >410 ppm compared with Miocene-like levels (300-600 ppm CO₂), at a rate reaching 2 to 3 ppm/year, within a century or so, driving the fastest temperature rise rate recorded since 55 million years ago (Figure 3).

Figure 3. A comparison between rates of mean global temperature rise during: (1) the last Glacial Termination
(after Shakun et al. 2012); (2) the PETM (Paleocene-Eocene Thermal Maximum, after Kump 2011);
(3) the late Anthropocene (1750–2016), and (4) an asteroid impact. In the latter instance temperature
due to CO₂ rise would lag by some weeks or months behind aerosol-induced cooling

Considering the transient mitigating albedo effects of clouds, seasonal land surface albedo, ice albedo, atmospheric aerosols including sulphur dioxide and nitrate, the potential rise of land temperature could have reached -0.4 to -0.9 W/m⁻² in 2018, masking approximately 0.6 to 1.3°C potential warming once the short lived aerosol effect is abruptly reduced.

Accelerated melting of the ice sheets

The fast rate of the Anthropocoene temperature rise compared to the LGT and PETM (Figure 3) ensues in differences in terms of the adaptation of flora and fauna to new conditions. The shift in state of the Earth’s climate is most acutely manifested in the poles, where warming leads to weakening of the jet stream boundaries which are breached by outflow of cold air fronts, such as the recent “Beast from the East” event, and penetration of warm air masses.

As the poles keep warming, to date by a mean of ~2.3°C, the shrinking of the ice sheets per year has accelerated by a factor of more than six fold (Figure 4). Warming of the Arctic is driven by the ice-water albedo flip, where dark sea-water absorbing solar energy alternates with high-albedo ice and snow, and by the weakening of the polar boundary and jet stream.

Greenland. The threshold of collapse of the Greenland ice sheet, retarded by hysteresis, is estimated in the range of 400-560 ppm CO₂, already transgressed at the current 496 ppm CO₂equivalent (Figure 4). The Greenland mass loss increased from 41 ± 17 Gt/yr in 1990–2000, to 187 ± 17 Gt/yr in 2000–2010, to 286 ± 20 Gt/yr in 2010–2018, or six fold since the 1980s, or 80 ± 6 Gt/yr per decade, on average.

Antarctica. The greenhouse gas level and temperature conditions under which the East Antarctic ice sheet formed during the late Eocene 45-34 million years ago are estimated as ~800–2000 ppm and up to 4 degrees Celsius above pre-industrial values, whereas the threshold of collapse is estimated as 600 ppm CO₂ or even lower. The total mass loss from the Antarctic ice sheet increased from 40 ± 9 Gt/yr in 1979–1990 to 50 ± 14 Gt/yr in 1989–2000, 166 ± 18 Gt/yr in 1999–2009, and 252 ± 26 Gt/yr in 2009–2017. Based on satellite gravity data, the East Antarctic ice sheet is beginning to breakdown in places (Jones 2019), notably the Totten Glacier (Rignot et al., 2019), which may be irreversible. According to Mengel and Levermann (2014), the Wilkes Basin in East Antarctica alone contains enough ice to raise global sea levels by 3–4 meters.

Figure 4. (A) New elevation showing the Greenland and Antarctic current state of the ice sheets accurate to a few meters in height, with elevation changes indicating melting at record pace, losing some 500 km³ of ice per-year into the oceans; (B) Ice anomaly relative to the 2002-2016 mean for the Greenland ice sheet (magenta) and Antarctic ice sheet (cyan). Data are from GRACE; (C) the melting of sea ice 1978-2017, National Snow and Ice Data Center (NCIDC)

C. Migration of climate zones

The expansion of warm tropical zones and the polar-ward migration of subtropical and temperate climate zones are leading to a change in state in the global climate pattern. The migration of arid subtropical zones, such as the Sahara, Kalahari and central Australian deserts into temperate climate zones ensues in large scale droughts, such in inland Australia and southern Africa. In the northern hemisphere expansion of the Sahara desert northward, manifested by heat waves across the Mediterranean and Europe (Figure 5).
Figure 5. (A) Migration of the subtropical Sahara climate zone (red spots) northward into the Mediterranean climate
zone leads to warming, drying and fires over extensive parts of Spain, Portugal, southern France, Italy, Greece and
Turkey, and to melting of glaciers in the Alps. Migration, Environment and Climate Change, International
Organization for Migration Geneva – Switzerland (GMT +1); Source: https://environmentalmigration.iom.int/maps

Figure 5. (B) Southward encroachment of Kalahari Desert conditions (vertical lines and red spots) leading to
warming and drying of parts of southern Africa. Source: https://environmentalmigration.iom.int/maps
Figure 5. (C) Drying parts of southern Australia, including Western Australia, South Australia and parts of the
eastern States, accompanied with increasing bushfires. Source: https://environmentalmigration.iom.int/maps
Climate extremes

Since the bulk of terrestrial vegetation has evolved under glacial-interglacial climate conditions, where GHG range between 180 - 300 ppm CO₂, global warming is turning large parts of Earth into a tinderbox, ignited by natural and human agents. By July and August 2019, as fires rage across large territories, including the Amazon forest, dubbed the Planet’s lungs as it enriches the atmosphere in oxygen. When burnt the rainforest becomes of source of a large amount of CO₂ (Figure 6.B), with some 72,843 fires in Brazil this year and extensive bushfires through Siberia, Alaska, Greenland, southern Europe, parts of Australia and elsewhere, the planet’s biosphere is progressively transformed. As reported: ‘Climate change is making dry seasons longer and forests more flammable. Increased temperatures are also resulting in more frequent tropical forest fires in non-drought years. And climate change may also be driving the increasing frequency and intensity of climate anomalies, such as El Niño events that affect fire season intensity across Amazonia.’

Extensive cyclones, floods, droughts, heat waves and fires (Figure 6.B) increasingly ravage large tracts of Earth. However, despite its foundation in the basic laws of physics (the black body radiation laws of Planck, Kirchhoff' and Stefan Boltzmann), as well as empirical observations around the world by major climate research bodies (NOAA, NASA, NSIDC, IPCC, World Meteorological Organization, Hadley-Met, Tindale, Potsdam, BOM, CSIRO and others), the anthropogenic origin, scale and pace of climate change remain subject to extensively propagated denial and untruths.

Figure 6. (A) Extreme weather events around the world 1980-2018,
including earthquakes, storms, floods, droughts. Munich Re-insurance.
Figure 6. (B) A satellite infrared image of South America fires (red dots) during July and August, 2019, NASA.

An uncharted climate territory

Whereas strict analogies between Quaternary and Anthropocene climate developments are not possible, elements of the glacial-interglacial history are relevant for an understanding of current and future climate events. The rise of total greenhouse gas (GHG), expressed as CO₂-equivalents, to 496 ppm CO₂-e (Figure 1), within less than a century represents an extreme atmospheric event. It raised GHG concentrations from Holocene levels to the range of the Miocene (34–23 Ma) when CO₂ level was between 300 and 530 ppm. As the glacial sheets disintegrate, cold ice-melt water flowing into the ocean ensue in large cold water pools, a pattern recorded following peak interglacial phases over the last 450,000 years, currently manifested by the growth of cold regions in north Atlantic Ocean south of Greenland and in the Southern Ocean fringing Antarctica (Figure 7).

Warming of +3°C to +4°C above pre-industrial levels, leading to enhanced ice-sheet melt, would raise sea levels by at least 2 to 5 meters toward the end of the century and, delayed by hysteresis, likely by 25 meters in the longer term. Golledge et al. (2019) show meltwater from Greenland will lead to substantial slowing of the Atlantic overturning circulation, while meltwater from Antarctica will trap warm water below the sea surface, increasing Antarctic ice loss. Whereas the effect of low-density ice melt water on the surrounding oceans is generally not included in many models, depending on amplifying feedbacks, prolonged Greenland and Antarctic melting and consequent cooling of surrounding ocean sectors as well as penetration of freezing air masses through weakened polar boundaries may have profound effect on future climate change trajectories (Figure 8).

Figure 7. (A) Global warming map (NASA 2018). Note the cool ocean regions south of Greenland and 
along the Antarctic. Credits: Scientific Visualization Studio/Goddard Space Flight Center; 
(B) 2012 Ocean temperatures around Antarctica (NASA 2012).
Climate projections for 2100-2300 by the IPCC AR5 Synthesis Report, 2014 portray predominantly linear to curved models of greenhouse gas, global temperatures and sea level changes. These models however appear to take limited account of amplifying feedbacks from land and ocean and of the effects of cold ice-melt on the oceans. According to Steffen et al. (2018) “self-reinforcing feedbacks could push the Earth System toward a planetary threshold” and “would lead to a much higher global average temperature than any interglacial in the past 1.2 million years and to sea levels significantly higher than at any time in the Holocene”.

Amplifying feedbacks of global warming include:
  • The albedo-flip of melting sea ice and ice sheets and the increase of the water surface area and thereby sequestration of CO₂. Hudson (2011) estimates a rise in radiative forcing due to removal of Arctic summer sea ice as 0.7 W/m², a value close to the total of methane release since 1750.
  • Reduced ocean CO₂ intake due to lesser solubility of the gas with higher temperatures.
  • Vegetation desiccation and burning in some regions, and thereby released CO₂ and reduced evaporation and its cooling effect. This factor and the increase of precipitation in other regions lead to differential feedbacks from vegetation as the globe warms (Notaro et al. 2007).
  • An increase in wildfires, releasing greenhouse gases (Figure 6).
  • Release of methane from permafrost, bogs and sediments and other factors.
Linear temperature models appear to take limited account of the effects on the oceans of ice melt water derived from the large ice sheets, including the possibility of a significant stadial event such as already started in oceanic tracts fringing Greenland and Antarctica (Figure 7) and modeled by Hansen et al, (2016). In the shorter to medium term sea level rises would ensue from the Greenland ice sheet (6-7 meter sea level rise) and West Antarctic ice sheet melt (4.8 meter sea level rise). Referring to major past stadial events, including the 8200 years-old Laurentian melt and the 12.7-11.9 younger dryas event, a protracted breakdown of parts of the Antarctic ice sheet could result in major sea level rise and extensive cooling of southern latitudes and beyond, parallel with warming of tropical and mid-latitudes (Figure 8) (Hansen et al. 2016). The temperature contrast between polar-derived cold fronts and tropical air masses is bound to lead to extreme weather events, echoed among other in Storms of my grandchildren (Hansen, 2010).

Figure 8. (A) Model Surface-air temperature (°C) for 2096 relative to 1880–1920 (Hansen et al. 2016).
The projection betrays major cooling of the North Atlantic Ocean, cooling of the circum-Antarctic Ocean
and further warming in the tropics, subtropics and the interior of continents; (B) Modeled surface-air
temperatures (°C) to 2300 AD relative to 1880–1920 for several ice melt rate scenarios, displaying a stadial cooling event at a time dependent on the ice melt doubling time (Hansen et al., 2016). Courtesy Prof James Hansen;.
Within and beyond 2100-2300 projections (Figure 8.A, B) lies an uncharted climate territory, where continuing melting of the Antarctic ice sheet, further cooling of neighboring sectors of the oceans and climate contrasts with GHG-induced warming of land areas (Figure 8.A), ensue in chaotic climate disruptions (Figure 8.B). Given the thousands to tens of thousands years longevity of atmospheric greenhouse gases (Solomon et al., 2009; Eby et al 2009), the onset of the next ice age is likely to be delayed on the scale of tens of thousands of years (Berger and Loutre, 2002) through an exceptionally long interglacial period (Figure 9).

These authors state: ‘The present day CO₂ concentration (now >410 ppm) is already well above typical interglacial values of ~290 ppmv. This study models increases to up to 750 ppmv over the next 200 years, returning to natural levels by 1000 years. The results suggest that, under very small insolation variations, there is a threshold value of CO₂ above which the Greenland Ice Sheet disappears. The climate system may take 50,000 years to assimilate the impacts of human activities during the early third millennium. In this case, an “irreversible greenhouse effect” could become the most likely future climate. If the Greenland and west Antarctic Ice Sheets disappear completely, then today’s “Anthropocene” may only be a transition between the Quaternary and the next geological period.’

Figure 9. Simulated Northern Hemisphere ice volume (increasing downward) for the period 200,000 years BP to 130,000 years in the future, modified after a part of Berger and Loutre 2002. Time is negative in the past and positive in the future. For the future, three CO2 scenarios were used: last glacial-interglacial values (solid line), a human-induced concentration of 750 ppm (dashed line), and a constant concentration of 210 ppm inducing a return to a glacial state (dotted line).
As conveyed by leading scientists “Climate change is now reaching the end-game, where very soon humanity must choose between taking unprecedented action or accepting that it has been left too late and bear the consequences” (Prof. Hans Joachim Schellnhuber) …“We’ve reached a point where we have a crisis, an emergency, but people don’t know that ... There’s a big gap between what’s understood about global warming by the scientific community and what is known by the public and policymakers” (James Hansen).

Climate scientists find themselves in a quandary similar to medical doctors, committed to help the ill, yet need to communicate grave diagnoses. How do scientists tell people that the current spate of extreme weather events, including cyclones, devastating islands from the Caribbean to the Philippine, floods devastating coastal regions and river valleys from Mozambique to Kerala, Pakistan and Townsville, and fires burning extensive tracts of the living world, can only intensify in a rapidly warming world? How do scientists tell the people that their children are growing into a world where survival under a mean temperature higher than +2 degrees Celsius (above pre-industrial temperature) is likely to be painful and, in some parts of the world, impossible, let alone under +4 degrees Celsius projected by the IPCC?

Summary and conclusions
  1. The current growth rate of atmospheric greenhouse gas is the fastest recorded for the last 55 million years.
  2. By the mid-21st century, at the current CO₂ rise rates of 2 to 3 ppm/year, a CO₂-e level of >750 ppm is likely to transcend the climate tipping points indicated by Lenton et al. 2008 and Schellnhuber 2009.
  3. The current extreme rise rates of GHG (2.86 ppm CO₂/year) and temperature (0.15-0.20°C per decade since 1975) raise doubt with regard to linear future climate projections.
  4. Global greenhouse gases have reached a level exceeding the stability threshold of the Greenland and Antarctic ice sheets, which are melting at an accelerated rate.
  5. Allowing for the transient albedo-enhancing effects of sulphur dioxide and other aerosols, mean global temperature has reached approximately 2.0 degrees Celsius above per-industrial temperatures.
  6. Due to hysteresis the large ice sheets would outlast their melting temperatures.
  7. Land areas would be markedly reduced due to a rise to Miocene-like sea levels of approximately 40±15 meters above pre-industrial levels.
  8. Cold ice melt water flowing from the ice sheets into the oceans at an accelerated rate is reducing temperatures in large tracts in the North Atlantic and circum-Antarctic.
  9. Strong temperature contrasts between cold polar-derived and warm tropical air and water masses are likely to result in extreme weather events, retarding habitats and agriculture over coastal regions and other parts of the world.
  10. In the wake of partial melting of the large ice sheets, the Earth climate zones would continue to shift polar-ward, expanding tropical to super-tropical regions such as existed in the Miocene (5.3-23 million years ago) and reducing temperate climate zones and polar ice sheets.
  11. Current greenhouse gas forcing and global mean temperature are approaching Miocene Optimum-like composition, bar the hysteresis effects of reduced ice sheets (Figure 4.A).
  12. The effect of high atmospheric greenhouse gas levels would be for the next ice age to be delayed on a scale of tens of thousands of years, during which chaotic tropical to hyperthermal conditions would persist until solar radiation and atmospheric CO₂ subsided below ~300 ppm.
  13. Humans will survive in relatively favorable parts of Earth, such as sub-polar regions and sheltered mountain valleys, where gathering of flora and hunting of remaining fauna may be possible.

A Postscript

The author, while suggesting the projections made in this paper are consistent with the best climate science with which he is aware, sincerely hopes the implications of these projections would not eventuate.