High Rate of Spreading of the the Arctic Atmospheric Global Warming Veil South of the Gulf Coast is Driven by Deep Seated Methane Release from Giant Mantle Geopressured-Geothermal Reservoirs below the Siberian Craton at Depths of 100 km to 300 km and at Temperatures above 1200 Degrees Celsius
by Malcolm P.R. Light
February 28th, 2014
Abstract
During the Late Permian (Figures 16 to 19) there was a major global extinction event which resulted in a large loss of species caused by catastrophic methane eruptions from destabilization of subsea methane hydrates in the Paleo-Arctic (Figures 16, 17 and 13a)(Wignall 2009). Extreme global warming was caused when vast volumes of carbon dioxide were released into the atmosphere from the widespread eruption of volcanics in northern Siberia (Siberian Traps Large Igneous Province) (Figure 17; Wignall 2009) whose main source zone on land in northern Siberia is not a great distance from the present trend of the Gakkel Ridge and the Enrico Pv Anomaly extreme methane emission zone (Figure 17). Because the Arctic forms a graveyard for subducted plates, the mantle there is highly fractured and it is also primary source zone for mantle methane formed from the reduction of oceanic carbonates by water in the presence of iron (II) oxides buried to depths of 100 km to 300 km in the Asthenosphere and at temperatures above 1200
°C (Figures 12, 13a and 15) (Gaina et al. 2013; Goho 2004; Merali 2004).
In addition to the widespread eruption of volcanics in Northern Siberia in the Late Permian (250 million years ago), swarms of pyroclastic kimberlites erupted between 245 and 228 million years ago along a NNE trending shear system in the mantle which extends up the east flank of the Lena River delta and intersects the Gakkel Ridge slow spreading ridge on the East Siberian Arctic Shelf (Figures 17 to 19, LIP 2013). Cenozoic volcanics also occur to the north and north east of the Lena River delta marking the trend of the slow spreading Gakkel Ridge on the East Siberian Arctic Shelf (Sekretov 1998). All this pyroclastic activity along the slow spreading Gakkel Ridge from the Late Permian to the present is evidence of deep pervasive vertical mantle fracturing and shearing which has formed conduits for the release of carbon dioxide and deeply sourced mantle methane out of the Arctic sea floor and then into the atmosphere (Figures 12, 13a, 15, 17, 18 and 19).
During the Late Permian these events initiated a massive eruption phase along the entire central and north eastern part of the Taimyr Volcanic arc producing an extremely wide and thick sheet-like succession of flood trap lavas and tuffs that spread south eastwards over the Siberian Craton (Figure 17). The massive volume of carbon dioxide released into the atmosphere during these cataclysmic eruptions produced extreme global warming in the air and oceans which dissasocciated the Paleo-Arctic subsea methane hydrates and the methane hydrate seals above the Enrico Pv Anomaly generating a massive seafloor and mantle methane pulse into the atmosphere (Figures 13a and 17)(Wignall. 2009). This release of methane caused the average atmospheric temperature to rise to 26.6
°C producing the Major Late Permian Extinction Event (Wignall, 2009). Our present extreme fossil fuel driven carbon dioxide global warming is predicted to produce exactly the same methane release from the subsea Arctic methane hydrates and deep mantle methane from the Enrico Pv Anomaly Extreme Methane Emission Zone by the 2050's, leading to total deglaciation and the extinction of all life on Earth.
What mankind has done in his infinite stupidity, with his extreme hydrocarbon addiction and fossil fuel induced global warming, has opened a giant, long standing (Permian to Recent) geopressured, mantle methane pressure-release safety valve (Enrico Pv Anomaly Extreme Methane Emission Zone) for gases generated between 100 km and 300 km depth and temperatures above 1200
°C in the asthenosphere (Figures 4, 6, 12 and 15). This is now a region of massive methane emissions (Carana, 2014). There is now no fast way to reseal this system because it will require extremely quick cooling of the Arctic Ocean, which cannot be achieved in the short time frame we have left to complete the job. Our only hope is to destroy the methane in the water before it gets into the atmosphere and simultaneously destroy the existing atmospheric methane using radio-laser systems (Alamo and Lucy Projects, Light and Carana, 2012, 2013). Scientists at Georgia Tech University have found that at very low temperatures in the ocean, two symbiotic methane eating organisms group together, consume methane in the presence of tungsten and excrete carbon dioxide which then reacts with minerals in the water to form carbonate mounds (Glass et al. 2013). This means that the United States must fund a major project at Georgia Tech to quickly develop the means to grow these methane consuming bacteria in massive quantities with their tungsten enzyme and find the means to deliver them to the Polar oceans as soon as possible.

Introduction
The Extreme Arctic Methane Eruption Zone (a) is located where the Gakkel mid-ocean ridge enters the Laptev Sea at the end of the Eurasian Basin (Figure 1, Wales from IBCAO, 2013). Methane eruption sites also appear at locations (b.) and (c.) north of Svalbard located above old mantle shear faults which also form plate boundaries (Figure 1). In Figure 1 the slow-spreading Gakkel mid-ocean ridge coverges toward the Laptev Sea and Siberia and is spreading in a wedge like fashion at 1.33 cm/year off Greenland to 0.63 cm/year off Siberia (Wales, 2013). The Gakkel mid-ocean ridge formed in the Cenozoic (Palaeocene) 58 million years ago (Wales 2013).

Figure 2 shows two views of the steep eastern end of the Eurasian Basin where the Gakkel Ridge enters the Laptev Sea. It is here that the Extreme Methane Eruption Zone is located as well as the Enrico Pv (pressure sound wave velocity) Anomaly (Gebco 1979; IBCAO 2000, Gusev 2013; Yakovlev et al. 2012). Linear zones of methane emissions north of Svalb
ard, almost at right angles to the trend of the Gakkel Ridge are probably more deeply sourced methane that has entered along mantle shear fault system and plate boundary zones (Figure 3a, Carana 2014).

The most Extreme Methane Emission Zone in the Arctic occurs at the transition of the Eurasian Basin to the Laptev Sea where the Gakkel Ridge is covered by hydrothermal methane hydrates (Figure 3b and 4, Max and Lowrie 1993, Light 2012) and is most clearly defined on the USGS methane atmospheric concentration map where it forms methane clouds about 2.5 km to 3 km in height (Carana, 2013, 2014). Three distinctly different types of methane emission can be seen on Figure 4 (Light 2012 after Pravettoni, 2009). The western half of the Laptev Sea and Kara Seas were covered by low and fairly constant atmospheric methane concentrations between 2 and 2.5 ppm (Figure 4).
To the east higher more variable methane concentrations occur above the shallow part of the Laptev Sea and East Siberia Sea (2.5 to 5.75 ppm)(Figure 4). A zone of extreme methane emissions lies between these centred at latitude 132
° (range 125
° to 135
°) where the atmospheric methane concentration peaks at about 8.3 ppm (Pravettoni 2009).

The Extreme Methane Emission Zone at the junction of the Laptev Sea and the Eurasian Basin is marked by a particular type of methane hydrate associated with hydrothermal emanations from the slow-spreading Gakkel Ridge (Figure 5; Max and Lowrie 1993). Another belt of these Gakkel Ridge hydrothermal methane hydrates also occurs along the plate boundary zone north and west of Svalbard (Figure 5; Max and Lowrie, 1993). This suggests a much deeper source zone for the methane in these hydrothermal methane hydrate regions than found elsewher in the Arctic.
The location of the Enrico Pv (sound pressure wave velocity) Anomaly at the junction of the Eurasian Basin and Laptev Sea is shown in Figure 6 at 100 km and 220 km depth within the asthenosphere part of the Earth's mantle (from Yakovlev et al. 2012). The Enrico Pv Anomaly occurs beneath the region (Figure 2) where there are deep hydrothermal methane hydrates (Figure 5; Max and Lowrie 1993) and the Extreme Methane Emission Zone occurs (Figure3b Light 2012; Carana 2013, 2014). The centre of the Enrico Pv Anomaly is marked by a pressure sound wave velocity anomaly (dv/V)% of about -1.6 (Yakovlev et al. 2012).
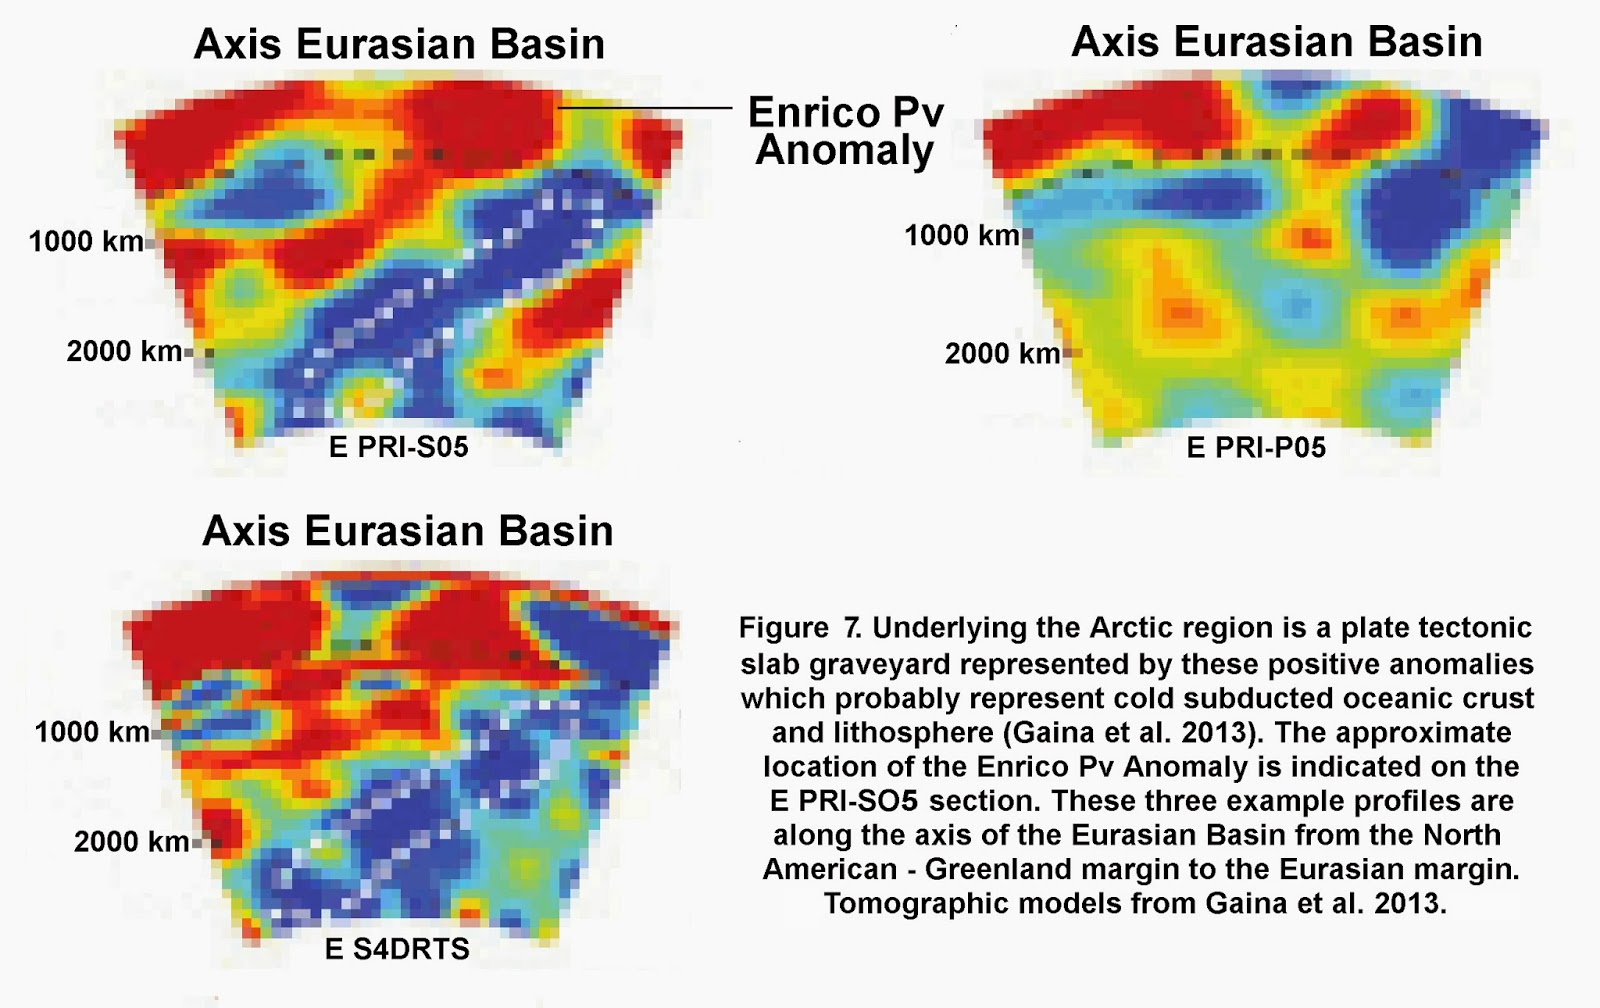
A plate-tectonic oceanic-slab graveyard underlies the Arctic region and is represented by positive anomalies on Figure 7. which probably represent cold subducted oceanic crust and lithosphere (Gaina et al. 2013). The Enrico Pv Anomaly located on the updip edge of one of these subducted oceanic slabs (Figure 7; Gaina et al. 2013).
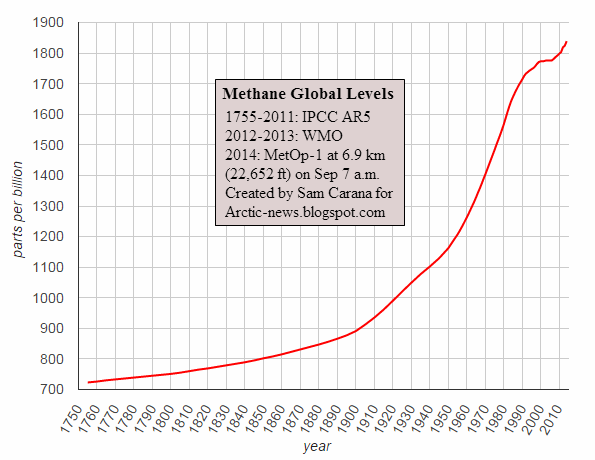
The global atmospheric methane concentration levels in the last quarter of 2013 and in January 2014 are shown on Figures 8, 9a, 9b (from Carana, 2014; Harold Hensel pers com. 2014).

The latitudinal front of the Methane Global Warming Veil for an 1850 ppb atmospheric methane concentration is clearly visible (the southern boundary of the orange zone) crossing the north end of Baja California and running parallel to, but north of the Gulf Coast (Carana 2014).
The southwards movement of the 1850 ppm atmospheric methane concentration front during one year (Figure 9a from Carana 2014) was used to determine when the Methane Global Warming Veil will completely envelop the Earth.
The likely pressure of the methane source was also estimated, here assumed to be the Extreme Methane Eruption Zone at the transition from the Eurasian Basin to the Laptev Sea.
The rate of spreading of the Methane Global Warming Veil and the fast escalation of the methane concentrations in the Arctic atmosphere through time (Carana, 2012, 2013, 2014) were used to calibrate the actual tropospheric and stratospheric atmospheric methane concentration curve (Figure 10).
This curve fixes the time when the 8
°C atmospheric temperature anomaly will be exceeded indicating that total deglaciation and major extinction will occur by about 2053 (Figure 10).
The buildup of the global atmospheric methane concentration (Figure 11) indicates that the oceans should start to boil off at 115
°C to 120
°C when the atmospheric methane concentration anomaly exceeds 20,000 ppb (20 ppmv) by 2080. The atmospheric temperatures will approach those on the surface of Venus (460
°C to 467
°C) when the atmospheric methane concentration anomaly reaches 80,000 ppb (80 ppmv) by 2100 (Figure 11).
Bubbles of methane formed from reactions between iron oxide, calcite and water at high temperatures and pressures, during the simulation of conditions in the Earth's Mantle (asthenosphere) (Figure 12, Goho 2004).
The yellow zone on Figure 13a is the region in the asthenosphere below 100 km depth where methane is stable and is generated from the reaction of water and calcite in the presence of iron (II) oxide at temperatures above 1200
°C (Merali 2004; Goho 2004; Scott et al. PNAS).
Shallower methane can also be generated in sea water convection cells on the flanks of mid-ocean ridges (Figure 13b), but the required pressure source for the expanding 1850 ppb Global Methane Warming Veil is far to high for this to be the origin of the Extreme Methane Emission Zone.
The relative vertical micro-crack porosity of the Enrico Pv (sound pressure wave velocity) Anomaly has been calculated from sound wave velocities by the O'Connel model (Liu et al. 2001) calibrated to the known porosity of the Anderson et al. model (Figure 14a, Liu et al. 2001; Anderson et al. 1974; Anderson 1989).

The relative porosity of the standard crust and mantle using PREM data (Dziewonski and Anderson, 1981) has also been determined by the same method (Figure 14a).
Typical pressures, temperatures and depths within the Earth's interior are shown in Table 1 with part of the asthenosphere methane generation zone shown in yellow (Braile 2012, Merali 2004; Goho 2004; Scott et al. PNAS). In the Earth's mantle elongated olivine crystals form a large part of the rock (Table 1) and become aligned by vertical flow in the asthenosphere between 100 km and 350 km within rising mid ocean ridge magmas (e.g. the Gakkel Ridge) and in downwelling subduction zones such as the High Arctic (Figures 14b and 14c, Anderson 1989 and Gaina et al. 2013).
These also represent regions (such as the Enrico Pv Anomaly) where vertical gas filled micro-crack fractures form in regions where geopressured-geothermal methane is generated by the reaction of of calcite, water and iron (II) oxide at temperatures above 1200°C and depths between 100 km and 300 km (Merali 2004; Goho 2004; Scott et al. PNAS).
An estimated relative vertical micro-crack porosity of 0.9% at 220 km depth in the Enrico Pv Anomaly (Figure 15) is 3.5 times larger than the relative horizontal micro-crack porosity of the mean asthenosphere at 220 km calculated from from PREM data (Dziewonski and Anderson 1981).
At a depth of 100 km in the Enrico Pv Anomaly, the relative vertical micro-crack porosity has halved to 0.43% but it is now almost 11 times higher than the relative horizontal micro-crack porosity of the mean asthenosphere/base lithosphere at 100 km depth (PREM data, Dziewonski and Anderson 1981). It is possible that the relative vertical porosity in the Enrico Pv Anomaly may reach 14% at shallow depths (10 km to 4 km) as this is the estimated carbon dioxide volume in pyroclastic gas charged volcanics at depths of 4 km on the Gakkel Ridge (Sohn 2007). This makes the Enrico Pv Anomaly a very effective vertical conduit for the escape of geopressured-geothermal methane generated in the asthenosphere which will allow it to vent upwards into the lithosphere, crust, ocean and thence into the Arctic atmosphere to form the fast expanding Methane Global Warming Veil.
Note that in the average asthenosphere (PREM data Dziewonski and Anderson, 1981) there appears to be a zero porosity seal line forming a transition from relative horizontal micro-crack porosity within the underlying horizontally micro-cracked and convecting asthenosphere which drives plate tectonics and the relative vertical micro-crack porosity within the upper asthenosphere between 114.4 km and 100 km where vertically rising partial melt magmas accumulate at the base of the lithosphere (Figures 14 and 15). The vertically micro-fractured zone between 114.4 km and 100 km in the asthenosphere also corresponds to the zone between 100 km and 110 km where normal island arc volcanics form vertically rising magmas above a subduction zone from the effect of fluids released into the asthenosphere due to dehydration of the subducting slab of oceanic crust (Lecture 5 2014; Columbia, 2014).
 Figure 15 is a north-south schematic cross-section over the Enrico Pv Anomaly (100 km to 220 km depth-Yakovlev et al. 2012) which corresponds to the zone of most extreme methane eruptions along the slow-spreading pyroclastic Gakkel Ridge at the point where the Eurasian Basin abuts the Laptev Sea (Pravettoni 2009; Light 2012).
This also represents a zone of hydrothermal methane hydrates formed from hydrothermal methane emissions (Max and Lowrie 1993).
Using the 1850 ppb atmospheric concentration calculated methane global warming veil spreading rate and the estimated pressure of the source regions, the timing of when different depths will be subjected to depressurization in the Enrico Pv Anomaly are shown as dates on the right of the Enrico Pv Anomaly in Figure 15.
The 1850 ppb methane global warming veil is presently drawing from slightly deeper than 112 km in the upper vertically micro-fractured asthenosphere within the mantle methane generation zone (Merali 2004; Goho 2004; Scott et al. PNAS) and will reach the South Pole by 2046.
The entire column of geopressured-geothermal methane in the asthenosphere between 100 km to 300 km depth will start to drain via the Enrico Pv Anomaly into the Arctic ocean and atmosphere by 2053 by which time the Earth's atmospheric temperature anomaly will have exceeded 8°C and we will be facing total global deglaciation and a major extinction event (Figure 15).

During the Late Permian (Tartarian - 250 Ma) the tectonic plates were arranged as in Figure 16 (Lawver et al. 2009). This was the time the Siberian Trap volcanics (Large Igneous Province) erupted releasing vast volumes of carbon dioxide into the atmosphere which destabilized the subsea methane hydrates in the Paleo-Arctic and resulted in a major global warming and mass extinction event (Wignall 2009). A Paleo-Arctic Ocaen already existed in the Late Permian, 250 Ma ago as did the location of the Enrico Pv Anomaly extreme methane emission zone (Figures 16 and 17). The Enrico Pv Anomaly which presently forms an extreme Arctic methane emission zone developed at the intersection of the trend of the Gakkel Ridge, the Kara Subduction Zone in the south and the southern plate boundary of the Paleo Arctic Ocean to the north (Figure 17). The Enrico Pv Anomaly was probably also a massive mantle methane eruption vent during the Late Permian Major Extinction Event (Figures 16 and 17).

The widespread Siberian Trap basalts (Large Igneous Province) erupted along the Taimyr Arc on the NW side of the Taimyr Fold Belt and the Siberian Craton (Figures 16, 17 and 18; Ivanov et al. 2008; LIP 2013). Siberian trap carbonatites and alkaline complexes sourced from less than 100 km depth and kimberlites from below 150 km depth intruded between 245 Ma and 225 Ma due to continued easterly subduction along the Taimyr Arc (Late Permian to Triassic) which was partly driven by oceanic crust spreading along the Kara rift on the Barents Plate (235 Ma to 218 Ma)(Figures 17 to 19)(Khain 1994; Zohenstain et al. 1990; LIP 2013; Petrology 2013).

Present zones of atmospheric methane eruptions occur offshore Svalbard where the Gakkel Ridge is cut by a plate boundary (Figure 17). A linear zone of atmospheric methane eruptions mark out an old shear fault systems in the Gakkel Ridge which is an extension of a north Greenland plate boundary (Figure 17). The distribution of different aged Kimberlites on the Siberian Craton that define a NE trending mantle shear zone are shown in Figures 18 and 19 (Petrology 2013; LIP 2013). The kimberlites get younger to the NE and a major HALIP kimberlite swarm has intruded into the Laptev Sea, as have other Cenozoic intrusives along the probable trend of the Gakkel Ridge across the East Siberian Arctic Shelf (LIP 2013; Sekretov 1998).
 The eruption of subsea methane torches from shallow methane hydrate deposits produce a pock-marked ocean floor in the Arctic (Figure 20a, Paull et al. 2007; Carana 2011). These pock-marks contain carbonate mounds (C1, C2) and methane hydrate pingoes (P1, P2) at the top end of methane emission conduits formed by vertical fractures/faults/shears in sediments (Hovland et al. 2006; Carana 2011).
The pingoes were formed, when methane escaping from methane hydrates depressurized and adiabatically cooled the fractures developing an icy seal for the escaping gas (Hovland et al. 2006; Carana 2011). Similar seals must have formed at the top of the vertical micro-crack fractures in the extreme methane eruption zones during the cooler past, but have now been breached by fossil-fuel carbon-dioxide-pollution-induced global warming, opening the taps on an immense geopressured-geothermal methane reservoir in the mantle between 100 km and 300 km depth (Figures 13a, 15, 20a and 20b).
The supply of mantle methane gas is so vast that if we are not able to destroy it in the oceans and the atmosphere it will soon lead to our extinction by the mid century (2053)(Light 2014).

Extreme Arctic Methane Eruption Centre and the Origin of the Gas in the Earth's Mantle
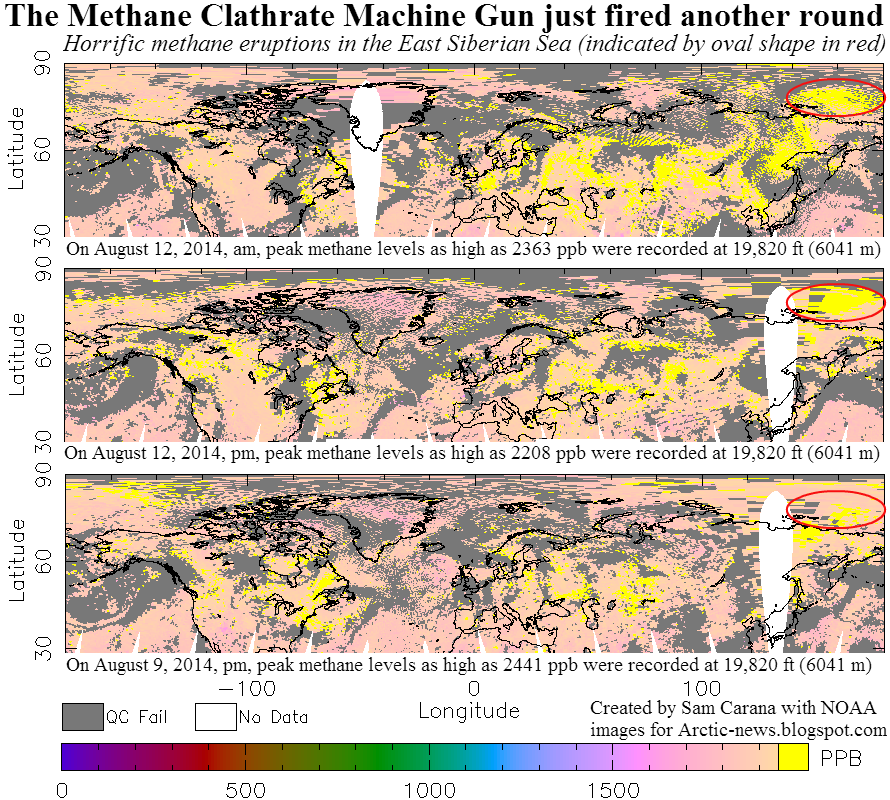
Images from NASA (Figures 8, 9a and 9b, Carana 2014) clearly define the low level atmospheric Arctic Methane Global Warming Veil and allow its rate of advance to be determined from the southwards latitudinal movement of the various fronts of the concentration profile (Carana 2013 and 2014). Three atmospheric methane concentration levels are shown on these maps, 1750 ppb; 1850 ppb and more than 1950 ppb (Carana 2013 and 2014). The 1750 ppb methane concentration front is now in the southern hemisphere of the Earth, completely surrounds and is very close to Antarctica (Figure 9b). Its exact boundary is very diffuse and has not been used in this analysis. The atmospheric methane concentration rise between 1850 ppb and 1750 ppb is the reason for the extreme summer heating, with uncontrollable wildfires in Australia which has resulted in a 0.22°C temperature rise in 2013 (Light 2013). At this rate of temperature increase the temperature anomaly in 33 years will be more than 8°C (7.26°C + 0.8°C, the present temperature anomaly) and the world will be facing total deglaciation and extinction between 2047 and 2053.
The southward movement of the 1850 ppb atmospheric methane concentration anomaly is more clearly visible in the northern hemisphere and has been imaged over two identical time periods one year apart (January 1 - 11, 2013 and 2014) by Carana (2014)(Figure 9a). On enhanced versions of these figures the southerly latitudinal advance of the 1850 ppm boundary was determined by its intersection with the coastline of the United States and the determined latitudes used to find the rate of expansion of the growing Arctic methane global warming veil for heights below about 7 km altitude as below (Figure 9a).
The surface area of a spherical zone on a hemisphere of the Earth is equal to 2*Pi*r*h (Larousse and Auge, 1968).
Where:-
r = the mean radius of the Earth = 6371 km
(Lide and Frederickse, 1995)
h = the vertical height of the zone in km
In January (1-11) 2013 the front of the 1850 ppb atmospheric methane global warming veil was close to 35.2° North (Figure 9a). By January (1-11) 2014, the front of the atmospheric global warming veil had moved south so that it now lay near the Gulf Coast at a Latitude of 32° North (Figure 9a). The surface area (a) between these two latitudinal lines which equals the surface expansion of the atmospheric methane global warming veil in one year and can be solved as below:-
a = 2*Pi*r*(h1 - h2) Where:-
h1 = the height of the 35.2° north latitude zone in km
h2 = the height of the 32° north latitude zone in km
r = the mean radius of the Earth = 6371 km
(Lide and Frederickse, 1995)
h = r*Sin(Latitude)
Therefore:-
a=2*Pi*r*r*(Sin (35.2o) - Sin (32o)) = 11727381.43 square km
The area (a) of the Earth that was covered in exactly one year (365.25636 days - Lide and Frederickse 1995) by the spreading 1850 ppb atmospheric methane global warming veil between January (1-11¬), 2013 to 2014 is 11727382.43 square km. Therefore the 1850 ppb methane global warming veil is spreading at 32107.3 square km per day or 3.21073*Ten power 14 square cm per day. At 32° north the small circle latitude line is 2*Pi*r*Cos (Latitude) = 33947.5125 km long. Hence at a latitude of 32°, the 1850 ppb atmospheric methane global warming veil is advancing south at about 946 metres per day (Figure 9a). The 1850 ppb atmospheric methane global warming veil will reach the South Pole in 2047 and when it passes over Australia will cause even more extreme temperature anomalies than the country has already had to face during the last few years. Almost identical results were found using the 1860 ppm front for the Methane Global Warming Veil imaged on different maps by Carana 2014 so the results for the 1850 ppb front are discussed, as this boundary is the most continuous and well defined (Figures 8, 9a and 9b).
Gas flow rates per unit methane "diffusion coefficient" (flow rate constant at 20°C and one atmosphere pressure) are directly proportional to the partial pressures of the methane gas when standardised to 20°C. This is close to the maximum Arctic atmospheric temperature anomaly (Carana 2013, 2014) and atmospheric pressure at the surface of the ocean (Marero and Mason 1972; Kostin et al 1984) at the Extreme Methane Emission Zone that occurs at the transition from the Eurasian Basin to the Laptev Sea (Figures 3 and 4). Therefore the relative methane partial pressure can be estimated at the sea surface above the extreme Arctic methane emission zone by multiplying the ratio of the rate of expansion of the 1850 ppb atmospheric methane global warming veil to methane "diffusion coefficient" multiplied by the partial pressure of an atmospheric methane concentration of 1850 ppb measured at 20°C and atmospheric pressure (Lide and Frederickse, 1995).
The temperature anomaly at the Arctic Ocean sea surface in the Extreme Methane Emission Zone at the junction of the Eurasian Basin/Laptev Sea has exceeded 20°C during the winters of 2013 and 2014 (Figures 3 and 4, Light 2012; Pravettoni 2009; Carana 2013 and 2014). Therefore we can roughly assume a standard temperature-pressure regime of 20°C and one atmosphere at sea level for the moment that the erupting deeply sourced methane gas comes in contact with the base of the Arctic atmospheric Methane Global Warming Veil. This is the moment when these deeply sourced methane eruptions are in pressure continuity with the partial pressure of the 1850 ppb methane in the Arctic atmospheric global warming veil. In other words, the emission rate of the mantle methane is such that it links the deeply sourced pressure field of the mantle source zone with the partial pressure field of the 1850 ppb methane atmospheric concentration at sea level, at one atmosphere pressure and a temperature of 20°C. At 20°C and one atmosphere pressure (1.01325*Ten power 5 Pascals), the diffusion rate of methane ("diffusion coefficient") in air is 0.106 square cm per second which is 9158.4 square cm per day (Lide and Frederickse 1995). At atmospheric pressure, the flow rate of methane is proportional to the product of the diffusion coefficient and partial pressure so long as the gas lies in a regime where binary collisions predominate (Marreo and Mason 1972; Kestin 1984). Consequently we find that the high rate of spreading of the 1850 ppb Arctic atmospheric methane global warming veil at sea level and 20°C is 3.5058 * Ten power 10 times as fast as the natural diffusion rate. This means that a massively high methane pressure field must be being tapped in the Arctic to cause such high rates of expansion of the Arctic atmospheric Methane Global Warming Veil over the Earth.
The high rate of expansion of the 1850 ppb methane global warming veil of 32107.3 square km per day caused by the excessive rate of subsea methane emissions at the extreme methane emission zone is equivalent to a relative methane pressure field at the source of the methane of 35979 atmospheres or 36.4 kilobars/3.64*Ten power 9 pascals/3.64 Gpa (Gigapascals). This is equivalent to a depth of about 112.2 km (with temperatures near 1220°C) in the upper part of the Earth's mobile asthenosphere, the horizontal convection of which drives the Earth's plate tectonic overturning (Figures 13a and 15, Table 1)(Windley, 1986). It is clearly evident that humanities addiction to fossil fuel, which has caused the extreme carbon dioxide pollution increase and global warming of the Earth's atmosphere has seriously angered somebody down there deep in Mother Earth with fatal consequences for our continued existence.
In the same way that erupting subsea lavas on mid-ocean ridge systems (Figure 13b) are almost at the mantle temperatures (1200°C) which exist below 100 km at the top of the mobile asthenosphere, the massive methane emission flow rates on the Arctic Ocean sea surface above the Extreme Methane Emission Zone at 20°C and atmospheric pressure reflect the exteme pressures of their source zone beneath 100 km in the Earth. This methane is formed from the reaction of calcite with water in the presence of iron (II) oxide below 100 km depth and temperatures above 1200°C (Figures 12 and 13a)(Merali, 2004, Goho 2004; Scott et al., PNAS). The extremely high methane flow rates on the surface of the Extreme Arctic Methane Emission zone are a consequence of existing high rock load pressures within the Earth at depths below 100 km and temperatures above 1200°C that cause the locally generated methane to accumulate in giant geopressured-geothermal reservoirs within the vertically fractured Enrico Pv Anomaly (Extreme Arctic Methane Emission Zone)(Figure 3 to 7, 12, 13a and 15).
The Generation of Mantle Methane
Methane is generated in the mantle of the Earth by the reduction of calcite with water in the presence of Fe (II) oxide at temperatures above 1200°C and depths from 100 km to more than 300 km within the Asthenosphere which is the horizontally convecting part of the mantle that drives plate tectonics (Figures 12 and 13a)(Windley 1986). Partial melt magmas and volatiles accumulate at the top of the asthenosphere between 100 km and 110 km depth later to rise and be erupted as major pyroclastic volcanoes along slow spreading mid-ocean ridge systems such as the Gakkel Ridge (Merali, 2004, Goho 2004; Scott et al., PNAS; Sohn et al. 2007)(Figures 12, 13a and 13b). Russian researchers have generated methane with hydrocarbons up to C10H22 by reacting calcium carbonate, water and iron oxide under mantle pressures and temperatures (Kenney et al. 2002). These compounds are abundant in subduction zones and the mantle (Figures 13a and 13b) (Wales, 2013). Hydrogen also reacts in water with dissolved carbon compounds to form methane and more complex carbon compounds (MacDonald 1988). The formation of methane in the absence of biological reactions is confirmed by the abundance of hydrocarbons in comets (Huebner 1990, Zuppero DOE) and in the atmosphere of Titan, one of Saturn's moons (Glasby 2006; Hook et al. 2010).
Mantle methane will most likely to be formed over regions of subducting oceanic plates where deeply buried zones of previously water, carbonate, organic carbon, iron oxide rich rocks are abundant (Goho 2004). Water has been detected to a depth of at least 12 km (Smithson et al. 2000) although metamorphic reactions in kimberlites indicate its activity within the mantle (Winkler, 1976). The North Arctic Basin is a slab graveyard for subducted oceanic plates making it a prime source zone for the generation of mantle methane within the overlying asthenosphere between 100 km and 300 km depth (Figures 7 and 13a) (Gaina et al. 2013; Goho 2004; Merali 2004). The genesis of methane in the presence of serpentinites is restricted to mid -ocean ridges (like the Gakkel Ridge) and the upper levels of subduction zones (such as the Arctic Ocean slab graveyard Gaina et al. 2013) (Figures 7 and 13a). Methane, carbon dioxide and mantle helium 3 are present in the gases and fluids of mid-ocean ridge spreading centre hydrothermal fields (Figure 13a and 13b)(Chapelle et al. 2002) which have formed the hydrothermal subsea methane hydrates at the Extreme Methane Eruption Center on the Gakkel Ridge at the transition from the Eurasian Basin to the Laptev Sea (Figures 3 to 6)(Max and Lowrie 1993; Pravettoni 2009; Light 2012; Carana 2013). Helium 3 of mantle origin is also found in natural gas fields (Figure 13b)(Peterson USGS; Mineral Commodities - Helium, USGS).
A mantle origin for some methane is confirmed by the presence of hydrocarbon inclusions in diamonds which are generally sourced from about 150 km depth (Figure 13a) (Liu et al. 2004). Diamondiferous kimberlites are also massive carbon dioxide driven, pyroclastic mantle eruptions caused by the reactions between silicates and the rising carbon dioxide charged magmas and they are located along the surface expression of a deep crust-mantle shear zones in the Northern Siberian Craton that extends towards the Gakkel Ridge in the Lena River delta area (Figures 17 to 19)(Yirka 2012). Other swarms of kimberlites occur in the Arctic Basin on the N flank of the Gakkel Ridge ,the HALIP swarm 130 - 90 Ma in age (Figures 17 and 19, LIP 2013). Kimberlites get progressively younger to the NE from 320 Ma in the SW to 90 Ma in the NE where this mantle shear in the Siberian Craton has bisected the Gakkel Ridge in the Arctic Ocean (HALIP swarm, Figure 17 and 19) To the west of this shear, carbonatites and alkaline complexes also occur and probably have their origin at depths less than 100 km, in remobilised subducted carbonate formations from the subducted Arctic Ocean plate graveyard (Figures 6 and 7; Gaina et al. 2013, Yakovlev et al. 2012). The exposed N-S trend of part of this subduction zone may lie to the east in the region of the Lena River (Figures 6, 17 to 19). A north trending and east dipping subduction zone east of the Lena River is represented by the red zones in the 220 km map which extends eastwards into Siberia from the Enrico Pv Anomaly along the Gakkel Ridge (Figure 6; Yakovlev et al. 2012).
The Permian Exinction Event a Remarkably Accurate Analog for the Present Day Carbon Dioxide Driven Methane Emission Extinction Event
During the Late Permian there was a major global extinction event which resulted in a large loss of species caused by catastrophic methane eruptions from destabilization of subsea methane hydrates in the Paleo-Arctic (Figures 16 to 19;Wignall 2009). Extreme global warming was caused after vast volumes of carbon dioxide were released into the atmosphere from the widespread eruption of volcanics in northern Siberia (Siberian Trap Large Igneous Province)(Wignall 2009). The main source zone of these Siberian Trap volcanics on land in northern Siberia, is not a great distance from the present trend of the Gakkel Ridge and the Enrico Pv Anomaly Extreme Methane Emission Zone (Figure 16, 17 and 19). Because the Arctic forms a graveyard for subducted plates (Figures 6 and 7), the mantle there is highly fractured and it is also primary source zone for mantle methane formed from the reduction of deeply buried oceanic carbonates by water in the presence of iron oxides (Figures 12 and 13a) (Gaina et al. 2013; Goho 2004; Merali 2004).
In addition to the widespread eruption of volcanics in northern Siberia in the Late Permian (250 million years ago, LIP 2013; Figures 17 and 19), swarms of pyroclastic Kimberlites erupted between 245 and 228 million years ago along a NE trending shear system in the mantle which intersects the Gakkel Ridge slow spreading ridge on the East Siberian Arctic Shelf (Figures 17 to 19, LIP 2013). A smaller swarm of kimberlites also erupted in the same time interval to the west of this shear associated with carbonatites and alkaline complexes all forming part of the Late Permian (250 million year old) Siberian Trap volcanic Large Igneous Province (LIP 2013). This is a further indication of deep mantle shearing in the Late Permian, which would have produced routes for the escape of deeply sourced carbon dioxide and mantle methane to the surface (Figures 12 and 13a) (Gaina et al. 2013; Goho 2004; Merali 2004).
A large swarm of kimberlites (Cretaceous HALIP event, 130 to 90 million years old) also intruded the axis of the Gakkel Ridge just south of the Enrico Pv anomaly Extreme Methane Emission Zone on the East Siberian Arctic Shelf, while a smaller HALIP event kimberlite swarm occurs south west of the Lena River delta on the major NE trending mantle fracture (Figures 16 to 19, LIP 2013). Cenozoic volcanics also occur to the north and north east of the Lena River delta marking the trend of the slow spreading Gakkel Ridge on the East Siberian Arctic Shelf (Sekretov 1998). All this pyroclastic activity along the slow spreading Gakkel Ridge from the Late Permian to the present is evidence of pervasive vertical deep mantle shearing which has formed conduits for the release of carbon dioxide and mantle methane to the Arctic sea floor and atmosphere and the surface of the northern Siberian craton (Figures 12 to 19).
Locating the Late Permian Taimyr Volcanic Arc
The location of the Late Permian (250 Ma - LIP 2013) Taimyr Volcanic Arc within the Taimyr Fold belt was determined by tracing the exposed edjes of the wide regions within which the Late Permian Siberian Trap volcanic flood basalts flowed back to their likely volcanic throat origin points (Figure 17). The western volcanic flood basalts converge on a single point of origin at the western end of the Taimyr Fold belt (Figure 17). The eastern Late Permian Siberian Trap volcanics appear to be a giant sheet-like flood of basalts fed from a whole string of linked volcanoes or a major fissure eruption along the central part of the Taimyr Fold Belt (Figure 17).
The subducting Kara plate first intersected the front of the Siberian Craton at the south west end of the Taimyr Fold Belt at a depth of some 172 km where the ambient temperature of the Asthenosphere had reached about 1040°C. (Figures 17 and 13a). These thoeliitic magmas rose some 28.5 km driven by high geothermal geopressured carbon dioxide released by the Kara plate before they passed into the solidus+water zone (Figure 13a).
The initial Siberian Trap volcanics on the SW end of the Taimyr Volcanic Arc erupted from a single group of volcanoes producing a radial zone of flood basalts. The subducting Kara plate then progressively struck the Siberian cration at about 194 km in the centre of the Taimyr volcanic arc and then 216 km at its NE end while the temperature of the surrounding asthenosphere rose from 1100°C to 1150°c (Figures 17 and 13a). These much higher temperatures and the fact that the subducting Kara plate immediately entered the solidus + water zone at the north east end of the Taimyr Volcanic Arc meant that the thoeliitic volcanics here were extremely fluid and contained large volumes of free water and carbon dioxide (Figure 17 and 13a). The determined temperature range for the Taimyr Volcanic Arc magmas between 1040°C to 1150°C with a mean of 1100°C (Figure 13a) are exactly within the magma temperature range for flood basalt provinces (1000°C to 1200°C) (Baker et al. 1999) and the mean 1100°C is very close to the determined melting temperatures of the extensive Columbia River flood basalts (1080°C to 1100°C)(Wales 2014).
The dehyration and melting events above the Kara Plate beneath the Late Permian Taimyr Volcanic Arc initiated a massive eruption phase along the entire central and north eastern part of the arc producing an extremely wide and thick sheet-like succession of flood Trap lavas and tuffs that spread to the SE over the Siberian Craton (Figure 17). The massive volume of carbon dioxide released into the atmosphere during these cataclysmic eruptions produced extreme global warming of the atmosphere and oceans which disocciated the Paleo Arctic subsea methane hydrates and the methane hydrate seals above the Enrico Pv Anomaly generating a massive seafloor and mantle methane pulse into the atmosphere (This Paper; Wignall. 2009; Carter 2013). This release of methane caused the average atmospheric temperature to rise to about 26.6°C producing the Major Late Permian Extinction Event (Wignall, 2009). Our present extreme fossil fuel driven, carbon-dioxide global warming is predicted to produce exactly the same methane release by the 2050's with total deglaciation and the extinction of all life on Earth (except perhaps at the deep oceanic black smokers (Figure 13b).
The Japan Subduction Zone Compared to the Kara Subduction Zone. The Taimyr Volcanic Arc and its Relevance to the Extreme Volcanicity of the Siberian Trap Basalts
During the Late Permian (250 Ma) the Kara subduction zone (suture) was located some 670 km northwest of the NNE trending mantle fracture zone along which a series of kimberlites intruded between 245 Ma and 228 Ma (Figures 17 to 19; LIP 2013). Mantle pressure-temperature data indicate that these kimberlites must have been erupted with abundant water and carbon dioxide, rising vertically above the dehydrating Kara subducting plate when it was between 250 km and 300 km depth (Figure 13a). The presence of similar aged (250 Ma to 228 Ma) kimberlites NW of the main NE trending kimberlite mantle fracture zone imply that the main fracture to the SE most closely represents an approximate 300 km deep contour line, representing the cut off depth for kimberlites on the upper surface of the Kara subducting plate. This gives a mean dip of the Kara Subduction Zone of 24.2°. This 300 km cut off depth for kimberlites also corresponds to the contour line on the upper surface of a subducting plate where earthquake foci change from tensional (above 300 km) to compressional below 300 km (Allen and Allen, 1990).
The 5 Ma time difference between the age of the Siberian Trap lavas (250 Ma) and the earliest time of Late Permian kimberlite eruption (245 Ma ) suggests that the Kara plate began to be subducted around 259.6 Ma in the Middle Permian at a rate of some 4.8 cm/yr beneath the Siberian Craton (Figure 17 to 19; LIP 2013). 100 million years ago, the mean subduction rate along the Japan suture beneath the Asian continent was 12.7 cm/year and the suture had a dip angle of some 40 degrees (Windley, 1986; LIP 2013). The mean dip of subduction zones beneath continental regions lies close to 53° (range from 40° to 70°) with a mean rate of subduction of 8.6 cm/yr (range 5.8 cm/yr to 12.7 cm/yr)(Windley 1986). However in Peru the subuction zone has a mean dip of 14o beneath South America (Allen and Allen, 1990). For plates that subduct only slowly, they may heat up a sufficient amount to prevent earthquakes (Allen and Allen, 1990).
The reason for the shallow dip of the subducting Kara plate (24.2°) may have been caused by the proximity of the Kara mid-ocean ridge rift and the Kara suture. This meant that the Kara subducting plate had a very narrow fetch of ocean to cool in and was consequently less dense than the present oceanic plates in the Pacific subduction zones, so its increased buoyancy meant that it subducted at a much shallower angle (24.2o) under the edge of the Siberian Craton (Figure 17). Because of the very slow rate of subduction of the Kara plate (4.8 cm/yr) it had a long residence time in contact with the continental crust allowing metamorphic reactions and dehydration to go to completion throughout the entire depth of the oceanic crust (Winkler, 1976). Consequently when the Kara plate contacted the hot asthenospheric wedge between 172 km and 216 km beneath the Siberian Craton at temperatures between 1040°C and 1100°C (Figure 13a), the entire oceanic crustal section was remobilised and erupted as the widespread Siberian Trap lavas and tuffs and was also injected as sills (Ivanov et al. 2008; LIP 2013).
The Siberian Trap flood basalts, tuffs and associated intrusives are the largest magmatic igneous province emplaced on continental lithosphere (Ivanov et al 2008). They cover an area of 7 million square km and represent a volume estimated between 4 and 16 million cubic kilometres (Ivanov et al. 2008). The width of the Taimyr Volcanic Arc is estimated at 453 km (from Ivanov et al. 2008) and if we assume the entire 10 km thickness of oceanic crust was remobilised during this massive eruptive event then some 884 km to 3535 km of ocean crust would need to be subducted to generate the volume of the Siberian Trap Large Igneous Province. As the Kara plate was being subducted at 4.8 cm/yr this suggests that the Siberian Trap lavas were erupted in the Late Permian (250 Ma ago) over a time period somewhere between 18,400 years to 73,650 years in length (LIP 2013).
Subduction appears to have begun on the NE end of the Kara Subduction Zone 6 Ma before it began on it's SW end which suggests that the giant transform on the SW side of the Kara subduction zone was active between 263 Ma and 257 Ma allowing the ocean floor to expand without being subducted (Figure 17). This giant transform/shear zone can be tracked right into Central Siberia along the SW margin of the Siberian Trap sheet flood basalt flows (Figure 17). Although the start of subduction moved SW along the Kara subduction zone at some 7.1 cm/yr, the kimberlites which fill the NE trending mantle fracture SE of the Taimyr Volcanic Arc get younger to the NE at a rate of 2mm/yr related to the general NE younging of the Subduction zones from the Upper Silurian - Lower Devonian Scandinavian Caledonian suture in the SW to the Late Permian Kara Subduction Zone in the NE (Figure 17 and 19, LIP 2013).
Porosity in the Shallow and Deep Arctic Crust and Mantle
Sohn et al. 2007 outlined how in the Arctic Ocean, the sequence of extreme pyroclastic mantle magma eruptions developed along the Gakkel Ridge (85o E volcanoes) at an ultra-slow spreading rate (< 15 - 20 mm/year). These volcanoes formed from the explosive eruption of gas-rich magmatic foams. Long intervals between eruptions during the slow spreading caused huge gas and other volatile buildup at extremely high storage pressures very deep in the crust (Sohn et al. 2007).
A swarm of earthquakes at 85° E occured over 3 months but was followed by other earthquakes caused by large implosions due to the explosive discharge of pressurized magmatic foam. This pressurized mgmatic foam was sourced from a deep lying magma chamber, accelerated rapidly vertically and then expanded and decompressed through the fractured chamber roof. There were many periods of widespread explosive gas discharge from 1999 over two years which were detected by small-magnitude sound signals recorded in seismic networks on the ice (Sohn et al. 2007).
 Pyroclastic rocks at the 85° E volcanoes contain bubble wall fragments and were widely distributed over an area of more than 10 square km.
This deep oceanic fragmentation was caused by the accumulation of a volatile rich gas foam within the magma chamber, which then fractured, formed a pyroclastic fountain 1 to 2 km high in the Arctic Ocean which spread the pyroclastic material over a region whose size was proportional to the depth of the magma chamber (Table 2).
A volatile carbon dioxide content of 14% (Wt./Wt. - volume fraction 75%) is necessary at the 4 km depth in this part of the Eurasian Basin (Arctic Ocean) to completely fragment the erupting magma (Sohn et al. 2007). This is evidence for a very high existing porosity (14%) in the Gakkel Ridge, slow spreading mid-ocean ridge magmas along the trend of the Arctic Ocean - Eurasian Basin (Figures 1 and 17).
Pyroclastic rocks at the 85° E volcanoes contain bubble wall fragments and were widely distributed over an area of more than 10 square km. This deep oceanic fragmentation was caused by the accumulation of a volatile rich gas foam within the magma chamber, which then fractured, formed a pyroclastic fountain 1 to 2 km high in the Arctic Ocean which spread the pyroclastic material over a region whose size was proportional to the depth of the magma chamber (Table 2). A volatile carbon dioxide content of 14% (Wt./Wt. - volume fraction 75%) is necessary at the 4 km depth in this part of the Eurasian Basin (Arctic Ocean) to completely fragment the erupting magma (Sohn et al. 2007). This is evidence for a very high existing porosity (14%) in the Gakkel Ridge, slow spreading mid-ocean ridge magmas along the trend of the Arctic Ocean - Eurasian Basin (Figures 1 and 17).
The pressure and shear wave velocity of sound passing through the Earth's crust and mantle rocks containing flat, oriented, gas-filled cracks depends on the elastic constants of the rock, its porosity, the direction the sound wave is travelling and the aspect ratio of the cracks (Figures 14a and 14b)(Anderson et al. 1974). The aspect ratio of the gas-filled, penny-shaped, ellipsodal, aligned cracks (ratio width to diameter) has been assumed to be 1/20 (Anderson et al. 1974). The cracks could contain different amounts of other fluids, producing more variables in the equations but only dry, gas-filled cracks are considered here (Figure 14c)(Anderson et al. 1974). The most common mineral in mantle rocks, elongated olivine crystals are usually oriented parallel to the vertical cracks and the mantle flow direction beneath mid-ocean ridges and in subduction zones (Figure 14b)(Anderson, 1989).
O'Connel (Liu et al. 2001) determined that the crack porosity N (volume percentage of micro-cracks in the rock) can be determined as below:-
N = (c/a)*((4*Pi*E)/3) = (4/60)*Pi*E = (Pi*E)/15 Where c/a = 1/20
E = crack density for dry gas-filled fractures
E = ((45/16)l(V-V")/(1-(V"*V"))l*(2-V"))/(((1+3V)*(2-V")) - (2*(1-(2*V))))
Where V = Poissons Ratio for uncracked rock
V" = Poissons Ratio for cracked rock
Poissons Ratio V = (1/2)*(((Vp/Vs)*(Vp/Vs))-2)/(((Vp/Vs)*(Vp/Vs))-1)
Where Vp = pressure velocity of sound waves in the rock
Vs = shear velocity of sound waves in the rock
(See:- Liu et al 2001; Anderson 1989; Anderson et al. 1974)
Sound wave velocities are slowed in the direction at right angles to the plane of gas-filled cracks and elongated olivine crystals in mantle rocks (See Figure 14b and 14c in Anderson 1989). The vertical micro -crack gas filled porosities for the Enrico Pv Anomaly at 100 km and 220 km depth were calculated from pressure wave dv/V% anomalies ( Yakovlev et al. 2012; Gaina et al. 2013) and are shown on Figures 14a and 15. To give a relative comparison, the mean horizontal gas filled porosities in the mantle outside the Enrico Pv Anomaly were determined using the Preliminary Reference Earth Model (PREM) from Dziewonki and Anderson (1981)(Figures 14a and 15).
Figure 15 shows that the gas-filled vertical crack porosity within the Enrico Pv Anomaly decreases from about 1.2% at 300 km depth to 0.43% at the top of the mantle methane generation zone in the asthenosphere at 100 km depth and then rises again to 14% in the crust where pyroclastic magmas beneath the Gakkel Ridge require these high carbon dioxide volumes to produce the extreme pyroclastic eruptions at subsea depths of 4 km in the Arctic Ocean (Sohn 2007). For comparison, the average porosities around the Enrico Pv Anomaly determined from mean PREM data (Dziewonski and Anderson, 1981) are generally less than 0.26% above 220 km depth (Figure 14a and 15).
Note that in the average asthenosphere (PREM data Dziewonski and Anderson, 1981) there appears to be a zero porosity seal line at 114.4 km forming a transition from horizontal micro-crack porosity within the underlying horizontally micro-cracked convecting asthenosphere which drives plate tectonics. This horizontally convecting asthenosphere contains horizontally oriented elongated olivine crystals. Above 114.4 km, vertical micro-crack porosity occurs within the upper asthenosphere, where vertically rising partial melt magmas (with verically oriented elongated olivine crystals) accumulate at the base of the lithosphere at 100 km (Figures 14a and 15). The vertically micro-fractured zone between 114.4 km and 100 km in the asthenosphere also corresponds to the zone between 100 km and 110 km where normal island arc volcanics form vertically rising magmas above a subduction zone from the effect of fluids released into the asthenosphere from dehydration of the subducting slab of oceanic crust (Lecture 5 2014; Columbia, 2014).
The estimated times that the different depths of the Enrico Pv Anomaly will degas methane upwards into the Arctic Ocean and the global atmosphere were calculated from the rate of expansion of the Global Warming Methane Veil (the southern latitudinal front of 1850 ppb global atmospheric methane concentration - Carana 2014) and these times are shown on Figure 15. The Enrico Pv Anomaly will degas down to 300 km by 2053 at which time the the global mean atmospheric temperature anomaly will have reached 8°C and mankind will be facing total deglaciation and extinction (Light 2013, 2014; Carana 2013).
The Plate Tectonic Location of Mantle Carbon Dioxide and Mantle Methane Emission Zones
The the carbon dioxide enriched (14% v/v CO2) mantle magmas at the 85° E subsea slowly opening Gakkel mid-ocean ridge have erupted as pyroclastic volcanoes at a depth of 4 km on the seafloor (Sohn et al. 2007). These extensive pyroclastic volcanoes, on a very slowly spreading mid ocean ridge are evidence that this region probably represents a stable hot spot which underlay the intersection of the Kara mid-oceanic ridge in the Barents Sea and the major deep penetrating transform that later became the Gakkel Ridge spreading centre (Figure 17). This suggests that carbon dioxide is the main remaining volatile in very slowly spreading mid-oceanic ridge pyroclastic systems where the regional mantle has become depleted in water. Elsewhere fast expansion, such as along the Pacific mid-ocean ridge is due to normal eruption of more water-rich magmas as pillow lavas (Windley 1986).
The extensive 85°E pyroclastic volcanics, at the intersection of the Kara mid ocean ridge and the plate boundary forming the axis of the Paleo - Gakkel Ridge are probably located at the apex of a hot-spot mantle plume that has remained relatively stationary (within 5°) from the Late Permian (250 Ma) to the present as did other hotspots in the Atlantic and Pacific from 200 Ma to 20 Ma (Figure 17)(Morgan 1981, Windley, 1986). However a massive series of swarms of diamondiferous kimberlites that have intruded along a major NE trending mantle fracture parallel to the Late Permian Kara suture and get younger to the north from 370 Ma, 245 Ma, 228 Ma to 90 Ma (LIP, 2013) suggest that subduction activity along the regional suture system migrated from west to east over that time period (Middle Devonian - Triassic)(Figures 17 to 19)(LIP 2013). These kimberlites are related to the Late Permian Kara subduction event and formed when the oceanic crust had reached a depth of some 300 km beneath the Siberian Craton (Figures 17 to 19).
The Kara subduction zone was most active in the Late Permian (250 Ma) resulting in massive eruptions of the Siberian Trap, carbon dioxide rich lavas, tuffs and sills (LIP 2013; Wignall 2009)(Figure 17). The release of this vast volume of carbon dioxide into the atmosphere resulted in extreme global warming, destabilization of subsea Paleo - Arctic methane hydrates, the release of vast volumes of methane into the atmosphere which then caused the mean temperature of the atmosphere rise to 26.6o C and precipitated a major extinction event (Figures 17 to 19)(LIP, 2013; Wignall 2009).
The Late Permian subduction along the Kara subduction zone was preceeded to the west by Caledonian subduction along the Scandinavian and N. German Polish suture lines (420 Ma - 370 Ma - 360 Ma) (Cocks and Torsvik 2006 and Zwart and Dornsiepen 1980) and a similar trend of diamondiferous kimberlites in Finland, Kola Peninsula and Arkangelsk dated 380 Ma to 360 Ma in age (Mahotkin et al 1999) are related to this subduction event when the oceanic crust had also reached a depth of some 250 km to 300 km beneath the Finnish and Russian cratons (Figure 17).
From the Late Permian (250 Ma) to the present, the oceanic crust that had been subducted along the Taimyr suture and now lies beneath the Siberian Craton has been heated by the adjacent sub-Siberian mantle wedge (Figure 17 and 13a). Water, oceanic carbonates and iron (II) oxides trapped within the mantle at depths below 100 km to 300 km and temperatures above 1200°C have been converted into vast volumes of mantle methane (Figure 12, 13a and 17; Merali 2004; Goho 2004 and Scott et al. PNAS). This mantle methane now forms a giant geopressured-geothermal reservoir which is using the Enrico Pv Anomaly extreme methane eruption zone as an escape route to the Arctic Ocean and the atmosphere (Figures 4, 6, 13a, 15 and 17). When Arctic ocean temperatures were low, methane hydrate crystallized in the vertical fracture conduit systems because of gas depressurization (adiabatic cooling) and the geothermal geopressured mantle methane was sealed underground in the Enrico Pv Anomaly (Figure 13a, 17, 20a and 20b; Carana 2013; Hovland et al. 2006). When recent extreme fossil fuel burning-carbon-dioxide-induced global warming heated the Gulf Stream and then the Arctic waters, they dissasociated the methane hydrate seals on the vertical fracture conduit systems at the top of the Enrico Pv Anomaly and geopressured methane began to erupt into the ocean and enter the atmosphere as is presently the case at the Extreme Methane Eruption Centre on the Enrico Pv Anomaly (Figures 3, 4, 13a, 15 and 17)( Light, 2012, Pravettoni, 2008. Evidence for a deep mantle source for this methane is the extremely high methane emission rates at the Enrico Pv anomaly compared the the generally lesser amounts of methane released from dissociation of subsea Arctic methane hydrates on the East Arctic Siberian Shelf (Figure 4 - Pravettoni 2008) and the fact that some regional emissions track along deep mantle fault lines related to the northern border of the Greenland plate (Figure 3a Carana 2014).
The Enrico Pv Anomaly Extreme Methane Emission Zone - A Deep Penetrating Mantle Safety Valve - Now Open to Vertically Rising Geothermal - Geopressured Mantle Methane formed between 100 km and 300 km in the Asthenosphere.
Hovland et al. (2006) (Figure 20a, 20b; Carana 2011) show that submarine pingoes form seals in vertical methane charged fractures cutting through shallow methane hydrates and trapped free methane in the pock-marked sea floor at Nyegga in the Norwegian Sea. These gas escape conduits are sealed by methane hydrate that formed from depressurization (adiabatic cooling) when methane escaped from the underlying methane hydrates or from deep mantle methane sources in the past and came in contact with the cold Arctic Ocean water (Carana, 2011; Light, this article).
Globally heated seawater, drawn down fractures, cracks and conduits in the sea floor flanking the Gakkel Ridge can destabilize the methane hydrate in the pingoes and in the hydrates resulting in huge abrupt release of methane into the sea and atmosphere (Figure 13b, Wales 2012; Carana, 2013; Light 2013).
During periods when the carbon dioxide content of the atmosphere was reduced and conditions were mild, methane hydrates formed from the depressurizing (adiabatic cooling) of deeply sourced mantle methane formed very effective seals in the linked verticle fractures at the Enrico Pv Anomaly confining the mantle methane in undersea rock formations (Figures 6, 13a and 15). This mantle methane was therefore not able to enter the sea or the atmosphere and cause extreme global warming. However the major global warming caused by humanities sustained and stupid use of fossil fuels in preference to sustainable energy sources has destabilized the methane hydrate seals (pingoes) above the Enrico Pv Anomaly now giving it free rein to vent more and more geopressured mantle methane directly into the sea and the atmosphere.
The methane partial pressure calculated from the rate of advance of the latitudinal front of the 1850 ppm atmospheric Methane Global Warming Veil, that has now passed the Gulf Coast of the United States indicates a depth of origin of the geopressured-geothermal methane of some 112 km in the upper asthenosphere within the mantle methane generation zone (Figures 13a and 15). Calculations show that by the Mid 21st Century, the Enrico Pv Anomaly extreme methane emission zone will be draining methane from as deep as 300 km, the mean temperature of the earth's atmosphere will be 8° C hotter and we will be facing total deglaciation and extinction (Light, 2012; Carana 2012).
What mankind has done in his infinite stupidity with his extreme hydrocarbon addiction and fossil fuel induced global warming has opened a giant, long standing (Permian to Recent) geopressured mantle-methane pressure-release safety valve (Enrico Pv Anomaly Extreme Methane Emission Zone) for gases generated between 100 km and 300 km depth and temperatures above 1200°C in the Asthenosphere. There is now no fast way to reseal this system because it will require extremely quick cooling of the Arctic Ocean, which cannot be achieved in the short time frame we have left to complete the job. Our only hope is to destroy the methane in the water before it gets into the atmosphere and simultaneously destroy the existing atmospheric methane using radio-laser systems (Alamo and Lucy Projects, Light and Carana, 2012, 2013).
Scientists at Georgia Tech University have found that at very low temperatures in the ocean, two symbiotic methane eating organisms group together, consume methane and excrete carbon dioxide which then reacts with minerals in the water to form carbonate mounds (Glass et al. 2013). These two symbiotic creatures, the bacteria and anaerobic methanotrophic archaea form bundles and require an enzyme (formyl methofuran dyhydrogenase) in the final methane oxidation reactions to convert methane to carbon dioxide. However these organisms need tungsten for this process to operate (Glass et al. 2013). In the low temperature environments of the methane seeps, tungsten appears easier for the organisms to use than molybdenum (Glass et al. 2013).
A method must be immediately developed for growing these methane consuming organisms in great quantities and delivering them with their vital tungsten operating enzyme to the Arctic Ocean. The Arctic Ocean, west of Svalbard in the area south of the ice-front, where the West Spitbergen Current dives beneath the ice should be continuously seeded (possibly by aircraft or boats) with these methane consuming bacteria and tungsten enzymes, as should the Yermack Current in the Barents Sea. The entire length of the Eurasian Basin, The Enrico Pv anomaly extreme emission zone and Laptev Sea should also be seeded during the summer season when the ice cap has receeded from these regions. As the Arctic ice cap shrinks, the size of the area that needs to be seeded will grow requiring greater resources from the worlds nations. This has to be done for our very future existence depends on it. Similar seeding should be done with currents flowing beneath the Antarctic ice cap to prevent the release of large quantities of methane into the atmosphere from the destabilization of methane hydrates there. This means that the United States must fund a major project at Georgia Tech to quickly develop the means to grow these methane consuming bacteria in massive quantities with their tungsten enzyme and find the means to deliver them to the Polar oceans as soon as possible.