Arctic sea ice extent has fallen strongly over the past few weeks and looks set to keep falling rapidly over the next few months.

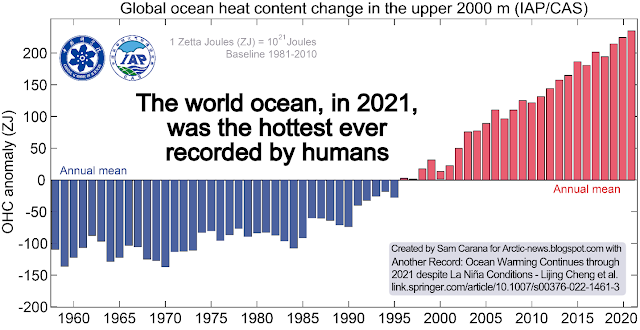
Ocean heat is at record levels, as illustrated by the image below and as discussed in an earlier post.


As said, ocean heat is at record levels. This is heating up the air over the Atlantic Ocean. At times, huge amounts of heat are getting pushed into the Arctic due to a distorted Jet Stream. The image on the right shows the Jet Stream on the Northern Hemisphere on March 16, 2022, with strong winds at 250 hPa pushing heat from the Atlantic Ocean into the Arctic.
Furthermore, the Gulf Stream is pushing huge amounts of ocean heat toward the Arctic.
Furthermore, the Gulf Stream is pushing huge amounts of ocean heat toward the Arctic.
The image below shows that sea surface temperatures were as much as 14.1°C or 25.3°F higher than 1981-2011 off the North American coast (green circle) on March 5, 2022.

The image below shows that, on March 16, 2022, the temperature in the Arctic was 3.5°C higher than 1979-2000.

Below, a Climate Reanalyzer forecast for March 18, 2022, of very high temperature anomalies over Antarctica combined with a forecast of a diversion over Antarctica of the Southern Polar Jet Stream (wind at 250 hPa).

As the combination image below shows, the temperature on Antarctica was 12.5°C or 54.4°F at 1000 hPa at the green circle on March 17, 2022 at 17:00 UTC. The image in the left panel shows high sea surface temperature anomalies south of Australia, while the Jet Stream (250 hPa) moves over Antarctica. The image in the right panel shows wind and temperature at 1000 hPa.

• Emissions by people heat up the air, and heat up oceans and make winds stronger, as discussed in an earlier post.
• Another mechanism affecting the Jet Stream is that, as oceans heat up, the temperature difference between land and oceans widens both in Summer and in Winter and this can cause the Jet Stream to divert deeper from the narrow path it used to follow, as discussed in an earlier post.
• What especially affects the Jet Stream on the Northern Hemisphere is that, as the Arctic gets hit hard by temperature rises, the temperature difference narrows between the Arctic and the Equator, slowing the Jet Stream; this can prolong and amplify extreme weather events.
Signs of the things to come
Rise due to La Niña and high sunspots
The image below indicates that the global temperature difference between the top of an El Niño and the bottom of a La Niña period could be more than half a degree Celsius.

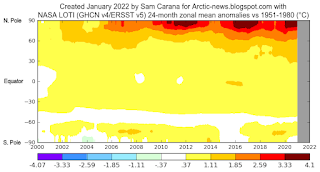
This is illustrated by the image on the right, created with a NASA image that shows temperature anomalies of up to 4.1°C (versus 1951-1980) over the Arctic Ocean.

The next image on the right, by Climate Reanalyzer, illustrates that very high temperature anomalies can show up at the highest latitudes North during Winter on the Northern Hemisphere, in this case a temperature anomaly (vs 1979-2000) of 7°C for the Arctic as a whole on February 28, 2022.
It is ominous for such high anomalies to show up in the Arctic during a La Niña period, and when it's Winter on the Northern Hemisphere when there's only very little sunlight reaching the Arctic.

We're currently in the depth of a persistent La Niña, as illustrated by the next image on the right, adapted from NOAA. This has been suppressing the temperature and it will keep suppressing the temperature until the start of the next El Niño. The next El Niño could push temperatures up even more strongly than the average El Niño, for a number of reasons.

Currently, the temperature rise is additionally suppressed by low sunspots. Within a few years time, sunspots can be expected to reach the peak of their current cycle. Observed sunspots look stronger than predicted, as described at the sunspots page. According to IPCC AR4, warming by solar irradiance ranges from 0.06 to 0.3 W/m².
Rise due to further elements
 |
| [ from the Extinction page ] |
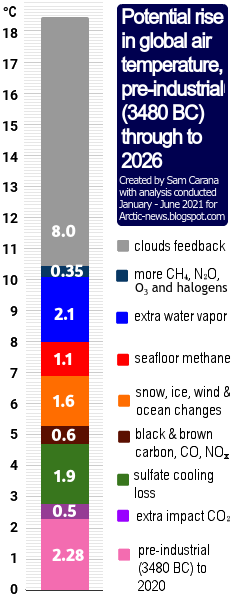
On top of the temperature rise that can be expected to unfold over the next few years due to variables such as an upcoming El Niño and high sunspots, there is the temperature rise due to further elements.
One of these elements causing the temperature to rise is the falling away of sulfate aerosols, while there could be a further temperature rise due to releases of other aerosols that have a net warming impact, such as black and brown carbon, which can increase dramatically as more wood burning and forest fires take place.
One of these elements causing the temperature to rise is the falling away of sulfate aerosols, while there could be a further temperature rise due to releases of other aerosols that have a net warming impact, such as black and brown carbon, which can increase dramatically as more wood burning and forest fires take place.
As the temperature of the atmosphere rises, this will trigger self-reinforcing feedbacks such as an increase in water vapor combined with a decrease in lower clouds decks, further increasing the temperature, as described at the clouds feedback page.
What could further push up temperatures a lot over the next few years is the compound impact of feedbacks in the Arctic, including decline of the snow and ice cover, releases of greenhouse gases from degrading subsea and terrestrial permafrost, and further distortion of the Jet Stream causing more extreme weather events.
Conclusion
The situation is dire and calls for the most comprehensive and effective action, as described at the Climate Plan.
Links
• Albedo loss in Antarctica
https://arctic-news.blogspot.com/2022/02/albedo-loss-in-antarctica.html
• NSIDC - Charctic interactive Sea Ice Graph
https://nsidc.org/arcticseaicenews/charctic-interactive-sea-ice-graph
• Nullschool.net
https://earth.nullschool.net
• Climate Reanalyzer
https://climatereanalyzer.org
• Accelerating loss of global snow and ice cover
https://arctic-news.blogspot.com/2022/02/accelerating-loss-of-global-snow-and-ice-cover.html
• Why stronger winds over the North Atlantic are so dangerous
• Climate Reanalyzer
https://climatereanalyzer.org
• Accelerating loss of global snow and ice cover
https://arctic-news.blogspot.com/2022/02/accelerating-loss-of-global-snow-and-ice-cover.html
• Why stronger winds over the North Atlantic are so dangerous
https://arctic-news.blogspot.com/2020/02/why-stronger-winds-over-north-atlantic-are-so-dangerous.html
• Human Extinction by 2022?
• More Extreme Weather
https://arctic-news.blogspot.com/2021/02/more-extreme-weather.html
• NASA Temperature Analysis
https://data.giss.nasa.gov/gistemp
• Human Extinction by 2022?
• More Extreme Weather
https://arctic-news.blogspot.com/2021/02/more-extreme-weather.html
• NASA Temperature Analysis
https://data.giss.nasa.gov/gistemp
• NOAA - ENSO: Recent Evolution, Current Status and Predictions
https://www.cpc.ncep.noaa.gov/products/analysis_monitoring/lanina/enso_evolution-status-fcsts-web.pdf
• Historical change of El Niño properties sheds light on future changes of extreme El Niño - by Bin Wang et al.
• Historical change of El Niño properties sheds light on future changes of extreme El Niño - by Bin Wang et al.
https://www.pnas.org/content/116/45/22512
• Tipping the ENSO into a permanent El Niño can trigger state transitions in global terrestrial ecosystems - by Mateo Duque-Villegas et al.
• Tipping the ENSO into a permanent El Niño can trigger state transitions in global terrestrial ecosystems - by Mateo Duque-Villegas et al.
https://arctic-news.blogspot.com/2022/02/accelerating-loss-of-global-snow-and-ice-cover.html
• Sunspots
https://arctic-news.blogspot.com/p/sunspots.html
• Aerosols
https://arctic-news.blogspot.com/p/aerosols.html
• Sunspots
https://arctic-news.blogspot.com/p/sunspots.html
• Aerosols
https://arctic-news.blogspot.com/p/aerosols.html
• Clouds feedback
• Feedbacks in the Arctic