Thursday, November 14, 2013

Horrific amounts of methane over Laptev Sea


For some time now, very high methane readings have been showing up over the Laptev Sea. Harold Hensel recently posted the image below with the huge areas solidly colored red indicating release of horrific amounts of methane. Harold adds the following comment:

"I am fighting for the lives of my children, grandchildren, and great grandchildren who's lifespan will extend 30 to 40 years from now. I am also fighting for all children of the world, animals, whales, dolphins, flowers and all living things. They are all in peril and we are the ones that may have a chance of doing something about it now. The threat of what is coming must sink in."


[ click on image to enlarge ]
The image below shows methane readings over a one-month period. As the image illustrates, high methane emissions, i.e. at 1850 ppb and higher, are more prevalent on the northern hemisphere, while emissions on the southern hemisphere are mostly under 1850 ppb. The contours of North America are visible, with Greenland to the north. Further north, over the Arctic Ocean, the color red dominates, indicating emissions of 1950 ppb and higher.


In which part of the Arctic Ocean are most emissions recorded? The image below shows recent methane readings of 1950 and higher, this time colored in yellow, for a period of just over one day during November 12 and 13, 2013. The largest area colored solid yellow is over the Laptev Sea, just north of Siberia.

[ click on image to enlarge ]
Below is an image of the same period as above image, but once more showing methane levels in ranges, i.e. readings of 1950 ppb and higher in red, as well as lower readings in orange and yellow. Over the Arctic Ocean, high methane readings dominate the picture, both readings of 1950 ppb and higher, and readings in the range of 1850 ppb to 1950 ppb.

[ click on image to enlarge ]
What makes high methane releases over the Laptev Sea so scary?
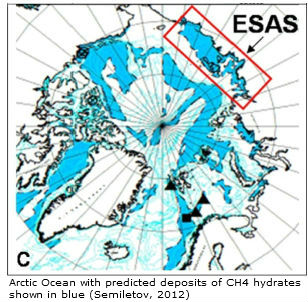
Vast amounts of methane are held in sediments under the Arctic Ocean. The Laptev Sea is part of the Eastern Siberian Arctic Shelf (ESAS, the rectangle on the image on the right). Shakhova et al. (2010) estimate the accumulated methane potential for the ESAS alone as follows:
  • organic carbon in permafrost of about 500 Gt
  • about 1000 Gt in hydrate deposits
  • about 700 Gt in free gas beneath the gas hydrate stability zone.
Shakhova et al. in 2008 considered release of up to 50 Gt of predicted amount of hydrate storage as highly possible for abrupt release at any time.

By comparison, the total amount of methane currently in the atmosphere is about 5 Gt.


Monday, November 11, 2013

Methane Levels going through the Roof

On November 9, 2013, methane readings well over 2600 ppb were recorded at multiple altitudes, as illustrated by the image below.

[ click on image to enlarge ]
On November 9, 2013, p.m., methane readings were recorded as high as 2662 parts per billion (ppb), at 586 millibars (mb) pressure, which corresponds with an altitude of 14384.6 feet or 4384.4 meters.

Where did these high levels occur? Methane levels were low on the southern hemisphere and, while there were some areas with high readings over North America and Asia, there were no areas as wide and bright yellow as over the Arctic Ocean (the color yellow indicating readings of 1950 ppb and higher on above map).

As discussed in a previous post, huge amounts of methane are now escaping from the seabed of the Arctic Ocean, penetrating the sea ice, and entering the atmosphere, in a process that appears to be accelerating, resulting in huge amounts of methane in the atmosphere over the Arctic Ocean.

The image below gives an idea of the height of this level, compared to historic levels, and how fast levels of methane (CH4) have been rising compared to levels of two other greenhouse gases, i.e. carbon dioxide (CO2) and nitrous oxide (N2O).


Recent peak levels of methane over the Arctic Ocean may well have been even higher, since NOAA didn't release any readings for November 5-7, 2013.

Meanhwile, sea ice extent has stopped growing, as illustrated by the NSIDC graph below.


Data from the Cryosphere Today show that the area covered by sea ice has actually fallen over the past few days, as illustrated by the image below.

[ click on image to enlarge ]
There are several reasons why sea ice isn't growing, including high temperature anomalies in the Arctic, as illustrated by the NOAA image below, showing surface temperature anomalies of over 20 degrees Celsius on November 7, 2013.


High methane levels are contributing to temperature anomalies, by trapping additional sunlight in the atmosphere over the Arctic Ocean.

Furthermore, strong winds have hit the sea ice, as the recent post Methane, Faults and Sea Ice warned. Strong winds are pushing sea ice inward in the Kara Sea and in the Chukchi Sea, while pushing sea ice - up to 5 meters thick - out of the Arctic Ocean along the coast of Greenland, as illustrated by the Naval Research Laboratory animation below.


The Naval Research Laboratory image below shows ice speed and drift on November 9, 2013.


So, could Arctic sea ice collapse and totally disappear in September 2014? Posts at this blog have repeatedly warned about this, e.g. in this post. The image below, created by Wipneus, shows an exponential trendline pointing at zero volume sea ice in September 2016.
All data over the past two decades have fallen within the 95% confidence limits of an exponential trendline that points at imminent loss of all Arctic sea ice within years. September 2013 may have been "only" the 4th lowest on record, but such variability can be expected and may well cause sea ice to disappear completely as early as September 2014.

Strong winds can speed up such a collapse. On this point, it's good to remember what Prof. Peter Wadhams warned about in 2012:
". . apart from melting, strong winds can also influence sea ice extent, as happened in 2007 when much ice was driven across the Arctic Ocean by southerly winds (not northerly, as she stated). The fact that this occurred can only lead us to conclude that this could happen again. Natural variability offers no reason to rule out such a collapse, since natural variability works both ways, it could bring about such a collapse either earlier or later than models indicate.

In fact, the thinner the sea ice gets, the more likely an early collapse is to occur. It is accepted science that global warming will increase the intensity of extreme weather events, so more heavy winds and more intense storms can be expected to increasingly break up the remaining ice, both mechanically and by enhancing ocean heat transfer to the under-ice surface."
Guy McPherson lists 26 feedbacks that speed up warming, and many of these feedbacks occur in the Arctic, as described in the post Diagram of Doom.

Soon, calculates Prof. Peter Wadhams, the albedo loss due to decline of snow and ice in the Arctic will effectively more than double the net radiative forcing resulting from the emissions caused by all people of the world. Additional warming caused by methane releases from the Arctic seabed could be even more devastating.

Hopefully, more people will realize the urgency of the situation and realize the need for a comprehensive and effective plan of action as described here.

Saturday, November 9, 2013

Norwegian Sea hit by 4.6M Earthquake

In the early morning of November 9, 2013, the Norwegian Sea was hit by an earthquake with a magnitude of 4.6 on the Richter Scale. Earlier (on October 28, 2013), an earthquake with a 5.3 magnitude hit the Greenland Sea closer to Svalbard.

These earthquakes come at a time when huge amounts of methane are rising from the seabed of the Arctic Ocean, from areas on or close to the fault line that crosses the Arctic Ocean. The location of the earthquake that hit the Norwegian Sea is indicated on the map below with a white circle.

[ click on image to enlarge ]

Related

- Greenland Sea hit by M5.3 Earthquake
http://arctic-news.blogspot.com/2013/10/greenland-sea-hit-by-m53-earthquake.html

- Methane, Faults and Sea Ice
http://arctic-news.blogspot.com/2013/11/methane-faults-and-sea-ice.html

- Earthquake hits waters off Japan
http://arctic-news.blogspot.com/2013/10/earthquake-hits-waters-off-japan.html

- Earthquake hits Laptev Sea
http://arctic-news.blogspot.com/2013/09/earthquake-hits-laptev-sea.html

- Methane Release caused by Earthquakes
http://arctic-news.blogspot.com/2013/09/methane-release-caused-by-earthquakes.html

- Earthquake M6.7 hits Sea of Okhotsk
http://methane-hydrates.blogspot.com/2013/10/earthquake-m67-hits-sea-of-okhotsk.html

- Sea of Okhotsk
http://methane-hydrates.blogspot.com/2013/06/sea-of-okhotsk.html


Tuesday, November 5, 2013

Methane, Faults and Sea Ice

Shield breaking down

Until now, Arctic sea ice has been acting as a shield, in a number of ways, including:
  • preventing sunlight from warming up water underneath the sea ice 
  • facilitating currents that currently cool the bottom of the sea
  • preventing much methane from entering the atmosphere; as discussed in an earlier post, the sea ice collects and holds the methane in places close enough to the surface for the methane to be consumed through photochemical and biochemical oxidation. 
However, as the sea ice declines, this shield is breaking down. As a result:
  • more sunlight is reaching the water, contributing to warming of water in the Arctic Ocean
  • sea ice decline comes with the danger of weakened currents that cool the seabed
  • more methane is able to penetrate the cracks and openings in the ever-thinner ice. 
Warm Water traveling along Gulf Stream

At the same time, global warming is causing more extreme weather events to occur, such as the record warmth observed in July 2013 in part of the northeastern Atlantic Ocean off the coast of North America. As discussed in a recent post, this warm water has meanwhile traveled along the Gulf Stream and reached the Arctic Ocean.

Methane venting from Seabed

As a result, warmer water is now destabilizing sediments under the seabed that hold huge amounts of methane in the form of free gas and hydrates. Methane is now venting from the seabed of the Arctic Ocean, driven by sea ice decline and "by Gulf Stream heating, earthquakes and deep pyroclastic eruptions", as Malcolm Light explains in a recent comment and as described in an earlier post.

The image below shows the result: Massive amounts of methane venting from the seabed, penetrating the sea ice, and entering the atmosphere over the Arctic Ocean. 


Methane, Faults and Sea Ice

The animation below illustrates links between: 
  • The fault line that crosses the Arctic Ocean and forms the boundery between two tectonic plates (i.e. the North American Plate and the Eurasian Plate)
  • Arctic sea ice, which until now has acted as a shield
  • The prominence of high methane readings over the Arctic Ocean